Author Archives: Colin Douch
Author Archives: Colin Douch

Cloudflare’s logging pipeline is one of the largest data pipelines that Cloudflare has, serving millions of log events per second globally, from every server we run. Recently, we undertook a project to migrate the underlying systems of our logging pipeline from syslog-ng to OpenTelemetry Collector and in this post we want to share how we managed to swap out such a significant piece of our infrastructure, why we did it, what went well, what went wrong, and how we plan to improve the pipeline even more going forward.
A full breakdown of our existing infrastructure can be found in our previous post An overview of Cloudflare's logging pipeline, but to quickly summarize here:
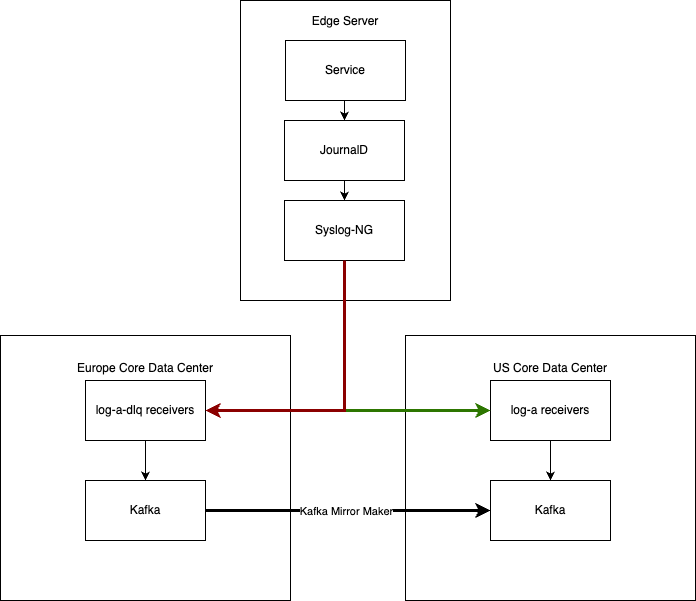
The goal of this project was to replace those syslog-ng instances as Continue reading

Golang 1.20 introduced support for Profile Guided Optimization (PGO) to the go compiler. This allows guiding the compiler to introduce optimizations based on the real world behaviour of your system. In the Observability Team at Cloudflare, we maintain a few Go-based services that use thousands of cores worldwide, so even the 2-7% savings advertised would drastically reduce our CPU footprint, effectively for free. This would reduce the CPU usage for our internal services, freeing up those resources to serve customer requests, providing measurable improvements to our customer experience. In this post, I will cover the process we created for experimenting with PGO – collecting representative profiles across our production infrastructure and then deploying new PGO binaries and measuring the CPU savings.
PGO itself is not a Go-specific tool, although it is relatively new. PGO allows you to take CPU profiles from a program running in production and use that to optimise the generated assembly for that program. This includes a bunch of different optimisations such as inlining heavily used functions more aggressively, reworking branch prediction to favour the more common branches, and rearranging the generated code to lump hot paths together to save on CPU Continue reading