Author Archives: Ivan Babrou
Author Archives: Ivan Babrou
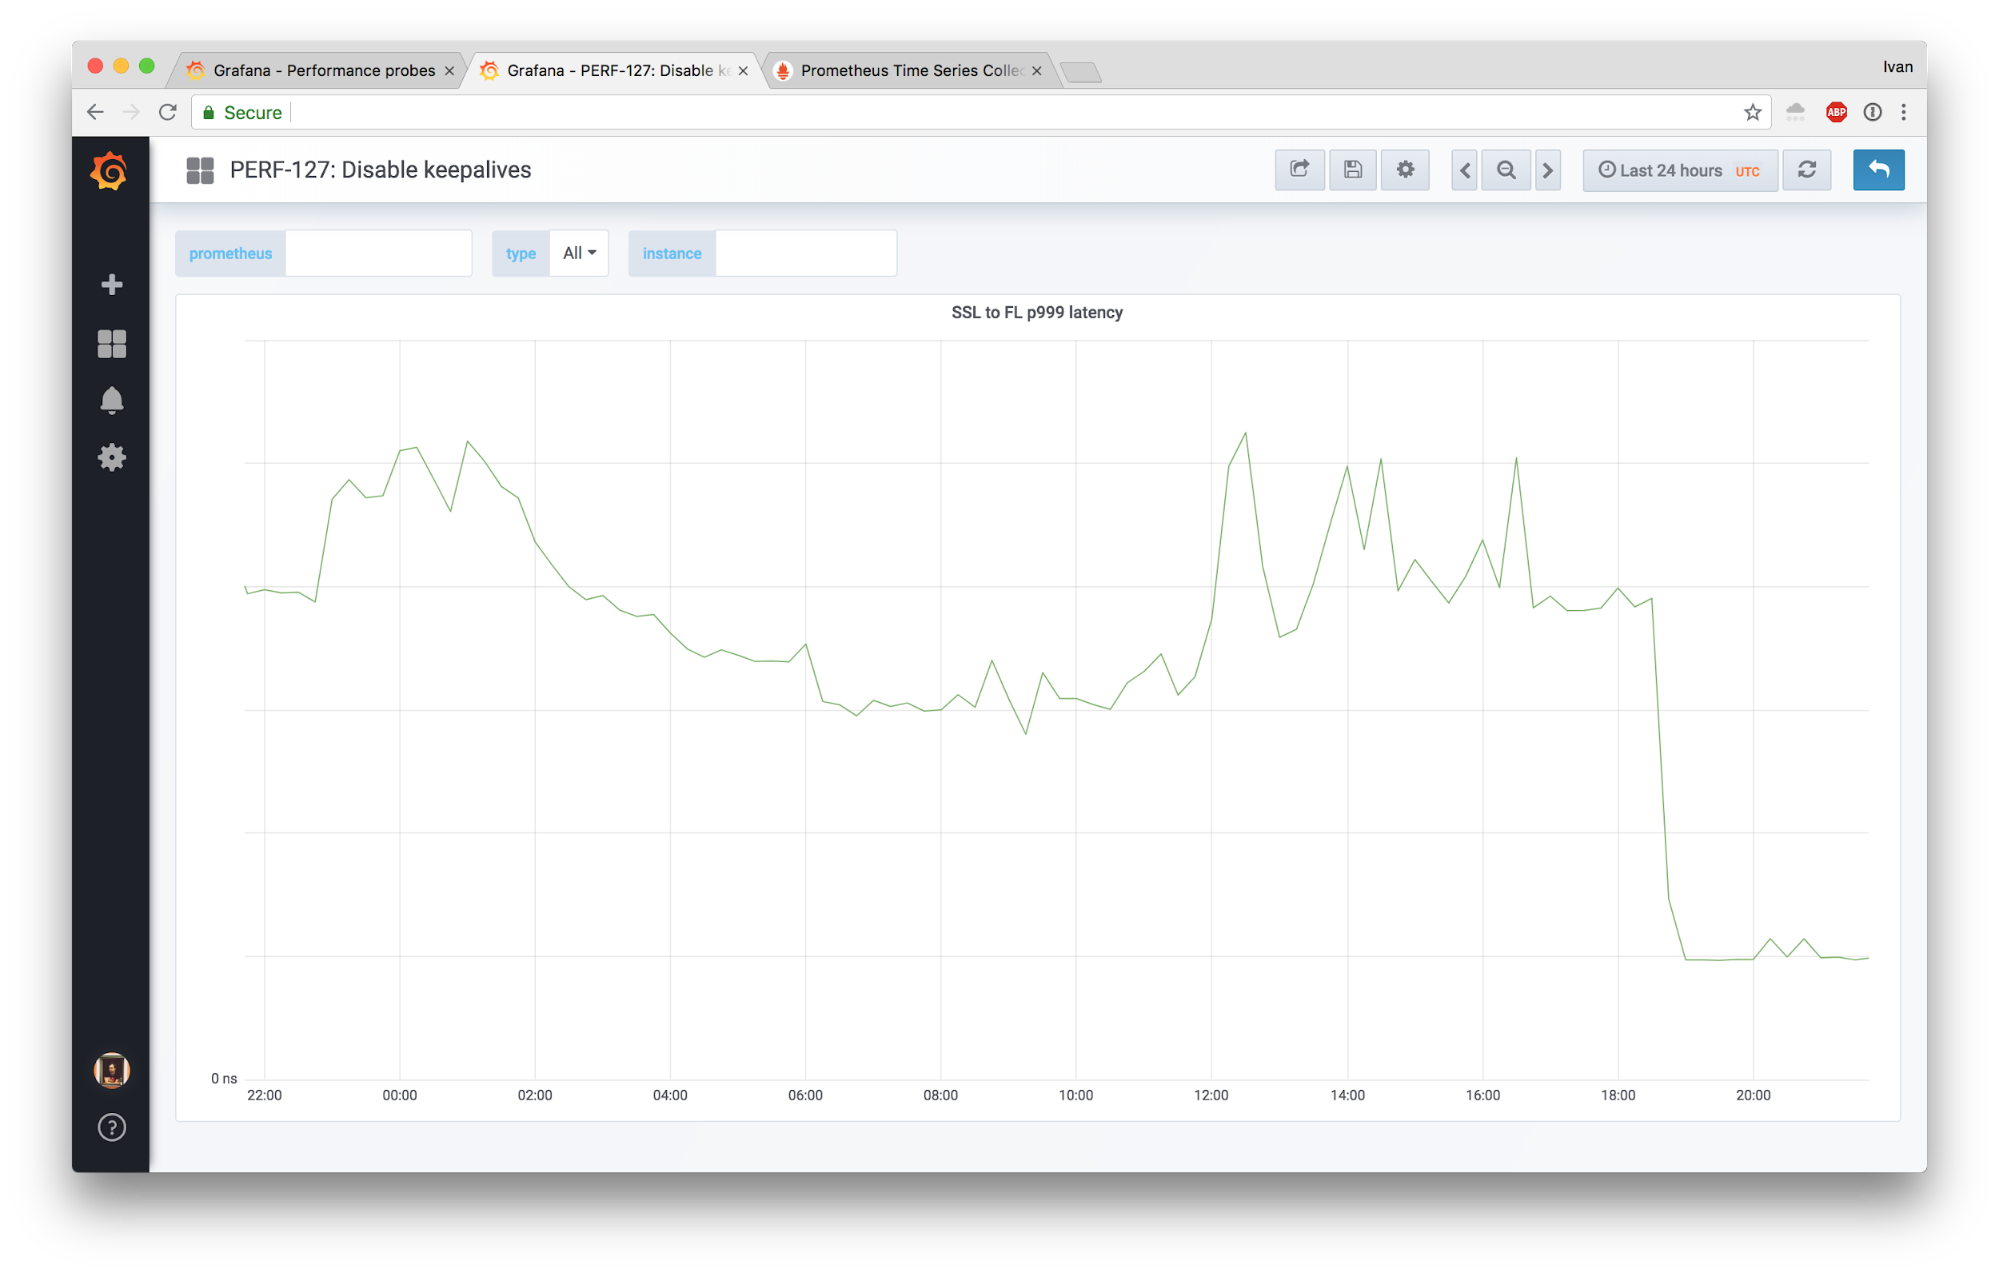
This may sound like a weird title, but hear me out. You’d think keepalives would always be helpful, but turns out reality isn’t always what you expect it to be. It really helps if you read Why does one NGINX worker take all the load? first. This post is an adaptation of a rather old post on Cloudflare’s internal blog, so not all details are exactly as they are in production today but the lessons are still valid.
This is a story about how we were seeing some complaints about sporadic latency spikes, made some unconventional changes, and were able to slash the 99.9th latency percentile by 4x!
I'm going to focus only on two parts of our edge stack: FL and SSL.
Here’s a diagram:
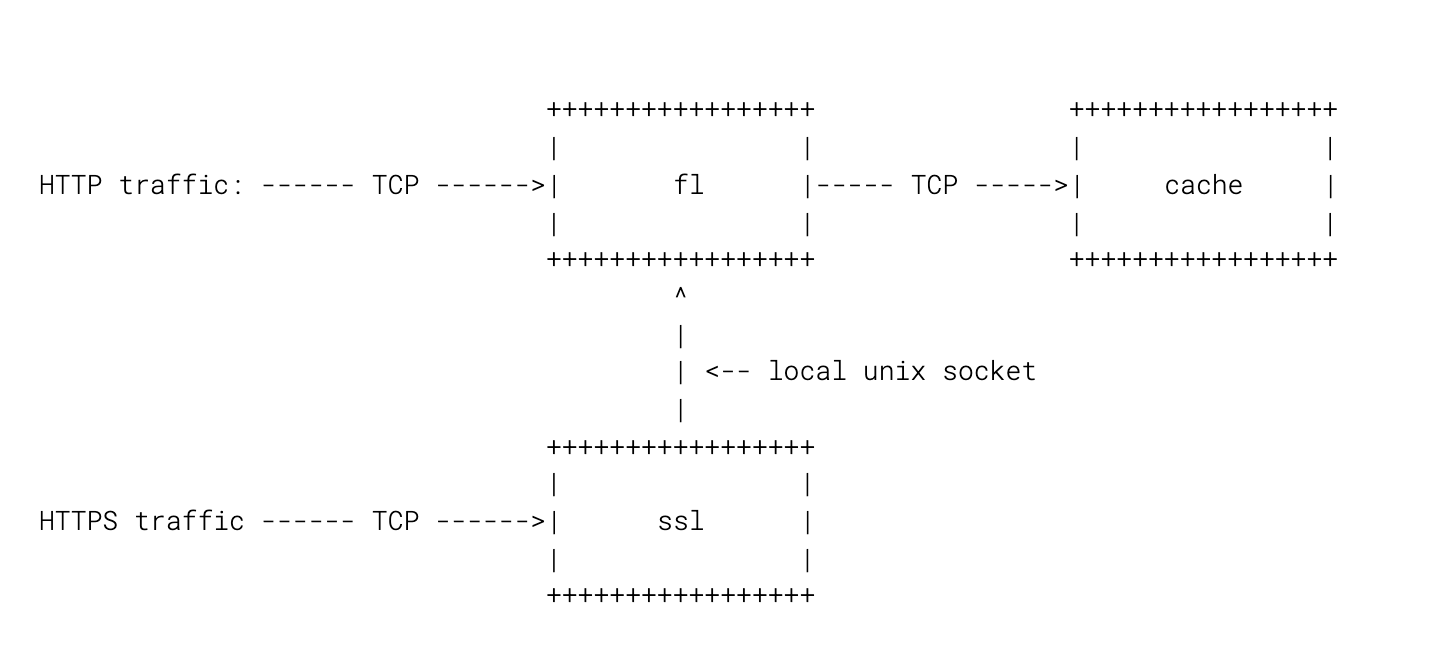
These days we route all traffic through SSL for simplicity, but in the grand scheme of things it’s not going to matter much.
Each of these processes is not itself a single process, but rather a master process and a collection of Continue reading
This is an adapted transcript of a talk I gave at Promcon 2018. You can find slides with additional information on our Prometheus deployment and presenter notes here. There's also a video.
Tip: you can click on the image to see the original large version.

Here at Cloudflare we use Prometheus to collect operational metrics. We run it on hundreds of servers and ingest millions of metrics per second to get insight into our network and provide the best possible service to our customers.
Prometheus metric format is popular enough, it's now being standardized as OpenMetrics under Cloud Native Computing Foundation. It's exciting to see convergence in long fragmented metrics landscape.
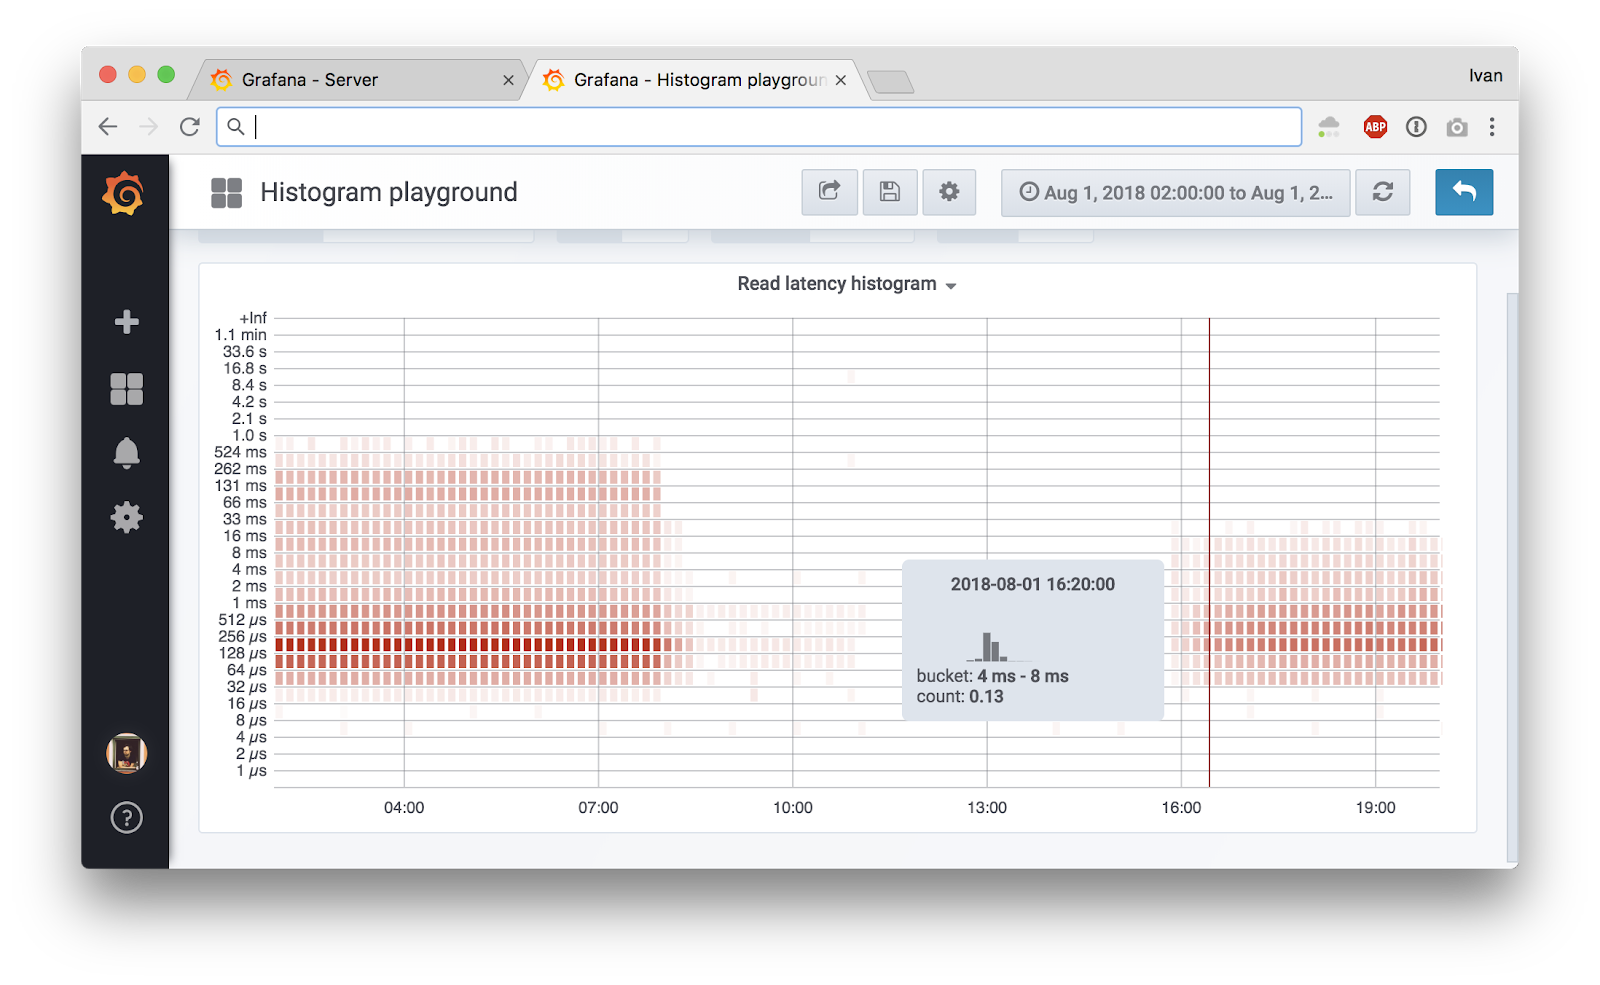
In this blog post we'll talk about how we measure low level metrics and share a tool that can help you to get similar understanding of your systems.
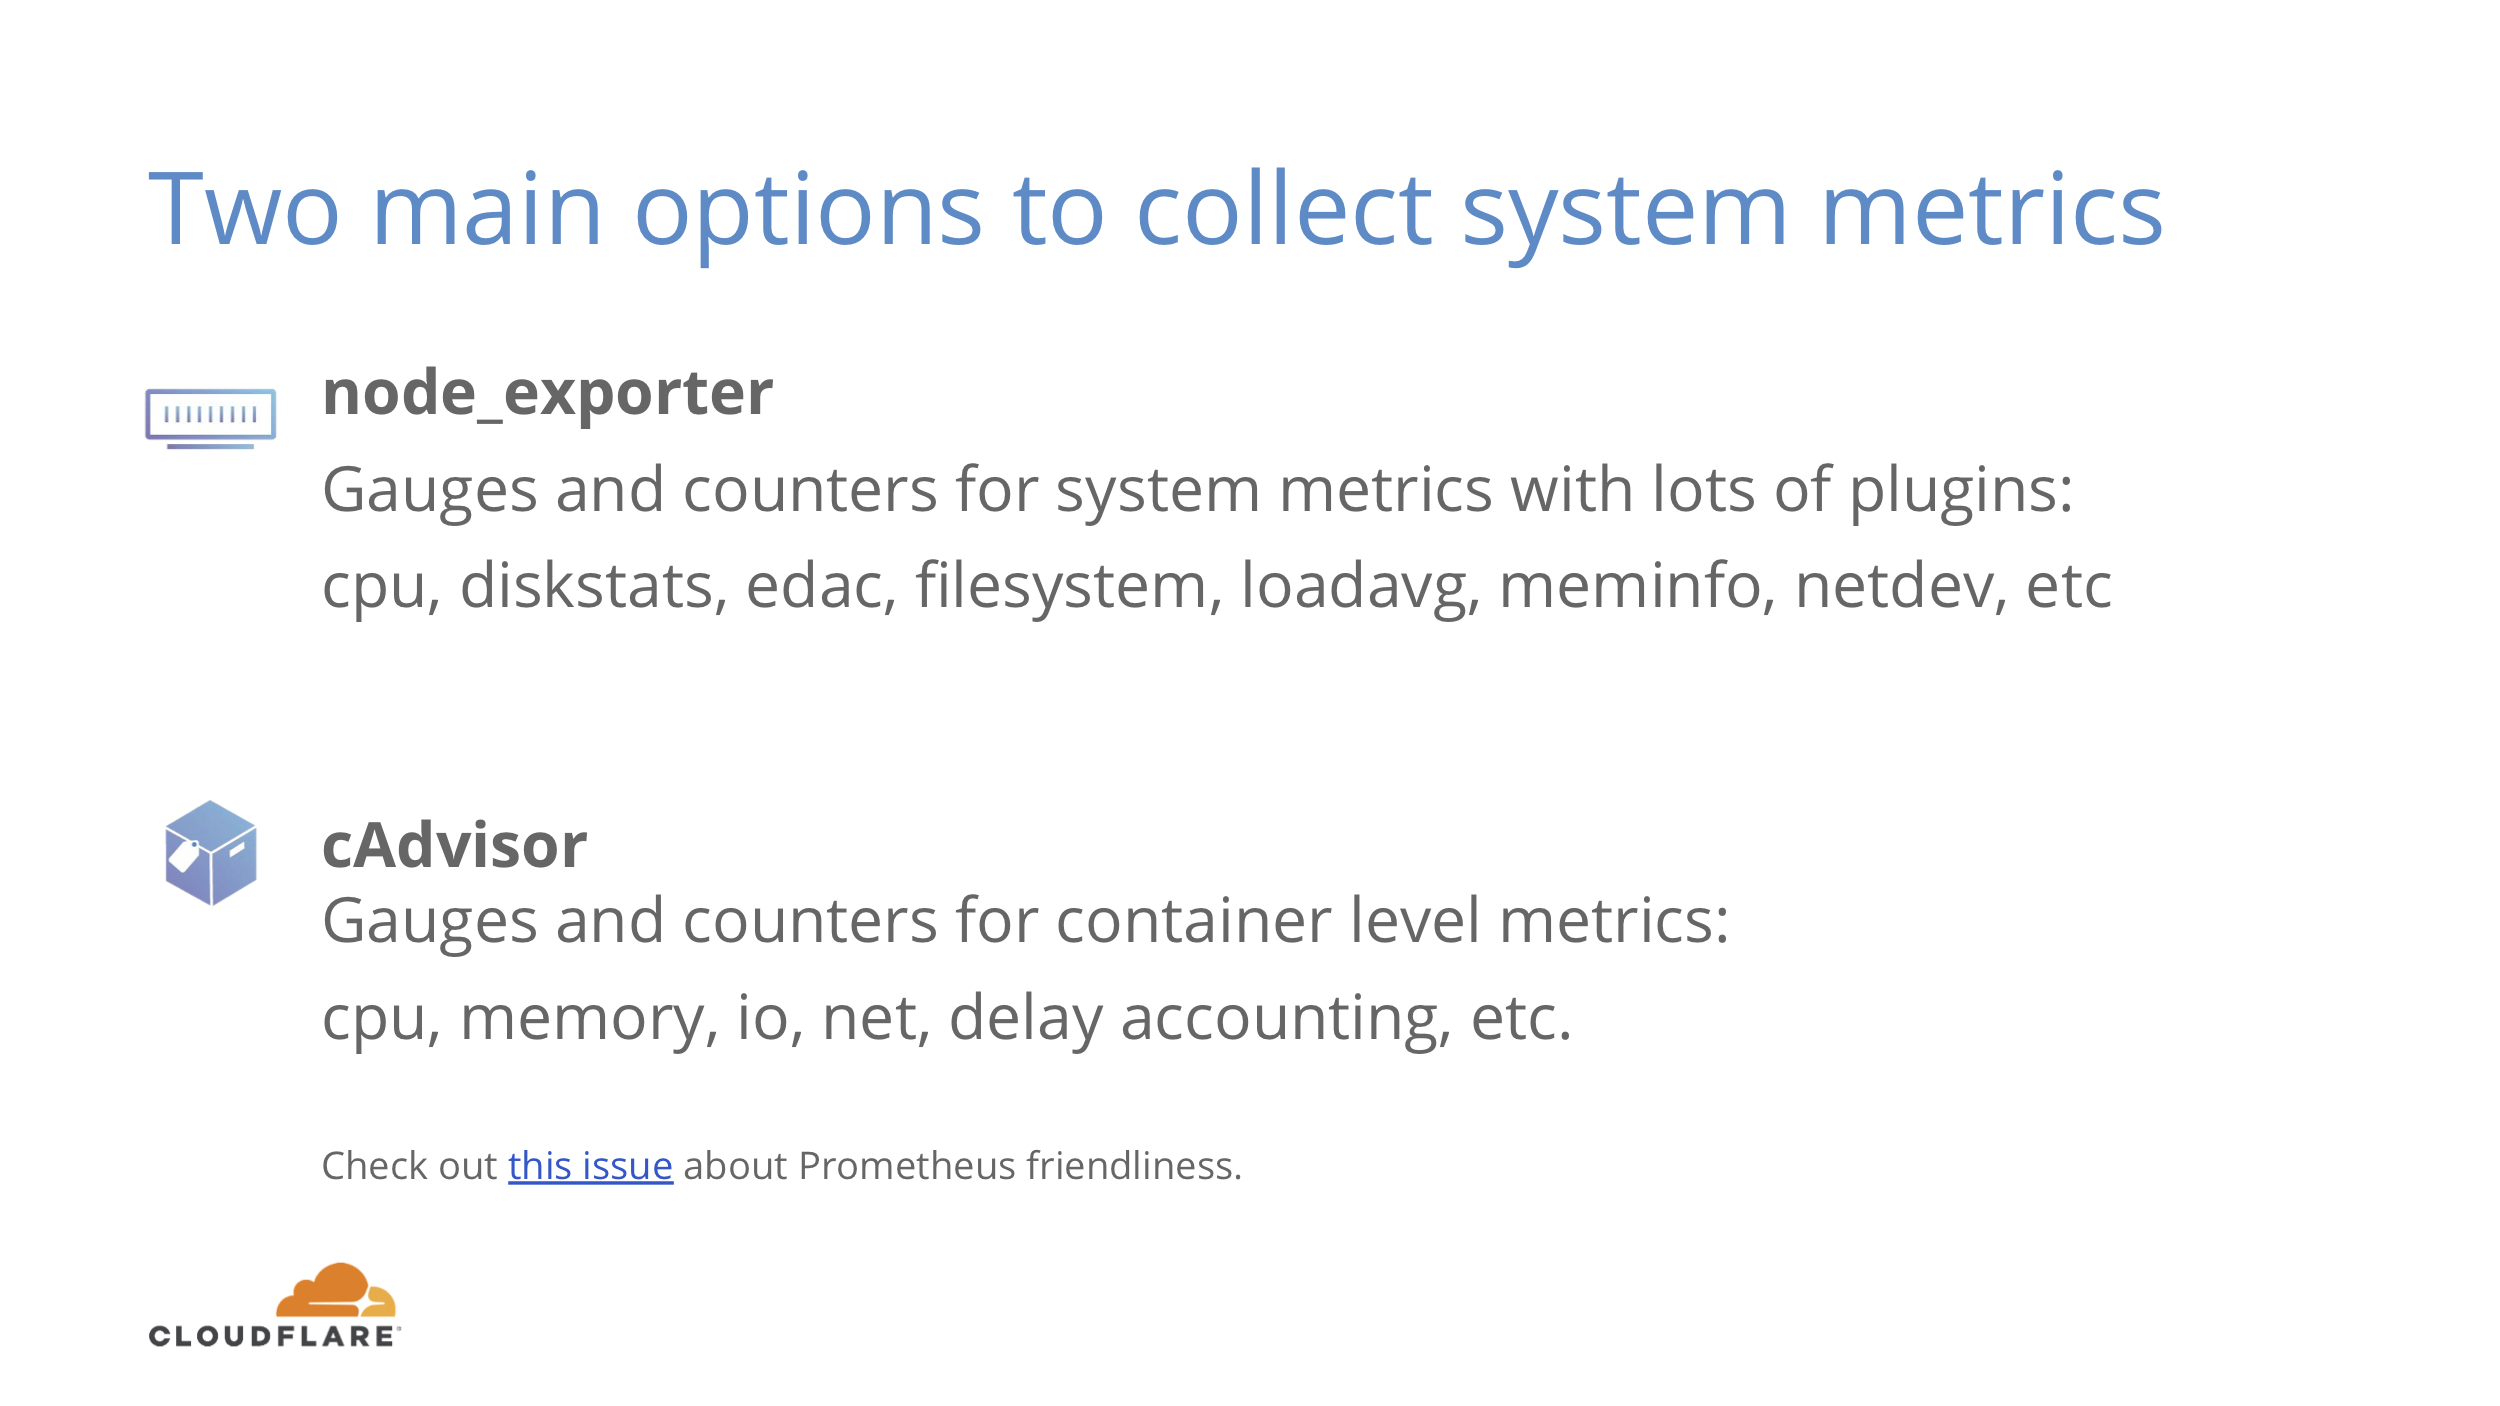
There are two main exporters one can use to get some insight into a Linux system performance.
The first one is node_exporter that gives you information about basics like CPU usage breakdown by type, memory usage, disk IO stats, filesystem and network usage.
The second one is cAdvisor, that gives similar metrics, but drills down to a container level. Instead Continue reading
This is a heavily truncated version of an internal blog post from August 2017. For more recent updates on Kafka, check out another blog post on compression, where we optimized throughput 4.5x for both disks and network.
Photo by Alex Povolyashko / Unsplash
For quite some time we've been rolling out Debian Stretch, to the point where we have reached ~10% adoption in our core datacenters. As part of upgarding the underlying OS, we also evaluate the higher level software stack, e.g. taking a look at our ClickHouse and Kafka clusters.
During our upgrade of Kafka, we sucessfully migrated two smaller clusters, logs and dns, but ran into issues when attempting to upgrade one of our larger clusters, http.
Thankfully, we were able to roll back the http cluster upgrade relatively easily, due to heavy versioning of both the OS and the higher level software stack. If there's one takeaway from this blog post, it's to take advantage of consistent versioning.
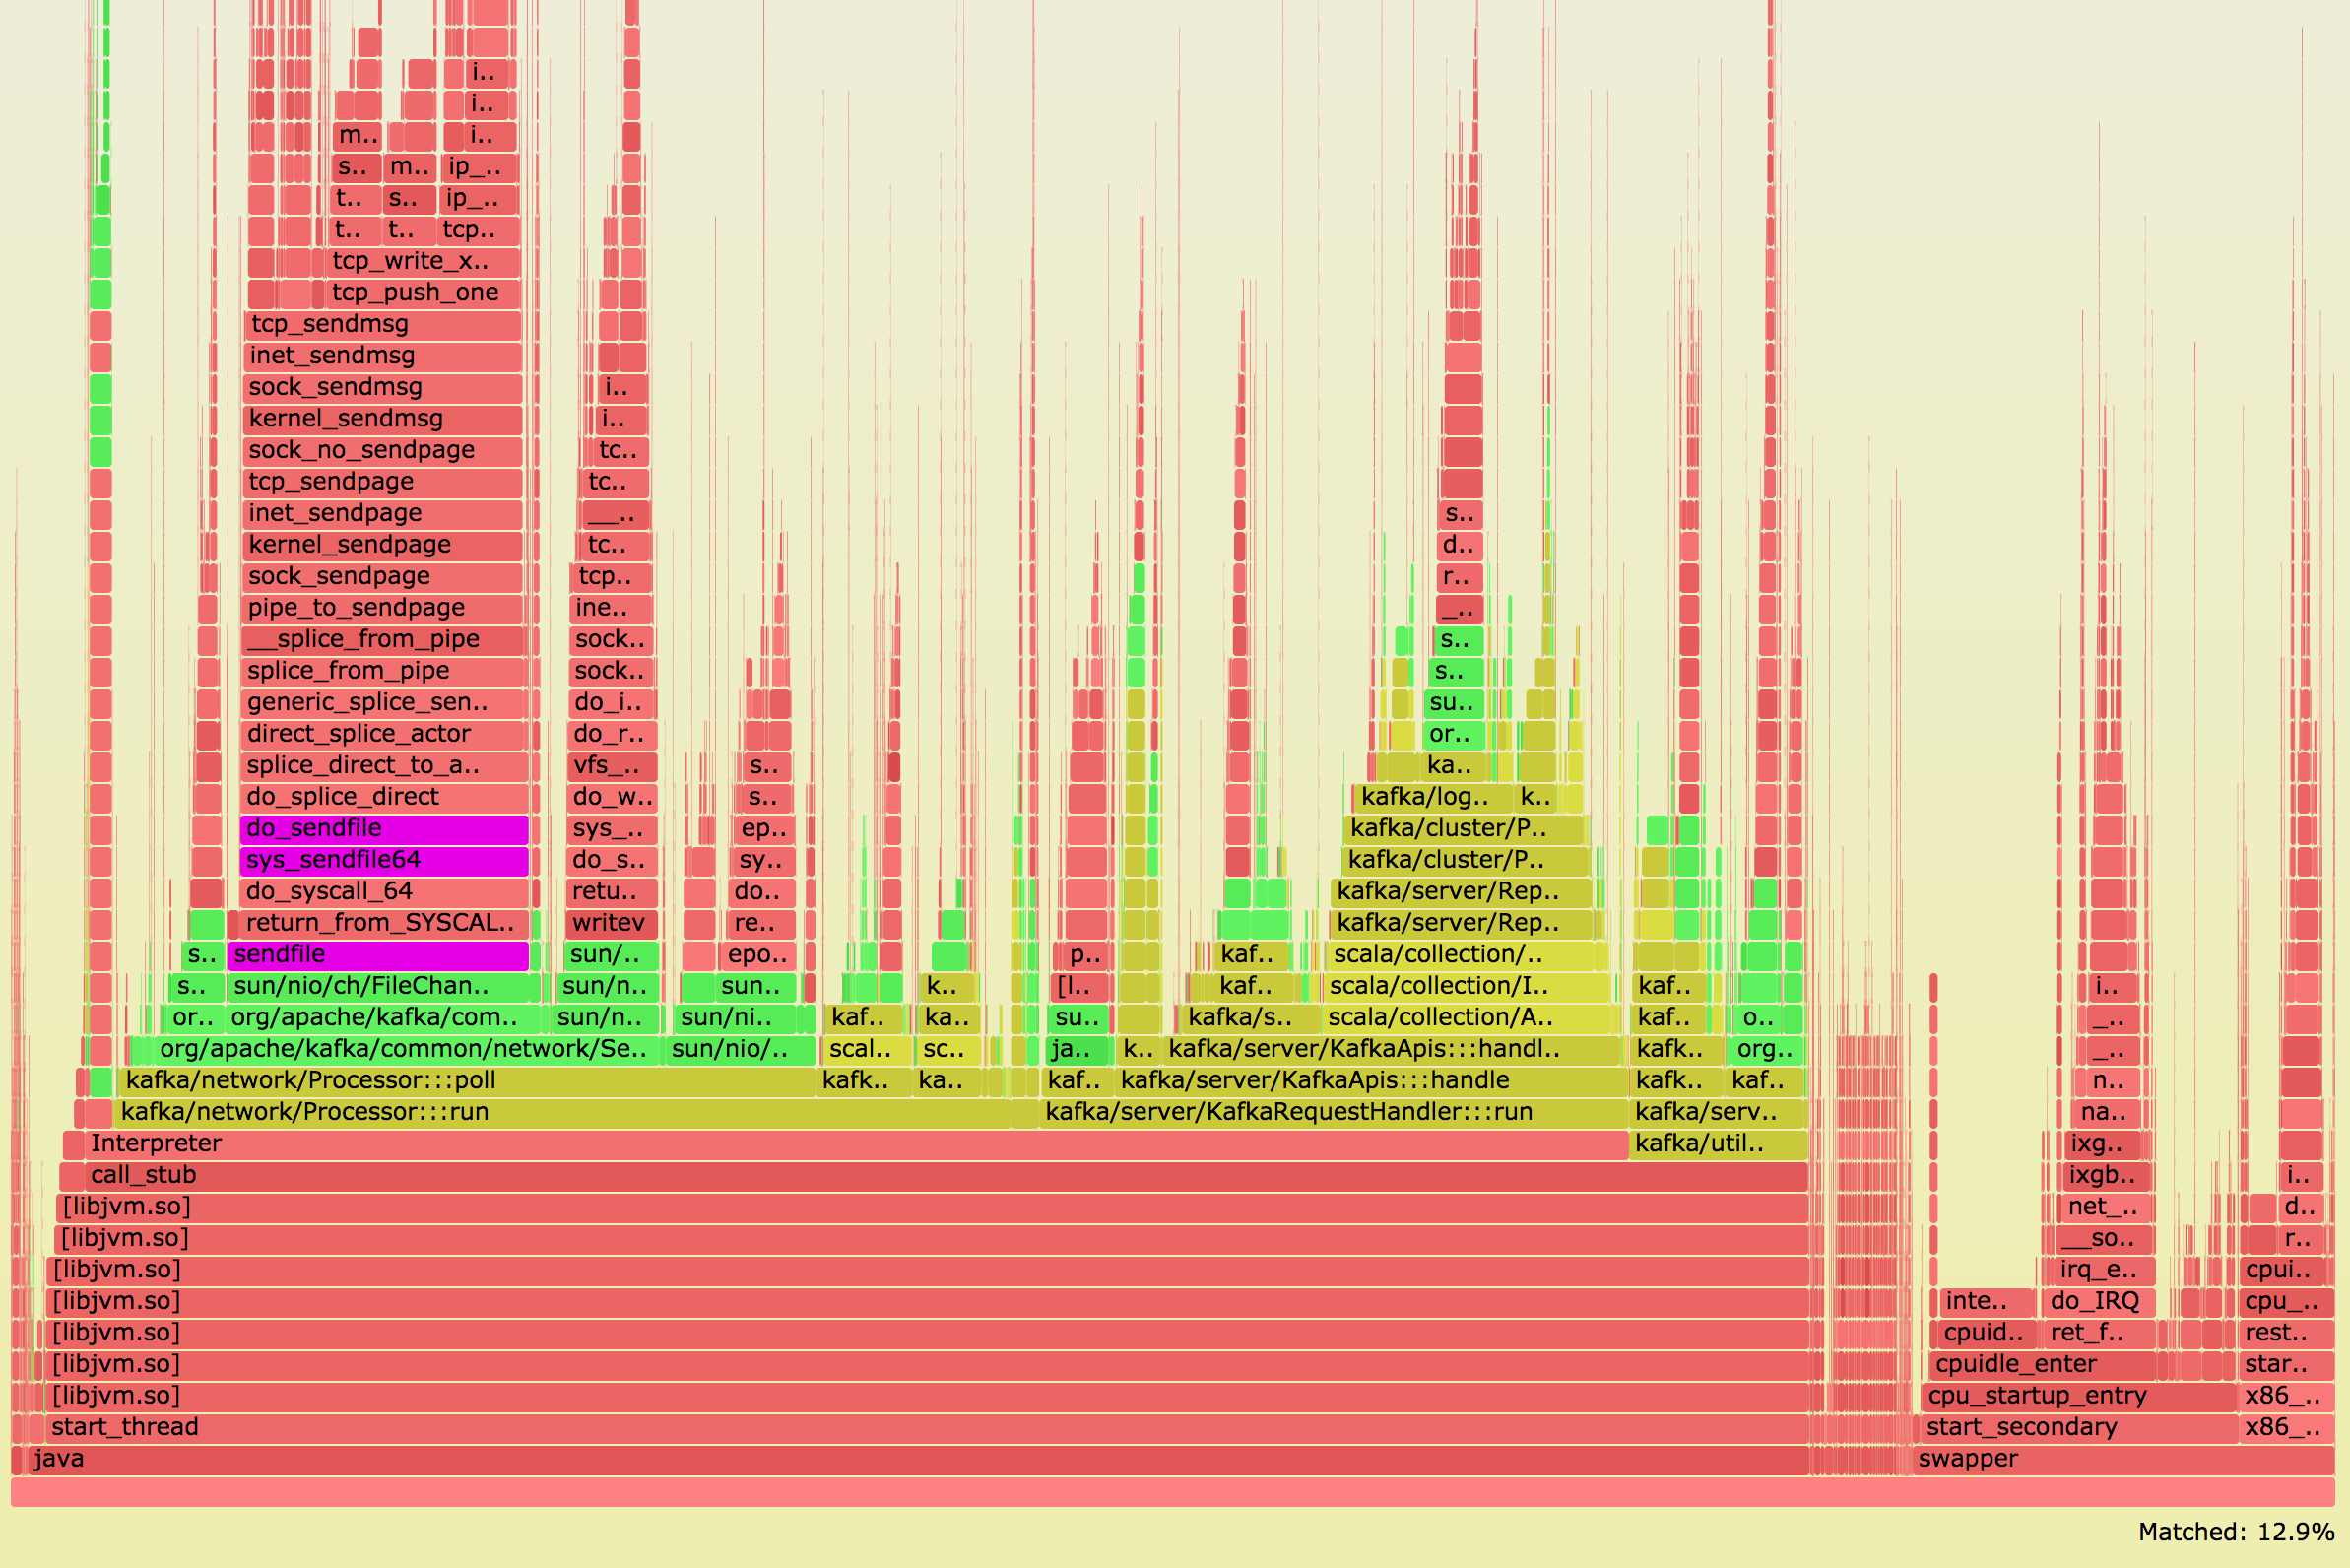
We upgraded one Kafka http node, and it did not go as planned:
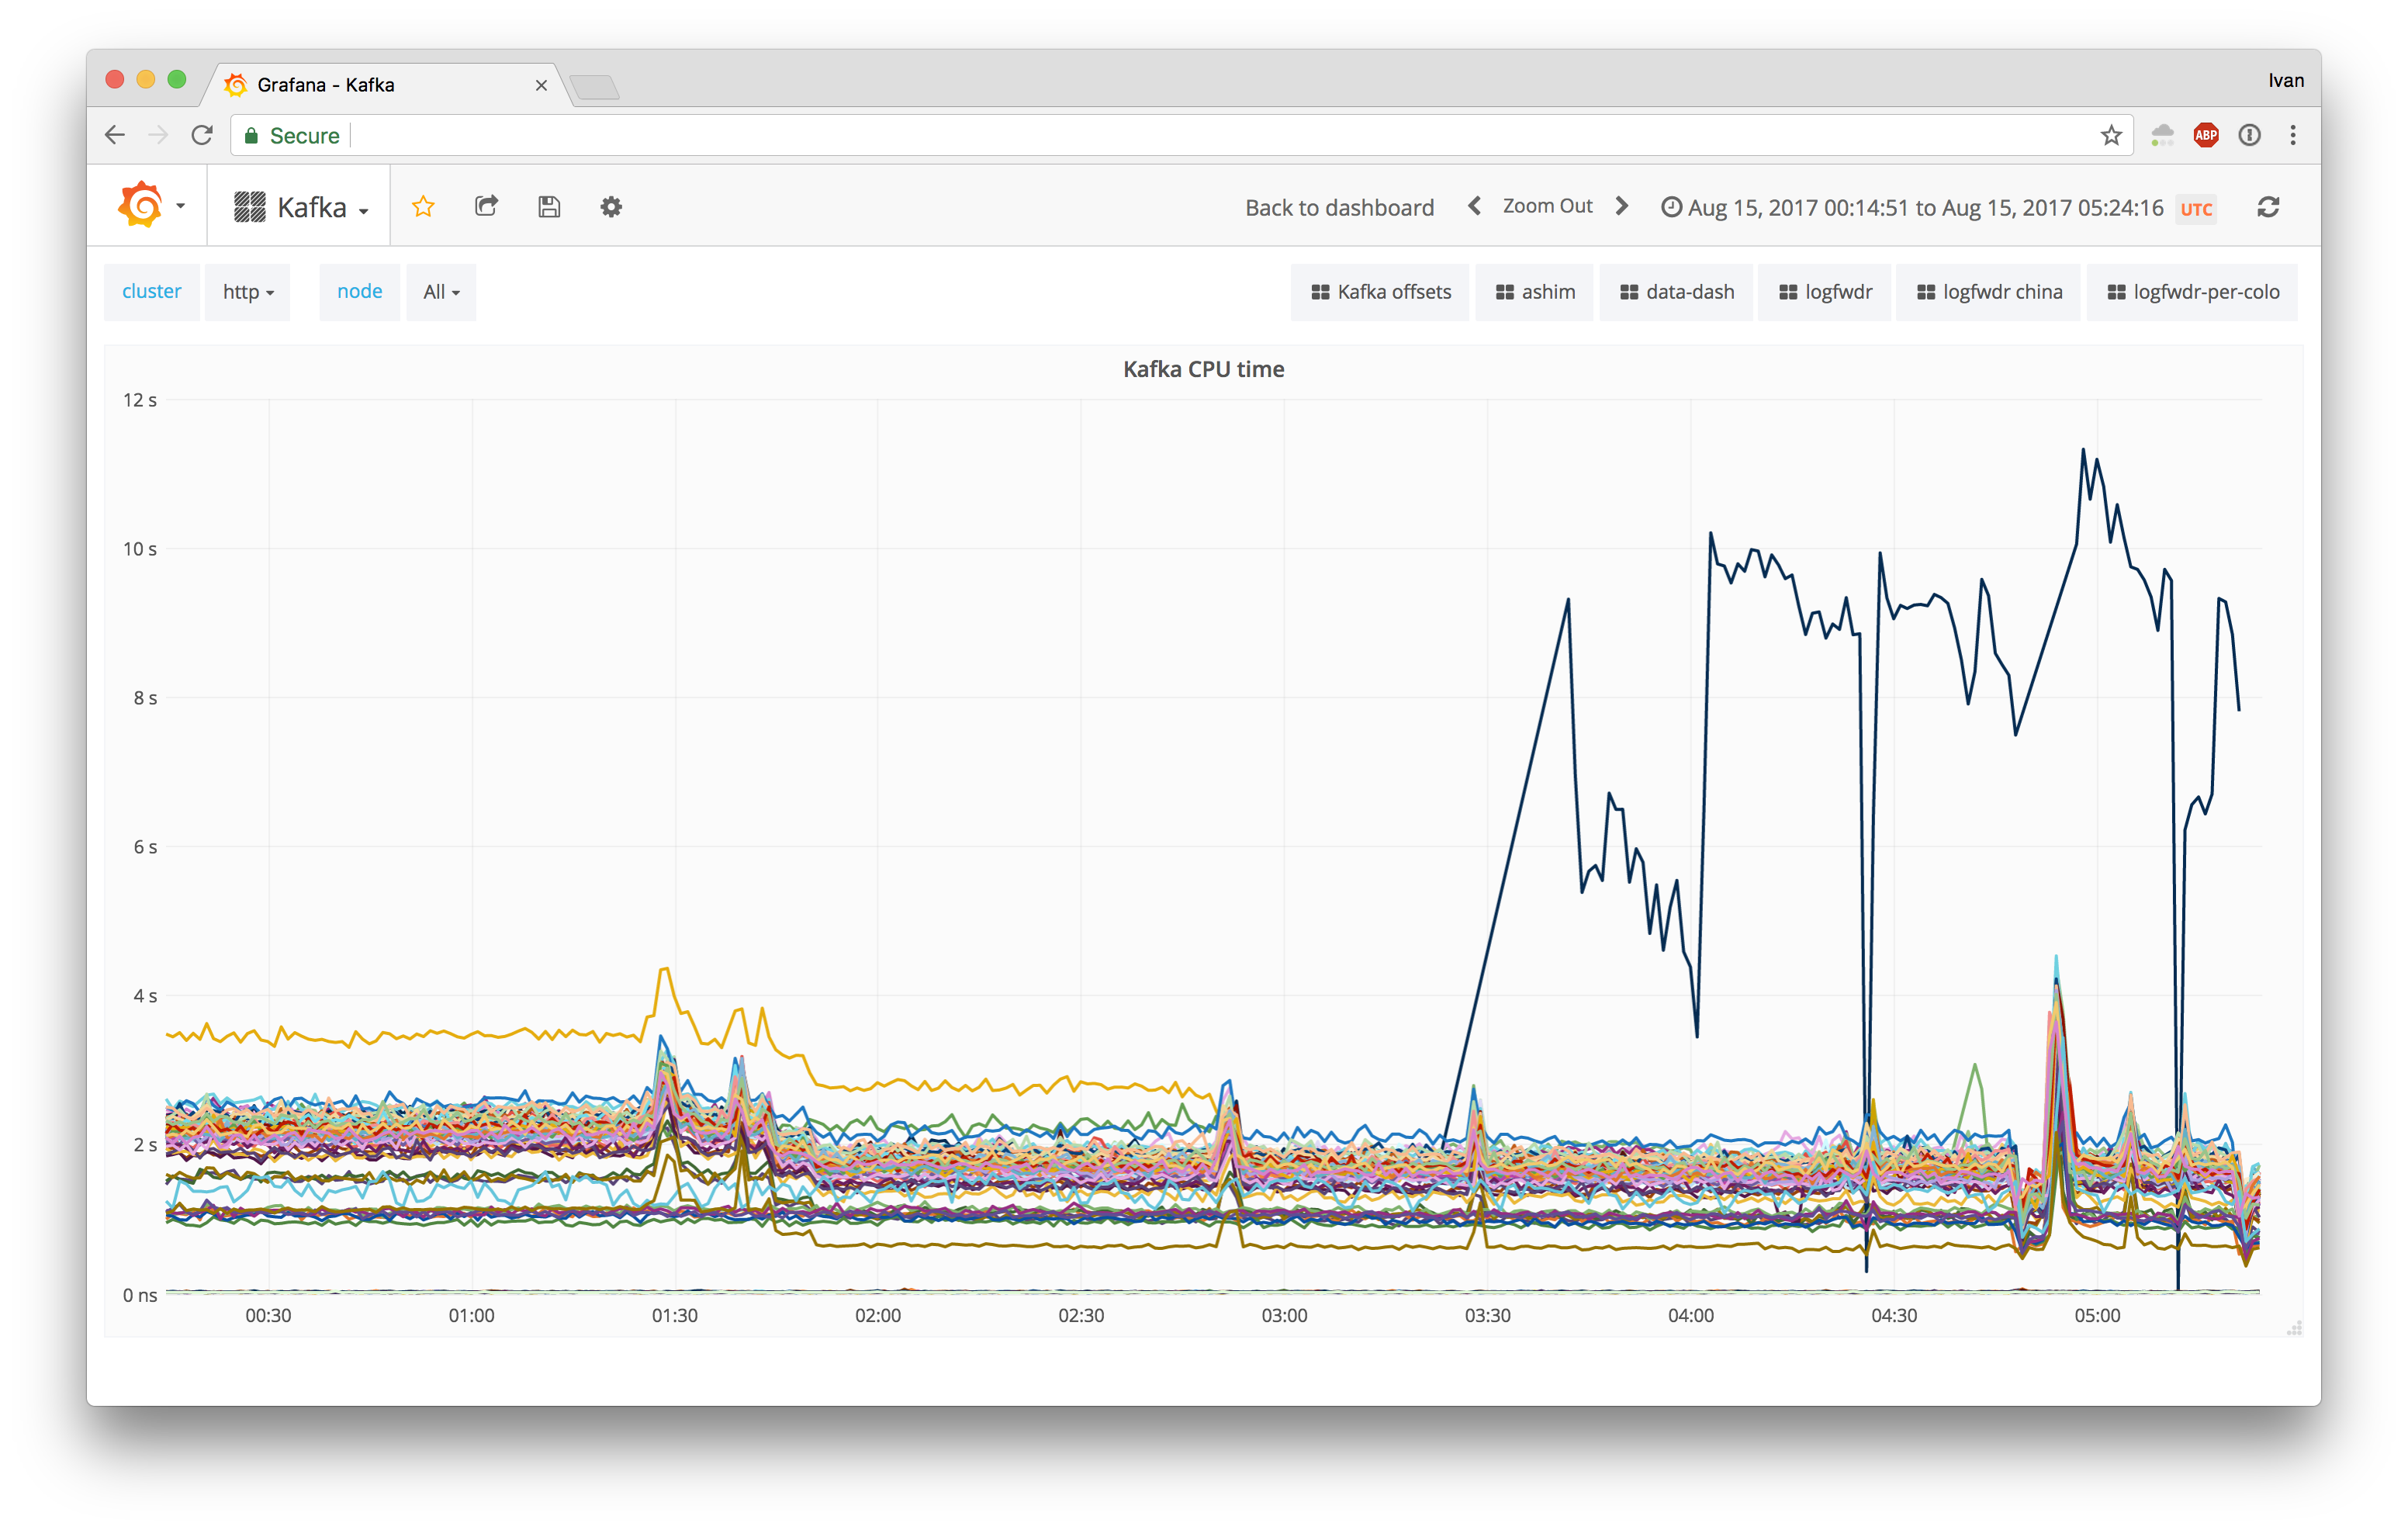
Having 5x CPU usage was definitely an unexpected outcome. For control datapoints, we Continue reading

We at Cloudflare are long time Kafka users, first mentions of it date back to beginning of 2014 when the most recent version was 0.8.0. We use Kafka as a log to power analytics (both HTTP and DNS), DDOS mitigation, logging and metrics.
 Firehose CC BY 2.0 image by RSLab
While the idea of unifying abstraction of the log remained the same since then (read this classic blog post from Jay Kreps if you haven't), Kafka evolved in other areas since then. One of these improved areas was compression support. Back in the old days we've tried enabling it a few times and ultimately gave up on the idea because of unresolved issues in the protocol.
Just last year Kafka 0.11.0 came out with the new improved protocol and log format.
The naive approach to compression would be to compress messages in the log individually:

Edit: originally we said this is how Kafka worked before 0.11.0, but that appears to be false.
Compression algorithms work best if they have more data, so in the new log format messages (now called records) are packed back to back and compressed in Continue reading
We use Salt to manage our ever growing global fleet of machines. Salt is great for managing configurations and being the source of truth. We use it for remote command execution and for network automation tasks. It allows us to grow our infrastructure quickly with minimal human intervention.

CC-BY 2.0 image by Kevin Dooley
We got to thinking. Are DNS records not just a piece of the configuration? We concluded that they are and decided to manage our own records from Salt too.
We are strong believers in eating our own dog food, so we make our employees use the next version of our service before rolling it to everyone else. That way if there's a problem visiting one of the 5 million websites that use Cloudflare it'll get spotted quickly internally. This is also why we keep our own DNS records on Cloudflare itself.
Cloudflare has an API that allows you to manage your zones programmatically without ever logging into the dashboard. Until recently, we were using handcrafted scripts to manage our own DNS records via our API. These scripts were in exotic languages like PHP for historical reasons and had interesting behavior that not everybody enjoyed. Continue reading
The following blog post describes a debugging adventure on Cloudflare's Mesos-based cluster. This internal cluster is primarily used to process log file information so that Cloudflare customers have analytics, and for our systems that detect and respond to attacks.
The problem encountered didn't have any effect on our customers, but did have engineers scratching their heads...
At some point in one of our cluster we started seeing errors like this (an NXDOMAIN for an existing domain on our internal DNS):
lookup some.existing.internal.host on 10.36.0.9:53: no such host
This seemed very weird, since the domain did indeed exist. It was one of our internal domains! Engineers had mentioned that they'd seen this behaviour, so we decided to investigate deeper. Queries triggering this error were varied and ranged from dynamic SRV records managed by mesos-dns to external domains looked up from inside the cluster.
Our first naive attempt was to run the following in a loop:
while true; do dig some.existing.internal.host > /tmp/dig.txt || break; done
Running this for a while on one server did not reproduce the problem: all the lookups were successful. Then we took our service Continue reading