Author Archives: Lukasz Mierzwa
Author Archives: Lukasz Mierzwa


We use Prometheus to gain insight into all the different pieces of hardware and software that make up our global network. Prometheus allows us to measure health & performance over time and, if there’s anything wrong with any service, let our team know before it becomes a problem.
At the moment of writing this post we run 916 Prometheus instances with a total of around 4.9 billion time series. Here’s a screenshot that shows exact numbers:
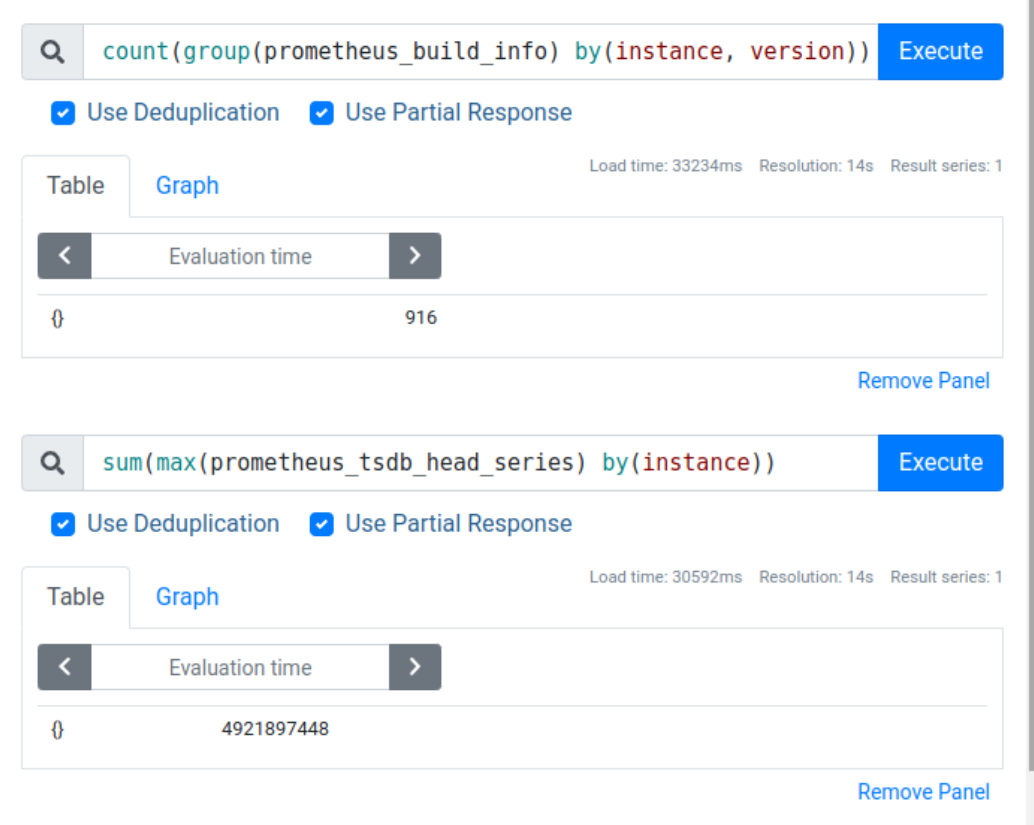
That’s an average of around 5 million time series per instance, but in reality we have a mixture of very tiny and very large instances, with the biggest instances storing around 30 million time series each.
Operating such a large Prometheus deployment doesn’t come without challenges. In this blog post we’ll cover some of the issues one might encounter when trying to collect many millions of time series per Prometheus instance.
One of the first problems you’re likely to hear about when you start running your own Prometheus instances is cardinality, with the most dramatic cases of this problem being referred to as “cardinality explosion”.
So let’s start by looking at what cardinality means from Prometheus' perspective, when it can Continue reading


We use Prometheus as our core monitoring system. We’ve been heavy Prometheus users since 2017 when we migrated off our previous monitoring system which used a customized Nagios setup. Despite growing our infrastructure a lot, adding tons of new products and learning some hard lessons about operating Prometheus at scale, our original architecture of Prometheus (see Monitoring Cloudflare's Planet-Scale Edge Network with Prometheus for an in depth walk through) remains virtually unchanged, proving that Prometheus is a solid foundation for building observability into your services.
One of the key responsibilities of Prometheus is to alert us when something goes wrong and in this blog post we’ll talk about how we make those alerts more reliable - and we’ll introduce an open source tool we’ve developed to help us with that, and share how you can use it too. If you’re not familiar with Prometheus you might want to start by watching this video to better understand the topic we’ll be covering here.
Prometheus works by collecting metrics from our services and storing those metrics inside its database, called TSDB. We can then query these metrics using Prometheus query language called PromQL using ad-hoc queries (for example to power Grafana Continue reading