Broadcom ASIC table utilization metrics, DevOps, and SDN
 |
| Figure 1: Two-Level Folded CLOS Network Topology Example |
Broadcom Trident ASICs are popular in white box, brite-box and branded data center switches from a wide range of vendors, including: Accton, Agema, Alcatel-Lucent, Arista, Cisco, Dell, Edge-Core, Extreme, Hewlett-Packard, IBM, Juniper, Penguin Computing, and Quanta.
 |
| Figure 2: OF-DPA Programming Pipeline for ECMP |
Broadcom's recently released sFlow specification, sFlow Broadcom Switch ASIC Table Utilization Structures, leverages the industry standard sFlow protocol to offer scaleable, multi-vendor, network wide visibility into the utilization of these hardware tables.
Support for Continue reading
Cloud analytics

This article describes a proof of concept demonstrating how Librato's cloud service can be used to cost effectively monitor large scale cloud infrastructure by leveraging standard sFlow instrumentation. Librato offers a free 30 day trial, making it easy to evaluate solutions based on this demonstration.

Over 40 vendors implement the sFlow standard and compatible products are listed on sFlow.org. The open source Host sFlow agent exports standard sFlow metrics from hosts. For additional background, the Velocity conference talk provides an introduction to sFlow and case study from a large social networking site.

Librato's service is priced based on the number of data points that they need to store. For example, a Host sFlow agent Continue reading
Fabric visibility with Arista EOS
A leaf and spine fabric is challenging to monitor. The fabric spreads traffic across all the switches and links in order to maximize bandwidth. Unlike traditional hierarchical network designs, where a small number of links can be monitored to provide visibility, a leaf and spine network has no special links or switches where running CLI commands or attaching a probe would provide visibility. Even if it were possible to attach probes, the effective bandwidth of a leaf and spine network can be as high as a Petabit/second, well beyond the capabilities of current generation monitoring tools.The 2 minute video provides an overview of some of the performance challenges with leaf and spine fabrics and demonstrates Fabric View - a monitoring solution that leverages industry standard sFlow instrumentation in commodity data center switches to provide real-time visibility into fabric performance.
Fabric View is free to try, just register at http://www.myinmon.com/ and request an evaluation. The software requires an accurate network topology in order to characterize performance and this article will describe how to obtain the topology from a fabric of Arista Networks switches.
Arista EOS™ includes the eAPI JSON-RPC service for programmatic monitoring and control. The article Arista Continue reading
Open vSwitch performance monitoring
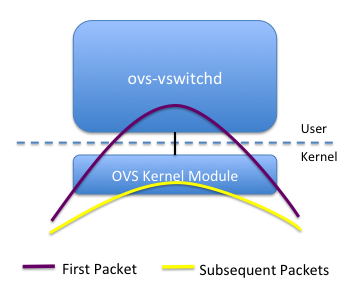 |
| Credit: Accelerating Open vSwitch to “Ludicrous Speed” |
The recent Open vSwitch 2014 Fall Conference included the talk, Managing Open vSwitch across a large heterogeneous fleet by Chad Norgan, describing Rackspace's experience with running a large scale OpenStack deployment using Open vSwitch for network virtualization. The talk describes the key metrics that Rackspace collects to monitor the performance of the large pools of Open vSwitch instances.
Continue reading
OpenFlow integration
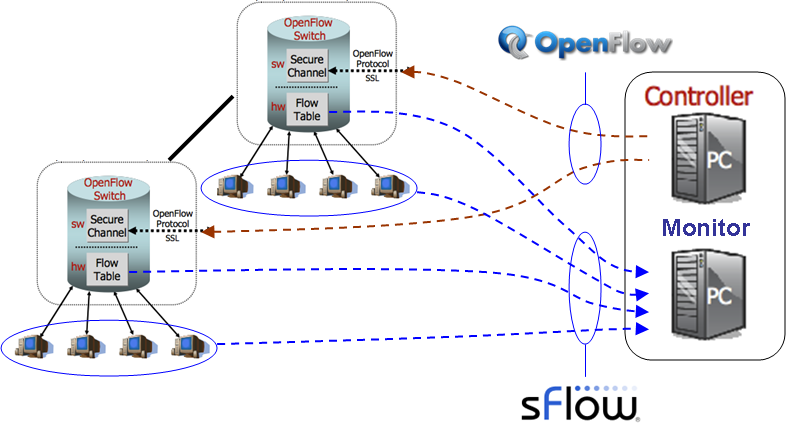
The article describes the challenge of mapping between the different methods used by sFlow and OpenFlow to identify switch ports:
- Agent IP address ⟷ OpenFlow switch ID
- SNMP ifIndex ⟷ OpenFlow port ID
The Open vSwitch recently implemented the extension, unifying visibility and control of the virtual network edge. In addition, most physical that support OpenFlow also support sFlow. Ask vendors about their plans to implement the sFlow OpenFlow Structures extension since it is a key enabler for SDN control applications.
Hybrid OpenFlow ECMP testbed
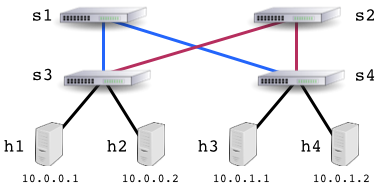
SDN fabric controller for commodity data center switches describes how the real-time visibility and hybrid control capabilities of commodity data center switches can be used to automatically adapt the network to changing traffic patterns and optimize performance. The article identifies hybrid OpenFlow as a critical component of the solution, allowing SDN to be combined with proven distributed routing protocols (e.g. BGP, ISIS, OSPF, etc) to deliver scaleable, production ready solutions that fully leverage the capabilities of commodity hardware.
This article will take the example of large flow marking that has been demonstrated using physical switches and show how Mininet can be used to emulate hybrid control of data center networks and deliver realistic results.


REST API for Cumulus Linux ACLs
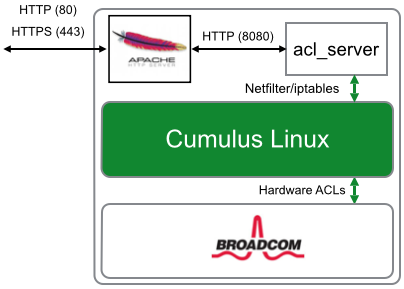
Previous blog posts demonstrated how remote control of Cumulus Linux ACLs can be used for DDoS mitigation and Large "Elephant" flow marking.
A more advanced version of the script is now available on GitHub:
https://github.com/pphaal/acl_server/
The new script adds the following features:
- It now runs as a daemon.
- Exceptions generated by cl-acltool are caught and handled
- Rules are compiled asynchronously, reducing response time of REST calls
- Updates are batched, supporting hundreds of operations per second
Fortunately, Cumulus Linux is a open Linux distribution that allows additional software components to be installed. Rather than being forced to add authentication and encryption to the script, it is possible to install additional software and leverage the capabilities of a mature web server such as Apache. Continue reading
Fabric visibility with Cumulus Linux
A leaf and spine fabric is challenging to monitor. The fabric spreads traffic across all the switches and links in order to maximize bandwidth. Unlike traditional hierarchical network designs, where a small number of links can be monitored to provide visibility, a leaf and spine network has no special links or switches where running CLI commands or attaching a probe would provide visibility. Even if it were possible to attach probes, the effective bandwidth of a leaf and spine network can be as high as a Petabit/second, well beyond the capabilities of current generation monitoring tools.The 2 minute video provides an overview of some of the performance challenges with leaf and spine fabrics and demonstrates Fabric View - a monitoring solution that leverages industry standard sFlow instrumentation in commodity data center switches to provide real-time visibility into fabric performance.
Fabric View is free to try, just register at http://www.myinmon.com/ and request an evaluation. The software requires an accurate network topology in order to characterize performance and this article will describe how to obtain the topology from a Cumulus Networks fabric.
Complex Topology and Wiring Validation in Data Centers describes how Cumulus Networks' prescriptive topology manager (PTM) provides Continue reading
DDoS flood protection
Denial of Service attacks represents a significant impact to on-going operations of many businesses. When most revenue is derived from on-line operation, a DDoS attack can put a company out of business. There are many flavors of DDoS attacks, but the objective is always the same: to saturate a resource, such as a router, switch, firewall or web server, with multiple simultaneous and bogus requests, from many different sources. These attacks generate large volumes of traffic, 100Gbit/s attacks are now common, making mitigation a challenge.
The 3 minute video demonstrates Flood Protect - a DDoS mitigation solution that leverages industry standard sFlow instrumentation in commodity data center switches to provide real-time detection and mitigation of DDoS attacks. Flood Protect is an application running on InMon's Switch Fabric Accelerator SDN controller. Other applications provide visibility and accelerate fabric performance applying controls reduce latency and increase throughput.
An early version of Flood Protect won the 2014 SDN Idol competition in a joint demonstration with Brocade Networks.Visit sFlow.com to learn more, evaluate pre-release versions of these products, or discuss requirements.
Stop thief!

steal (since Linux 2.6.11)Keeping close track of the stolen time metric is particularly import when running managing virtual machines in a public cloud. For example, Netflix and Stolen Time includes the discussion:
(8) Stolen time, which is the time spent in other operating systems
when running in a virtualized environment
So how does Netflix handle this problem when using Amazon’s Cloud? Adrian admits that they tracked this statistic so closely that when an instance crossed a stolen time threshold the standard operating procedure at Netflix was to kill the VM and start it up on a different hypervisor. What Netflix realized over time was that once a VM was performing poorly because another VM was crashing the party, usually due to a poorly written or compute intensive application hogging the machine, it never really got any better and their best learned approach was to get off that machine.The following articles describe how to monitor public cloud instances using Host sFlow agents:
The CPU steal metric is particularly relevant to Network Function Virtualization (NFV). Virtual Continue reading
InfluxDB and Grafana

The diagram shows the measurement pipeline. Standard sFlow measurements from hosts, hypervisors, virtual machines, containers, load balancers, web servers and network switches stream to the sFlow-RT real-time analytics engine. Over 40 vendors implement the sFlow standard and compatible products are listed on sFlow.org. The open source Host sFlow agent exports standard sFlow metrics from hosts. For additional background, the Velocity conference talk provides an introduction to sFlow and case study from a large social networking site.
It is possible to simply convert the raw sFlow metrics into InfluxDB metrics. The sflow2graphite.pl script provides an example that can be modified to support InfluxDB's native format, or used unmodified with the InfluxDB Graphite input plugin. However, there are scaleability advantages to placing the sFlow-RT analytics engine in front of the time series database. For example, in large scale cloud environments the metrics for each member of a dynamic pool isn't necessarily worth trending since virtual machines are frequently added and removed. Instead, sFlow-RT tracks all the Continue reading
Monitoring leaf and spine fabric performance
A leaf and spine fabric is challenging to monitor. The fabric spreads traffic across all the switches and links in order to maximize bandwidth. Unlike traditional hierarchical network designs, where a small number of links can be monitored to provide visibility, a leaf and spine network has no special links or switches where running CLI commands or attaching a probe would provide visibility. Even if it were possible to attach probes, the effective bandwidth of a leaf and spine network can be as high as a Petabit/second, well beyond the capabilities of current generation monitoring tools.
The 2 minute video provides an overview of some of the performance challenges with leaf and spine fabrics and demonstrates Fabric View - a monitoring solution that leverages industry standard sFlow instrumentation in commodity data center switches to provide real-time visibility into fabric performance. Fabric View is an application running on InMon's Switch Fabric Accelerator SDN controller. Other applications can automatically respond to problems and apply controls to protect against DDoS attacks, reduce latency and increase throughput.
Visit sFlow.com to learn more, evaluate pre-release versions of these products, or discuss requirements.
Open vSwitch 2014 Fall Conference
Open vSwitch is an open source software virtual switch that is popular in cloud environments such as OpenStack. Open vSwitch is a standard Linux component that forms the basis of a number of commercial and open source solutions for network virtualization, tenant isolation, and network function virtualization (NFV) - implementing distributed virtual firewalls and routers.
The recent Open vSwitch 2014 Fall Conference agenda included a wide variety speakers addressing a range of topics, including: large scale operation experiences at Rackspace, implementing stateful firewalls, Docker networking, and acceleration technologies (Intel DPDK and Netmap/VALE).
The video above is a recording of the following sFlow related talk from the conference:
Traffic visibility and control with sFlow (Peter Phaal, InMon)
sFlow instrumentation has been included in Open vSwitch since version 0.99.1 (released 25 Jan 2010). This talk will introduce the sFlow architecture and discuss how it differs from NetFlow/IPFIX, particularly in regards to delivering real-time flow analytics to an SDN controller. The talk will demonstrate that sFlow measurements from Open vSwitch are identical to sFlow measurements made in hardware on bare metal switches, providing unified, end-to-end, measurement across physical and virtual networks. Finally, Open vSwitch / Mininet will be used to demonstrate Continue reading
SDN fabric controllers
 |
| Credit: sFlow.com |
Despite differences, the advantages of a software based network edge are compelling and there is emerging consensus behind this architecture with a large number of solutions available, including: Hadoop, Mesos, OpenStack, VMware NSX, Juniper OpenContrail, Midokura Midonet, Nuage Networks Virtual Services Platform, CPLANE Dynamic Virtual Networks and PLUMgrid Open Networking Suite.
In addition, the move to a software based network edge is leading to the adoption of configuration management and deployment tools from the DevOps Continue reading
Super NORMAL
 |
| KennyK/Shutterstock |
HP's slide presentation from the design forum, OpenFlow-hybrid Mode, gives an overview of hybrid mode OpenFlow and its benefits. The advantage of hybrid mode in leveraging the proven scaleability and operational robustness of existing distributed control mechanisms and complementing them with centralized SDN control is compelling and a number of vendors have released support, including: Alcatel Lucent Enterprise, Brocade, Extreme, Hewlett-Packard, Mellanox, and Pica8. HP's presentation goes on to propose enhancements to the OpenDaylight controller to support hybrid OpenFlow agents.
InMon recently built a hybrid OpenFlow controller and, based on our experiences, this article will discuss how integrated hybrid mode is currently implemented on the switches, examine operational issues, and propose an agent profile for hybrid OpenFlow designed to reduce operational complexity, particularly when addressing traffic engineering use cases such as DDoS mitigation, large flow marking and large flow steering on ECMP/LAG networks.
Mechanisms for Optimizing LAG/ECMP Component Link Utilization in Networks is an IETF Continue reading
SDN control of hybrid packet / optical leaf and spine network

The short video above shows how the Calient optical circuit switch (OCS) uses two grids of micro-mirrors to create optical paths. The optical switching technology has a number of interesting properties:
- Pure optical cut-through, the speed of the link is limited only by the top of rack transceiver speeds (i.e. scales to 100G, 400G and beyond without having to upgrade the OCS)
- Ultra low latency - less than 50ns
- Lower cost than an equivalent packet switch
- Ultra low power (50W vs. 6KW for comparable packet switch)
The diagram shows the hybrid network that was demonstrated. The top of rack switches are bare metal switches running Cumulus Linux. The spine layer consists of a Cumulus Linux bare metal switch and a Calient Technologies optical circuit switch. The bare metal Continue reading
HP proposes hybrid OpenFlow discussion at Open Daylight design forum

Topics for ODL Design Summit from HP contains the following proposal, making the case for integrated hybrid OpenFlow:
We would like to share our experiences with Customer SDN deployments that require OpenFlow hybrid mode. Why it matters, implementation considerations, and how to achieve better support for it in ODL
OpenFlow-compliant switches come in two types: OpenFlow-only, and OpenFlow-hybrid. OpenFlow-only switches support only OpenFlow operation, in those switches all packets are processed by the OpenFlow pipeline, and cannot be processed otherwise. OpenFlow-hybrid switches support both OpenFlow operation and normal Ethernet switching operation, i.e. traditional L2 Ethernet switching, VLAN isolation, L3 routing (IPv4 routing, IPv6 routing...), ACL and QoS processing
The rationale for supporting hybrid mode is twofold:
- Controlled switches have decades of embedded traditional networking logic. The controller does not add value to a solution if it replicates traditional forwarding logic. One alternative controller responsibility is that provides forwarding decisions when it wants to override the traditional data-plane forwarding decision.
- Controllers can be gradually incorporated into a traditional network. Continue reading
New Feature in Cumulus Linux 2.2: sFlow
sFlow is an open protocol, newly supported in Cumulus Linux 2.2, that enables a collector to determine what is going on in a complex network.
It is used to collect statistics, such as packet counts, error counts, CPU usage, etc from a large number of individual switches. What is especially interesting is that it can be used to collect sampled packets (usually only the first n bytes, containing the header), along with some metadata about those packets.
Bringing sFlow to Cumulus Linux was particuarly easy, because “hsflowd” was already available for implementing sFlow support on Linux servers. We were able to reuse that existing code, with extremely minimal modification, to implement sFlow on our Linux based switches.
sFlow allows a collector to get a statistical view of what is going on in a collection of switches, approaching per-flow granularity. This is extremely useful information to present to users for capacity planning and debugging purposes, but things really get interesting when the collector can make decisions based on the information.
For example, our friends at inMon implemented detection of elephant flows (high bandwidth), followed by marking those flows on the switch at network ingress for special QoS handling. This nearly Continue reading
DDoS mitigation with Cumulus Linux
 |
| Figure 1: Real-time SDN Analytics for DDoS mitigation |
This article builds on the test setup described in RESTful control of Cumulus Linux ACLs in order to implement the ONS 2014 SDN Idol winning distributed denial of service (DDoS) mitigation solution - Real-time SDN Analytics for DDoS mitigation.
The following sFlow-RT application implements basic DDoS mitigation functionality:
include('extras/json2.js');

// Define large flow as greater than 100Mbits/sec for 1 second or longer
var bytes_per_second = 100000000/8;
var duration_seconds = 1;

var id = 0;
var controls = {};

setFlow('udp_target',
 {keys:'ipdestination,udpsourceport', value:'bytes',
  filter:'direction=egress', t:duration_seconds}
);

setThreshold('attack',
 {metric:'udp_target', value:bytes_per_second, byFlow:true, timeout:4,
  filter:{ifspeed:[1000000000]}}
);

setEventHandler(function(evt) {
 if(controls[evt.flowKey]) return;

 var rulename = 'ddos' + id++;
 var keys = evt.flowKey.split(',');
 var acl = [
'[iptables]',
'# block UDP reflection attack',
'-A FORWARD --in-interface swp+ -d ' + keys[0]
+ ' -p udp --sport ' + keys[1] + ' -j DROP'
 ];
 http('http://'+evt.agent+':8080/acl/'+rulename,
      'put','application/json',JSON.stringify(acl));
 controls[evt.flowKey] = {
   agent:evt.agent,
   dataSource:evt.dataSource,
   rulename:rulename,
    Continue reading
Docker performance monitoring
 |
| Visibility and the software defined data center |
The talk provides additional background on the sFlow standard and case studies. The remainder of this article describes how to use Host sFlow to monitor a Docker server pool.
First, download, compile and install the Host sFlow agent on a Docker host (Note: The agent needs to Continue reading