Four public live production flow analytics dashboards
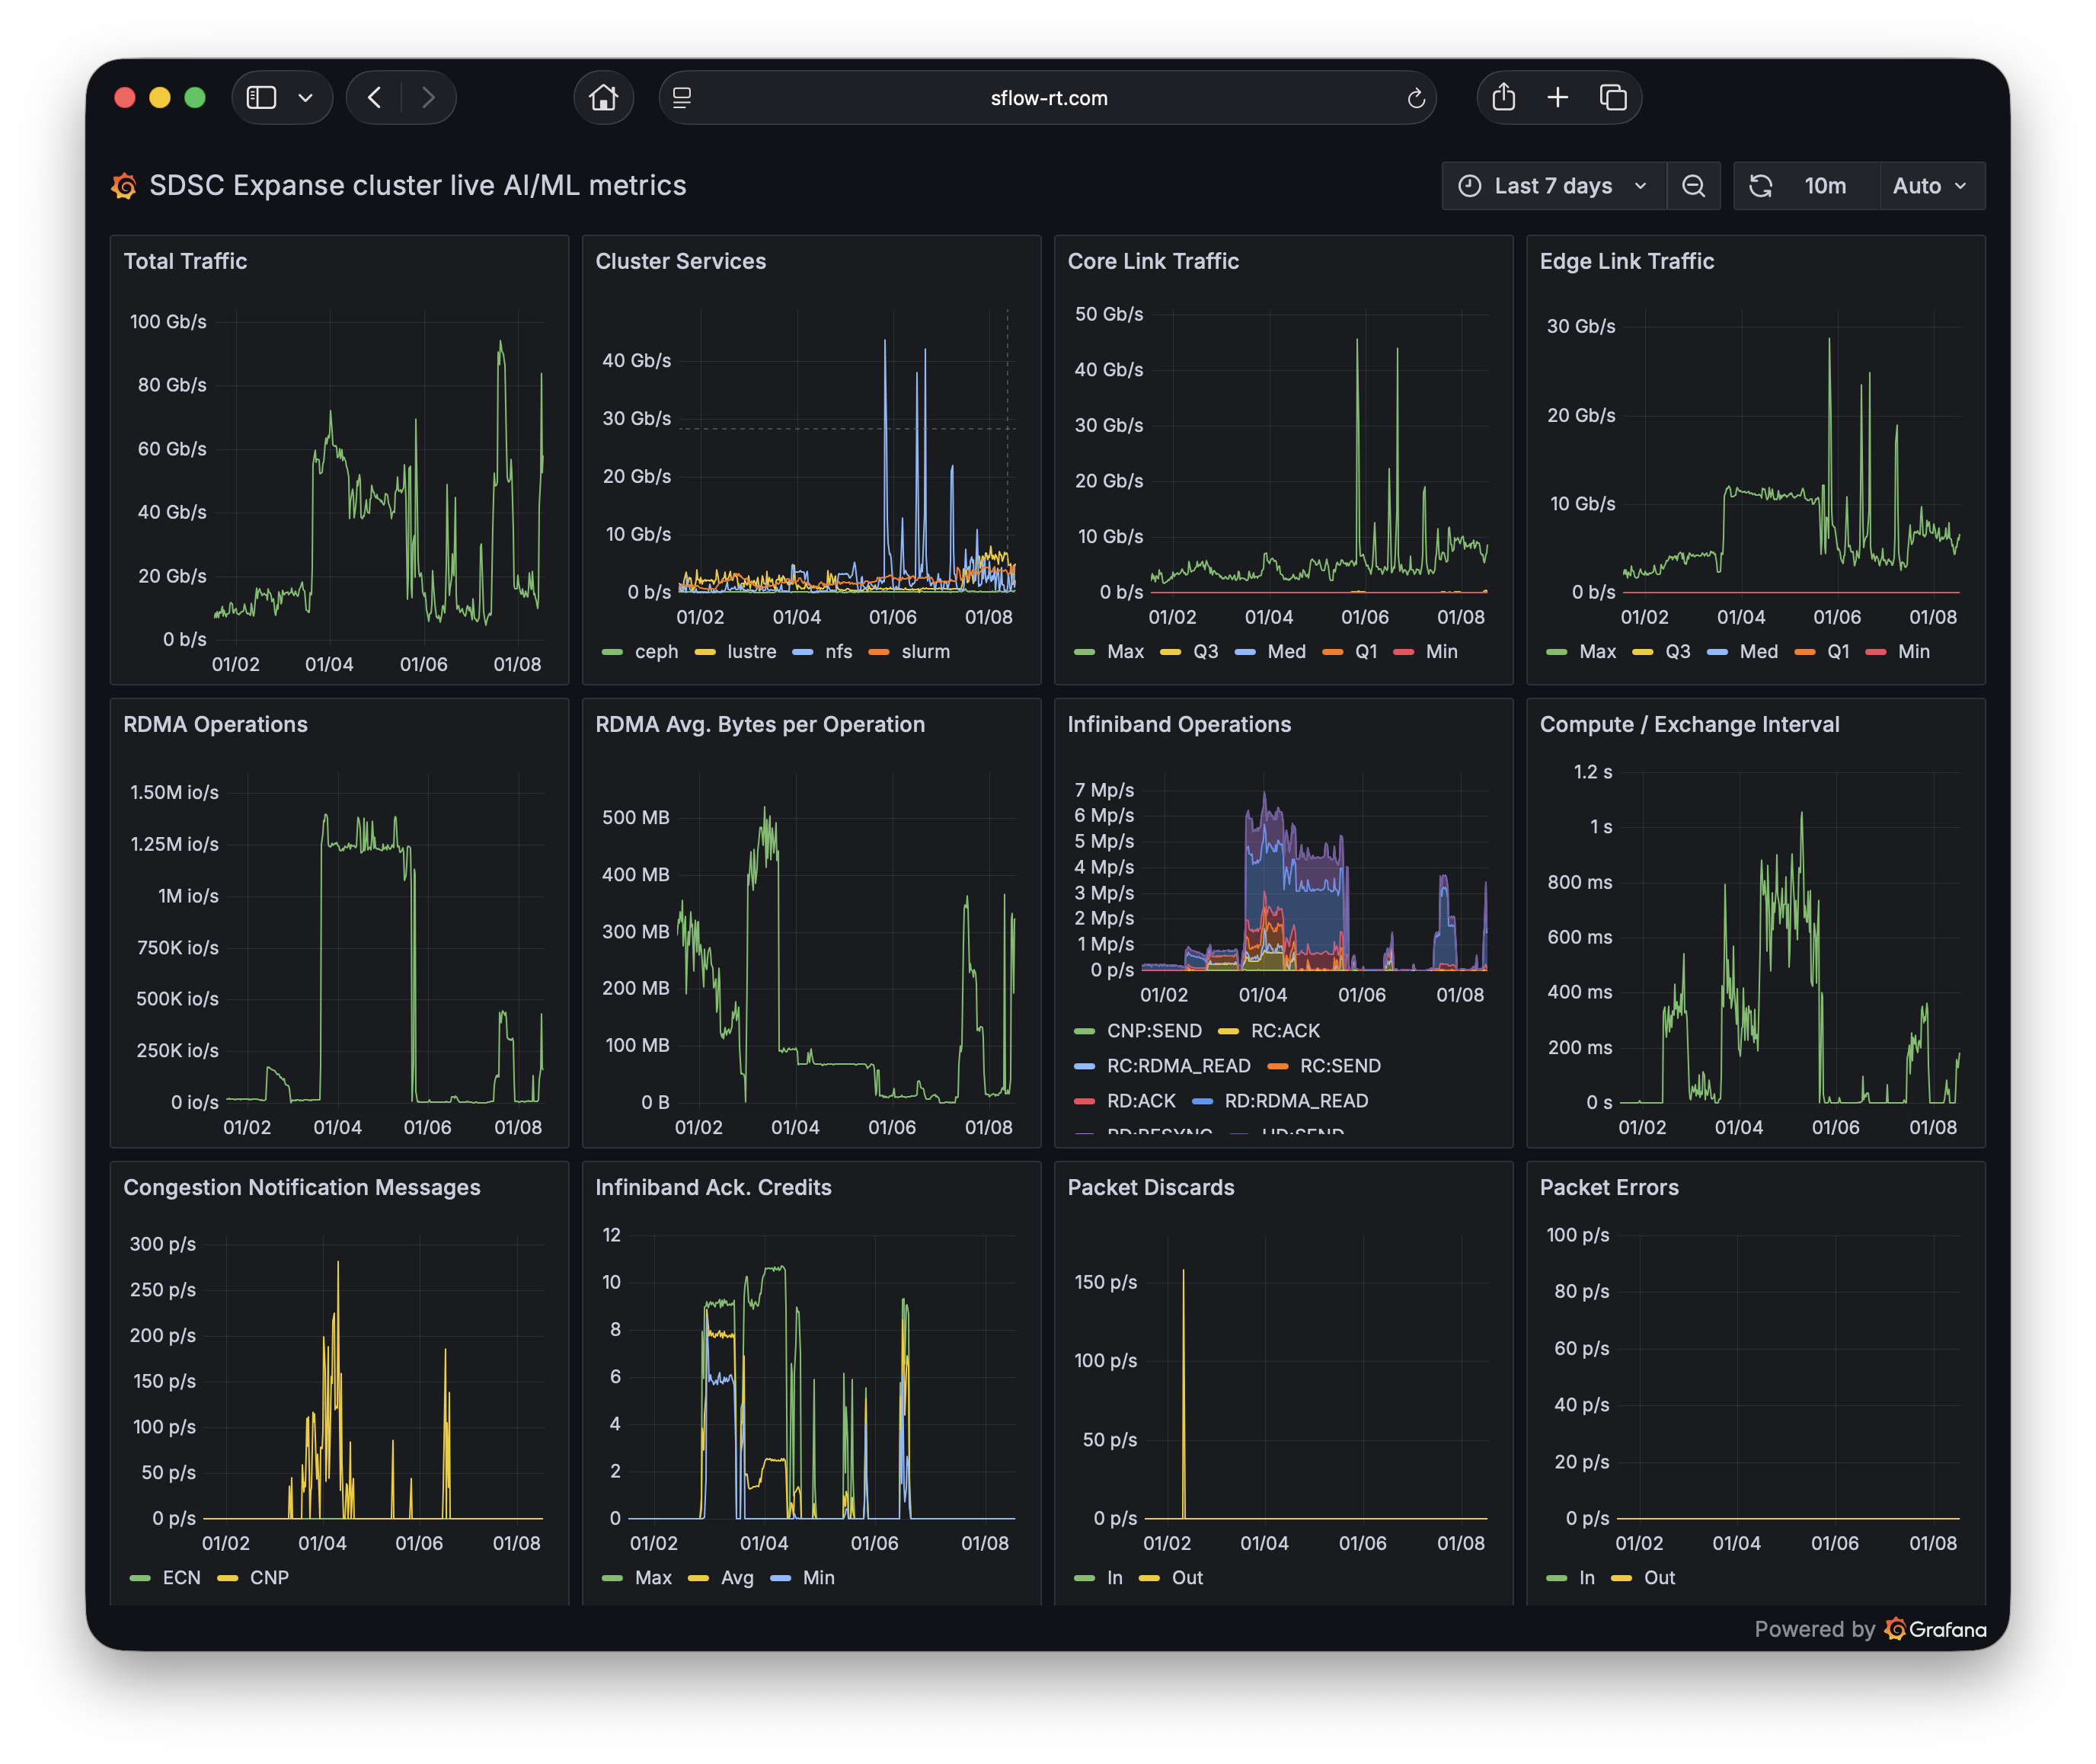
The following publicly accessible dashboards show live data from operational networks, including: an AI/ML RoCEv2 fabric, a world-wide Kubernetes cluster, and an Internet Exchange Provider (IXP). Click on the [ LIVE DASHBOARD ] link under each screen capture to access the live dashboard.San Diego Supercomputer Center Expanse Cluster AI/ML dashboard using ai-metrics application. See AI Metrics with Prometheus and Grafana for detailed, step-by-step, instructions for setting up monitoring and dashboard.
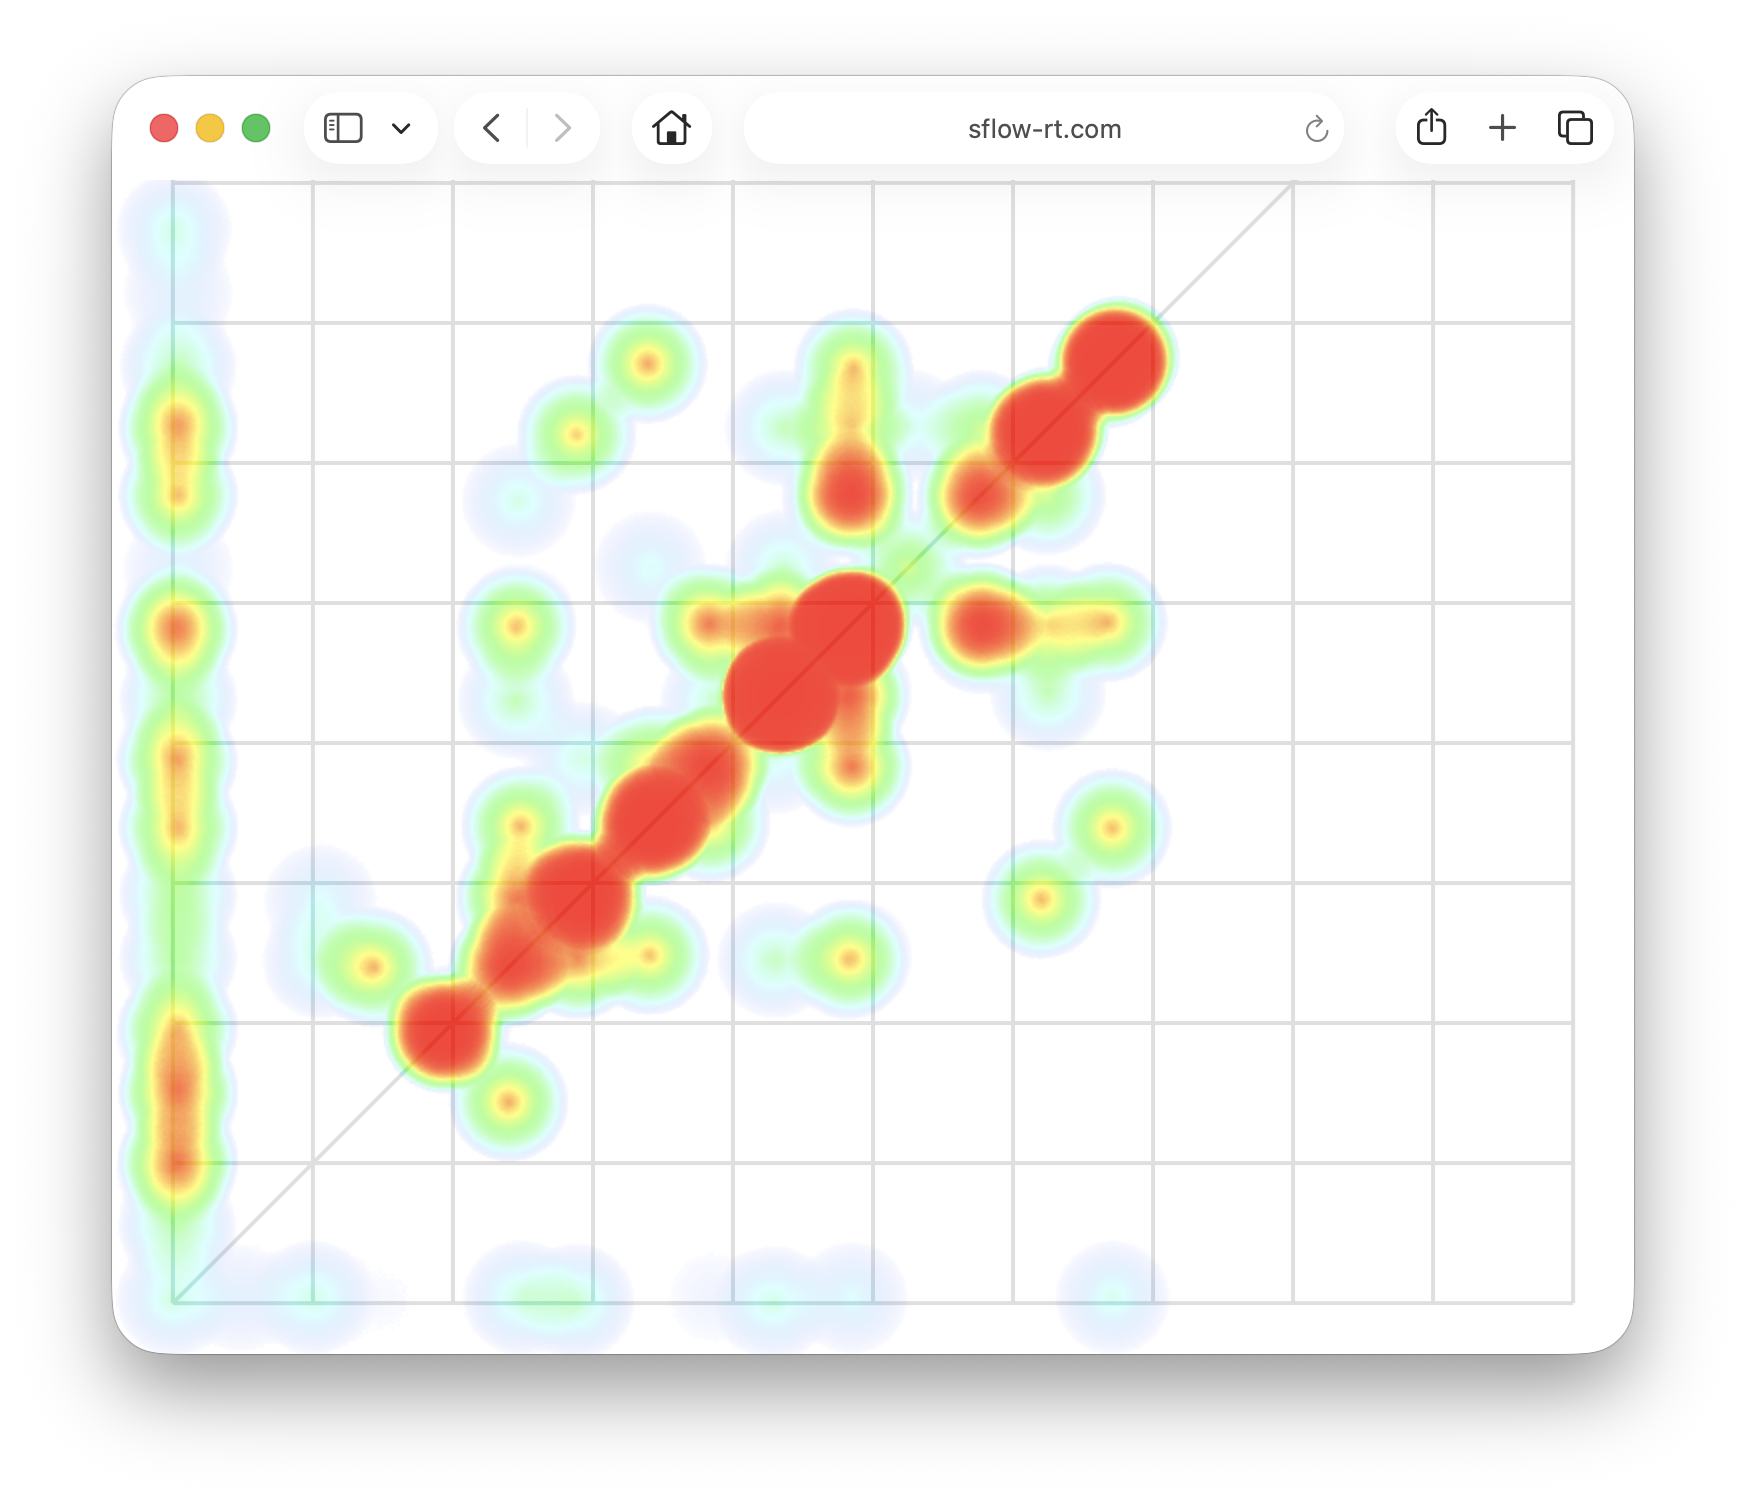
San Diego Supercomputer Center Expanse Cluster AI/ML traffic matrix using heatmap application. See Real-time visualization of AI / ML traffic matrix for an explanation of the chart with examples.
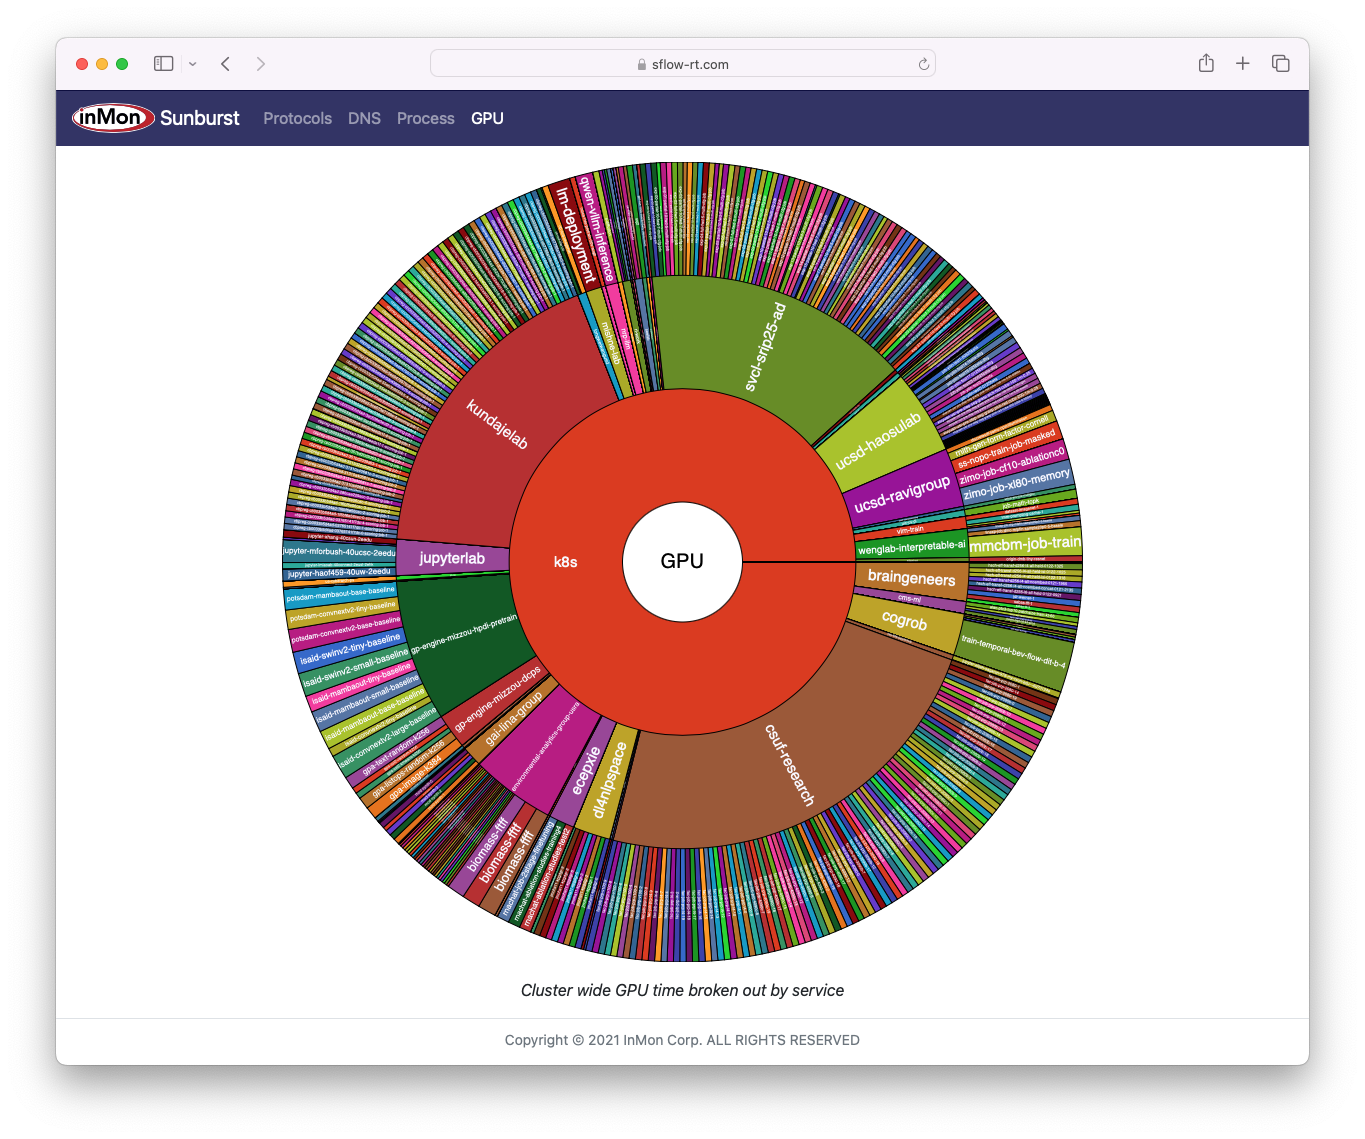
National Research Platform Nautilus Cluster GPU, CPU, and network resources in world-wide Kubernetes cluster using sunburst application. See Real-time Kubernetes cluster monitoring example for more details and step-by-step instructions for deploying monitoring.
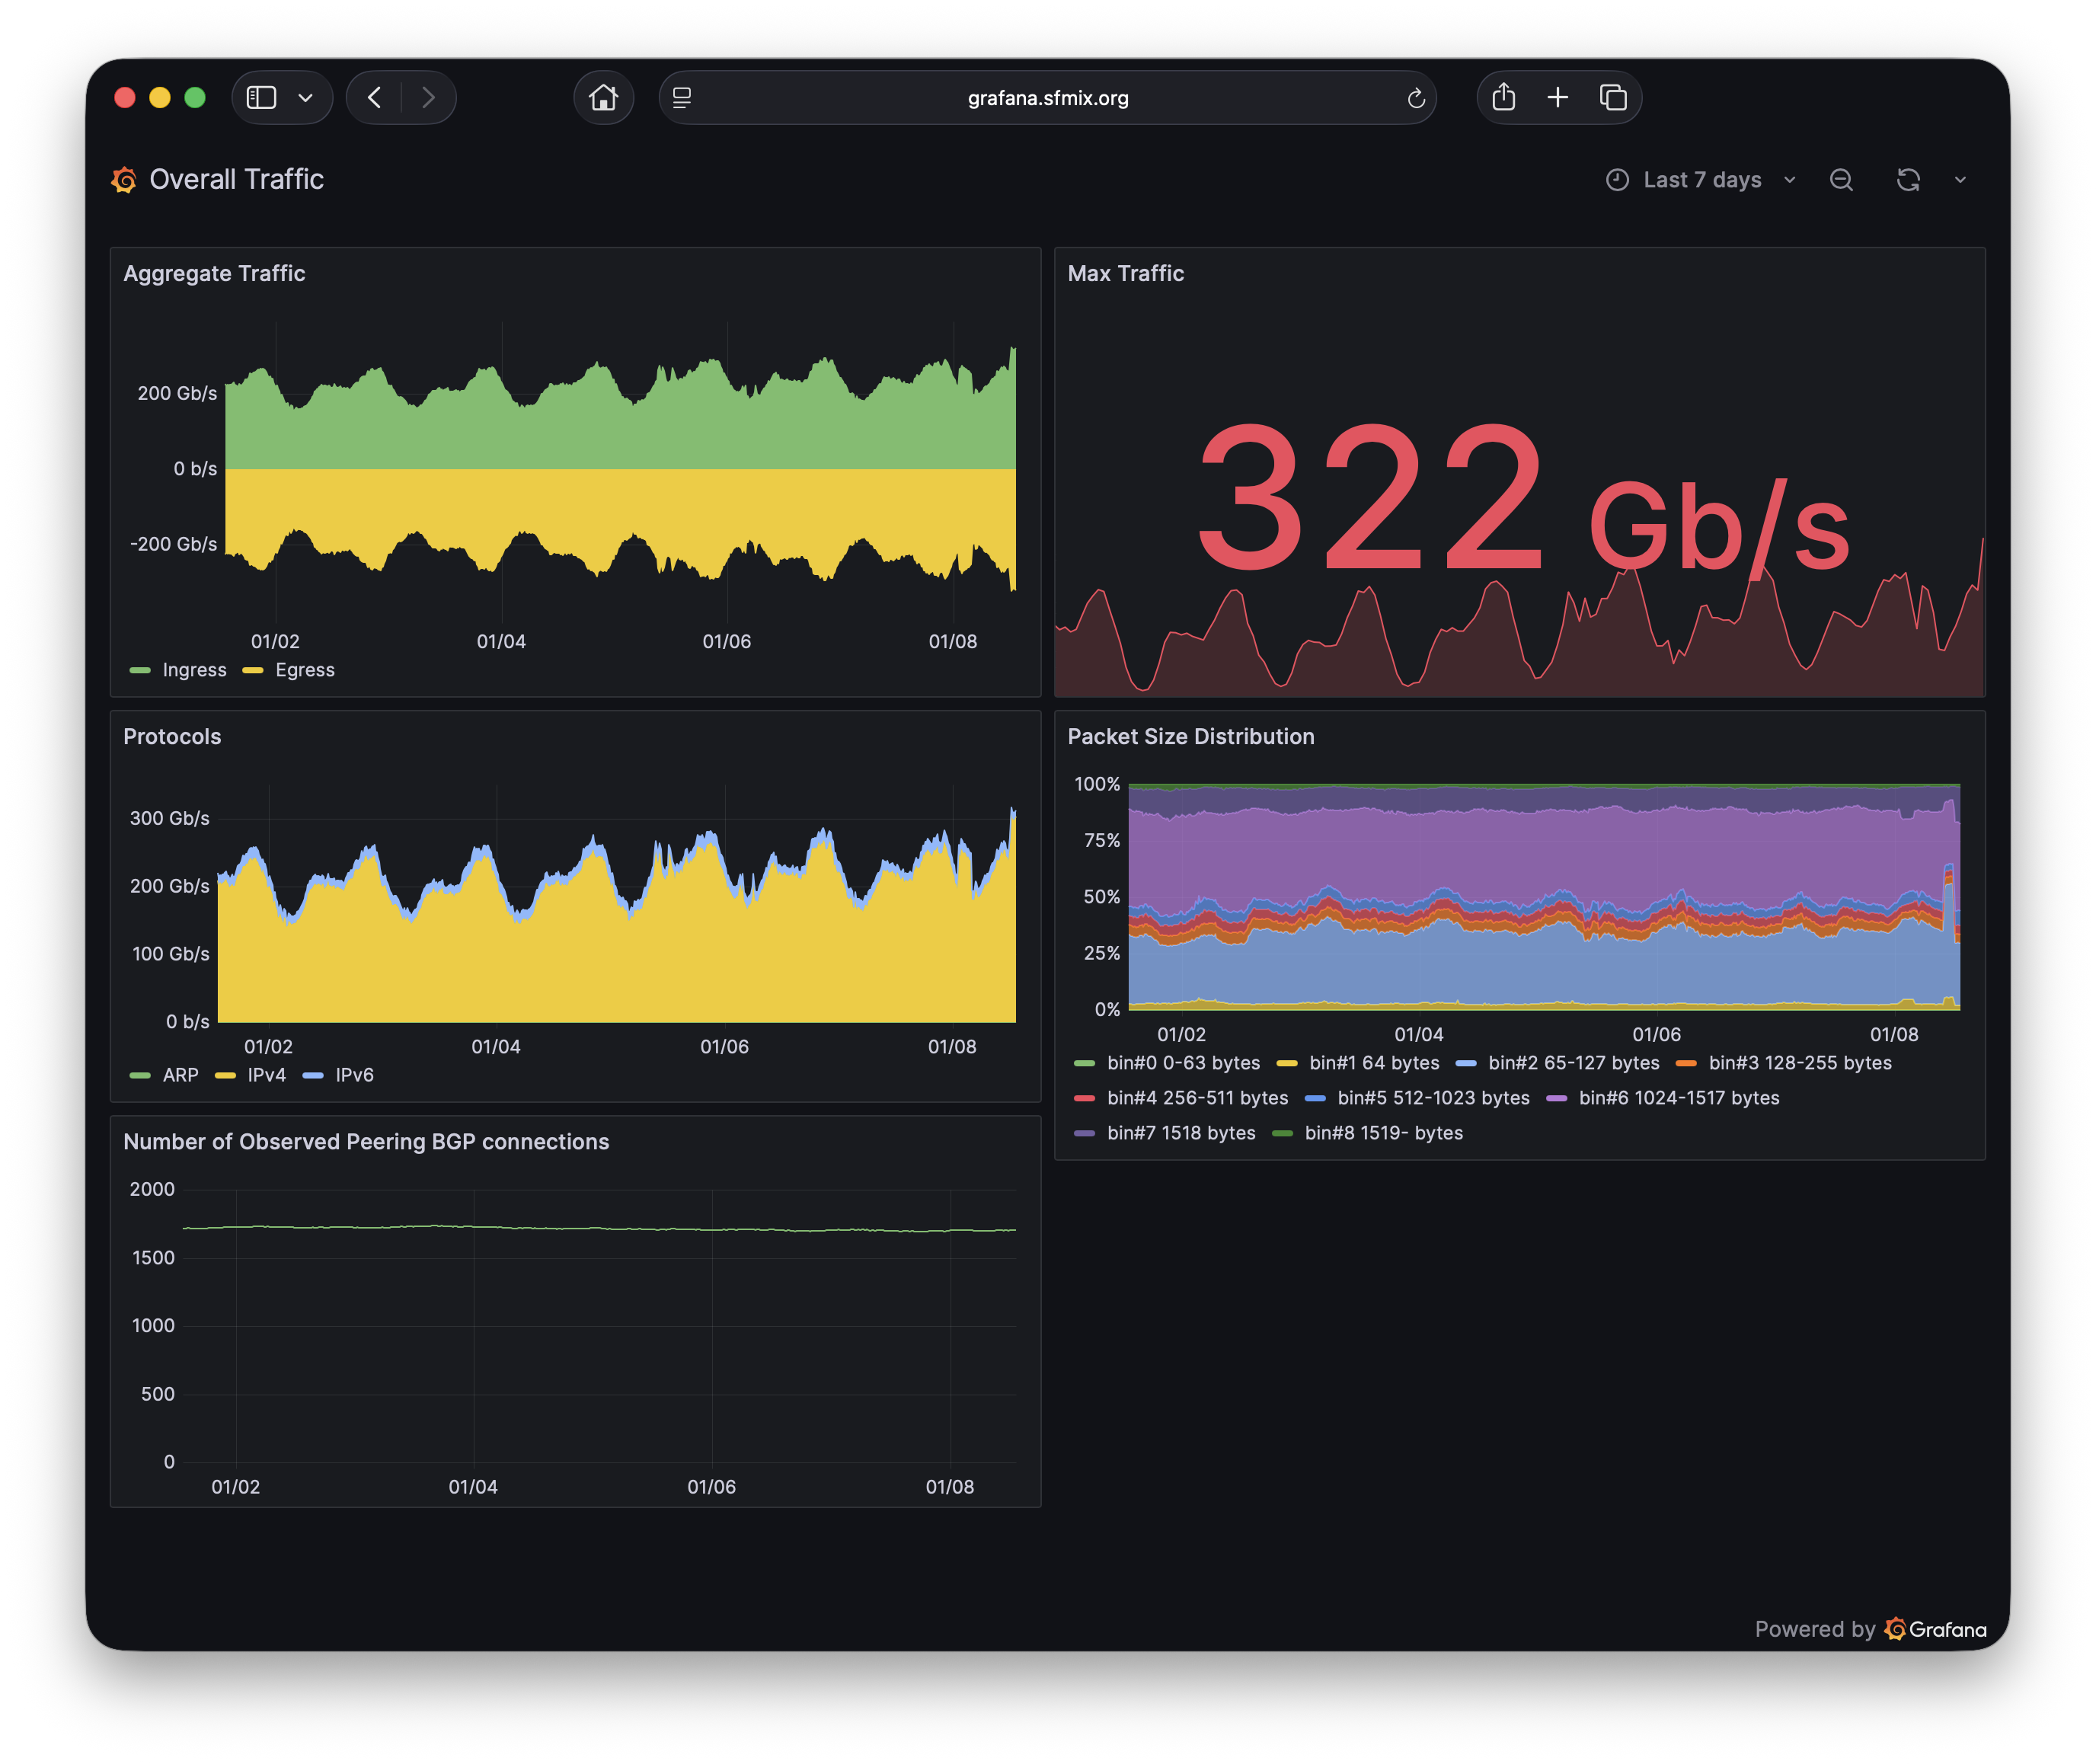
San Francisco Metropolitan Internet Exchange overall traffic dashboard using ixp-metrics application. See Internet eXchange Provider (IXP) Metrics for detailed, step-by-step, instructions for setting up overall exchange traffic and per member peering traffic dashboards.
Live Dashboards maintains a current list publicly accessible dashboards. If you have dashboard to share, would like help learning Continue reading
SONiC developments for visibility into AI/ML networks in 2026
SONiC sFlow High Level Design (HLD) v1.4 was recently published. This is the latest in a series of revisions bringing support for sFlow extensions that enhance network visibility for AI / ML traffic flows.v1.3 Egress sFlow support
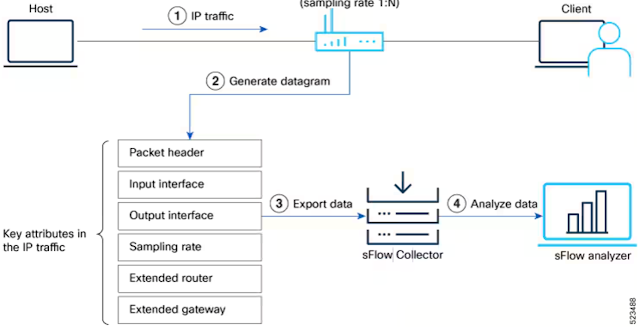
RoCEv2 / Ultra Ethernet host adapters bypass the Linux kernel and transfer data directly to GPU memory, rendering traditional host-based network monitoring tools ineffective (tcpdump, Wireshark, eBPF etc.). Ingress/egress packet sampling on the top of rack switch offloads monitoring from the host to the switch to provide visibility into host traffic.In addition, some measurements may only be possible for egress sampled packets. For example, the v1.3 HLD describes how SONiC SAI drivers can support the sFlow Delay and Transit Structures extension:
Depending on platform capabilities, SAI driver may report additional attributes defined in https://github.com/torvalds/linux/blob/master/include/uapi/linux/psample.h. For example, PSAMPLE_ATTR_OUT_TC (egress queue), PSAMPLE_ATTR_OUT_TC_OCC (egress queue depth), and PSAMPLE_ATTR_LATENCY (transit delay) populate the sFlow Transit Delay Structures (https://sflow.org/sflow_transit.txt).Typically this data is only known when packets egress the switch and may only be available for egress sampled packets.
Transit delay and queuing describes the measurements and provides an example. The sFlow transit delay and queue Continue reading
NetFlow/sFlow Monitoring in AI Environments
 If you’ve spent time supporting AI infrastructure, whether that’s a GPU training cluster, a fleet of inference nodes, or a multi-tenant model serving platform, you’ve probably noticed something: the network telemetry tools that served you well in a traditional data center feel slightly out of place here. Not useless. Just not quite designed for this.
The traffic patterns are different. The failure modes are different. The things you need to catch early are different. And if you’re running NetFlow or sFlow collection – which you should be – understanding where that data genuinely helps versus where you’re looking at the wrong instrument is the difference between a useful monitoring stack and a false sense of coverage.
Why AI Traffic Is Different
Most of the networking intuition you’ve built over a career was forged on north-south traffic – clients reaching services, users reaching the internet, workloads reaching storage. Even in modern microservices environments with heavy east-west traffic, flows are relatively short-lived, heterogeneous in size, and largely TCP-based with normal congestion dynamics.
AI training breaks most of those assumptions simultaneously.
A distributed training job across a GPU cluster is synchronous in a way that most networked workloads are not. Every GPU in Continue reading
Monitoring RoCEv2 with sFlow
The talk Seeing Through the RDMA Fog: Monitoring RoCEv2 with sFlow at the recent North American Network Operator's Group (NANOG) conference describes how leveraging industry standard sFlow telemetry from data center switches provides visibility into RDMA activity in AI / ML networks.
Note: Slides are available from the talk link.
The live SDSC Expanse cluster live AI/ML metrics dashboard described in the talk can be accesses by clicking on the dashboard link. The San Diego Supercomputer Center (SDSC) Expanse cluster specifications: 5 Pflop/s peak; 93,184 CPU cores; 208 NVIDIA GPUs; 220 TB total DRAM; 810 TB total NVMe.Note: AI Metrics with Prometheus and Grafana shows how to set up the monitoring stack.
More recently, Expanse heatmap provides a publicly accessible real-time visualization live traffic flowing between nodes in the Expanse cluster, see Real-time visualization of AI / ML traffic matrix for more information.Real-time visualization of AI / ML traffic matrix
Heatmap is available on GitHub. The application provides a real-time traffic matrix visualization of end-to-end traffic flowing across an Ethernet fabric. Each axis represents an ordered list of network addresses. The x-axis is a flow source and the y-axis is a flow destination.For example, the Heatmap above comes from a large high performance compute cluster running a mixture of tasks. Traffic is concentrated along the diagonal, indicating that the job scheduler is packing related tasks in racks so that most traffic is confined to the rack.
Note: Live Dashboards links to a number dashboards showing live traffic, including the Heatmap above.
The next Heatmap shows a very different traffic pattern. In this case, RoCEv2 traffic generated by GPUs performing a NCCL AllReduce/AllGather collective operation using a ring algorithm. During the collective operation, each GPU sends data to its immediate neighbor (modulo the number of GPUs) in a logical ring, resulting in two nearly continuous lines on either size of the diagonal: one for forward traffic, and the other for return traffic associated with each flow. The final example comes from a large data center hosting a mix of front end workloads. Unlike the backend networks, this network combines internal (East/West) Continue readingExporting events to Loki
Grafana Loki is an open source log aggregation system inspired by Prometheus. While it is possible to use Loki with Grafana Alloy, a simpler approach is to send logs directly using the Loki HTTP API.The following example modifies the ddos-protect application to use sFlow-RT's httpAsync() function to send events to Loki's HTTP API.
var lokiPort = getSystemProperty("ddos_protect.loki.port") || '3100';
var lokiPush = getSystemProperty("ddos_protect.loki.push") || '/loki/api/v1/push';
var lokiHost = getSystemProperty("ddos_protect.loki.host");

function sendEvent(action,attack,target,group,protocol) {
  if(lokiHost) {
    var url = 'http://'+lokiHost+':'+lokiPort+lokiPush;
    lokiEvent = {
      streams: [
        {
          stream: {
            service_name: 'ddos-protect'
          },
          values: [[
            Date.now()+'000000',
            action+" "+attack+" "+target+" "+group+" "+protocol,
            {
              detected_level: action == 'release' ? 'INFO' : 'WARN',
              action: action,
              attack: attack,
              ip: target,
              group: group,
              protocol: protocol
            }
          ]]
        }
      ]
    };
    httpAsync({
      url: url,
      headers: {'Content-Type':'application/json'},
      operation: 'POST',
      body: JSON.stringify(lokiEvent),
      success: (response) => {
        if (200 != response.status) {
          logWarning("DDoS Loki status " + response.status);
        }
      },
      error: (error) => {
        logWarning("DDoS Loki error " + error);
      }
    });
  }

  if(syslogHosts.length === 0) return;

  var msg = {app:'ddos-protect',action:action,attack:attack,ip:target,group:group,protocol:protocol};
  syslogHosts.forEach(function(host) {
    try {
      syslog(host,syslogPort,syslogFacility,syslogSeverity,msg);
    } catch(e) {
      logWarning('DDoS cannot send syslog to ' + host);
    }
  });
}
Continue reading
SC25: SDSC Expanse cluster live AI/ML metrics
The SDSC Expanse cluster live AI/ML metrics dashboard is a joint InMon / San Diego Supercomputer Center (SDSC) demonstration at The International Conference for High Performance Computing, Networking, Storage, and Analysis (SC25) conference being held this week in St. Louis, November 16-21. Click on the dashboard link during the show to see live traffic.By default, the dashboard shows the Last 24 Hours of traffic. Explore the data: select Last 30 Days to get a long term view, select Last 5 Minutes to get an up to the second view, click on items in a chart legend to show selected metric, drag to select an interval and zoom in.
The Expanse cluster at the San Diego Supercomputer Center is a batch-oriented science computing gateway serving thousands of users and a wide range of research projects, see Google News for examples.The SDSC Expanse cluster live AI/ML metrics dashboard displays real-time metrics for workloads running on the cluster:
- Total Traffic Total traffic entering fabric
- Cluster Services Traffic associated with Lustre, Ceph and NFS storage, and Slurm workload management
- Core Link Traffic Histogram of load on fabric links
- Edge Link Traffic Histogram of load on access ports
- RDMA Operations Total RDMA operations
- Continue reading
Ultra Ethernet Transport
The Ultra Ethernet Consortium has a mission to Deliver an Ethernet based open, interoperable, high performance, full-communications stack architecture to meet the growing network demands of AI & HPC at scale. The recently released UE-Specification-1.0.1 includes an Ultra Ethernet Transport (UET) protocol with similar functionality to RDMA over Converged Ethernet (RoCEv2).The sFlow instrumentation embedded as a standard feature of data center switch hardware from all leading vendors (Arista, Cisco, Dell, Juniper, NVIDIA, etc.) provides a cost effective solution for gaining visibility into UET traffic in large production AI / ML fabrics.
docker run -p 8008:8008 -p 6343:6343/udp sflow/prometheusThe easiest way to get started is to use the pre-built sflow/prometheus Docker image to analyze the sFlow telemetry. The chart at the top of this page shows an up to the second view of UET operations using the included Flow Browser application, see Defining Flows for a list of available UET attributes. Getting Started describes how to set up the sFlow monitoring system.
Flow metrics with Prometheus and Grafana describes how collect custom network traffic flow metrics using the Prometheus time series database and include the metrics in Grafana dashboards. Use the Flow Browser to explore Continue reading
Vector Packet Processor (VPP) dropped packet notifications
Vector Packet Processor (VPP) release 25.10 extends the sFlow implementation to include support for dropped packet notifications, providing detailed, low overhead, visibility into traffic flowing through a VPP router, see Vector Packet Processor (VPP) for performance information.
sflow sampling-rate 10000
sflow polling-interval 20
sflow header-bytes 128
sflow direction both
sflow drop-monitoring enable
sflow enable GigabitEthernet0/8/0
sflow enable GigabitEthernet0/9/0
sflow enable GigabitEthernet0/a/0
The above VPP configuration commands enable sFlow monitoring of the VPP dataplane, randomly sampling packets, periodically polling counters, and capturing dropped packets and reason codes. The measurements are send via Linux netlink messages to an instance of the open source Host sFlow agent (hsflowd) which combines the measurements and streams standard sFlow telemetry to a remote collector.
sflow {
  collector { ip=192.0.2.1 udpport=6343 }
  psample { group=1 egress=on }
  dropmon { start=on limit=50 }
  vpp { }
}
The /etc/hsflowd.conf file above enables the modules needed to receive netlink messages from VPP and send the resulting sFlow telemetry to a collector at 192.0.2.1. See vpp-sflow for detailed instructions.
docker run -p 6343:6343/udp sflow/sflowtoolRun sflowtool on the sFlow collector host to verify verify that the data is being received and Continue reading
AI / ML network performance metrics at scale
The charts above show information from a GPU cluster running an AI / ML training workload. The 244 nodes in the cluster are connected by 100G links to a single large switch. Industry standard sFlow telemetry from the switch is shown in the two trend charts generated by the sFlow-RT real-time analytics engine. The charts are updated every 100mS.- Per Link Telemetry shows RoCEv2 traffic on 5 randomly selected links from the cluster. Each trend is computed based on sFlow random packet samples collected on the link. The packet header in each sample is decoded and the metric is computed for packets identified as RoCEv2.
- Combined Fabric-Wide Telemetry combines the signals from all the links to create a fabric wide metric. The signals are highly correlated since the AI training compute / exchange cycle is synchronized across all compute nodes in the cluster. Constructive interference from combining data from all the links removes the noise in each individual signal and clearly shows the traffic pattern for the cluster.
Packet trimming
The latest version of the AI Metrics dashboard uses industry standard sFlow telemetry from network switches to monitor the number of trimmed packets to use as a congestion metric.
Ultra Ethernet Specification Update describes how the Ultra Ethernet Transport (UET) Protocol has the ability to leverage optional “packet trimming” in network switches, which allows packets to be truncated rather than dropped in the fabric during congestion events. As packet spraying causes reordering, it becomes more complicated to detect loss. Packet trimming gives the receiver and the sender an early explicit indication of congestion, allowing immediate loss recovery in spite of reordering, and is a critical feature in the low-RTT environments where UET is designed to operate.
cumulus@switch:~$ nv set system forwarding packet-trim profile packet-trim-default
cumulus@switch:~$ nv config apply
NVIDIA Cumulus Linux release 5.14 for NVIDA Spectrum Ethernet Switches includes support for Packet Trimming. The above command enables packet trimming, sets the DSCP remark value to 11, sets the truncation size to 256 bytes, sets the switch priority to 4, and sets the eligibility to all ports on the switch with traffic class 1, 2, and 3. NVIDA BlueField host adapters respond to trimmed packets to ensure fast congestion recovery.
Linux packet sampling using eBPF
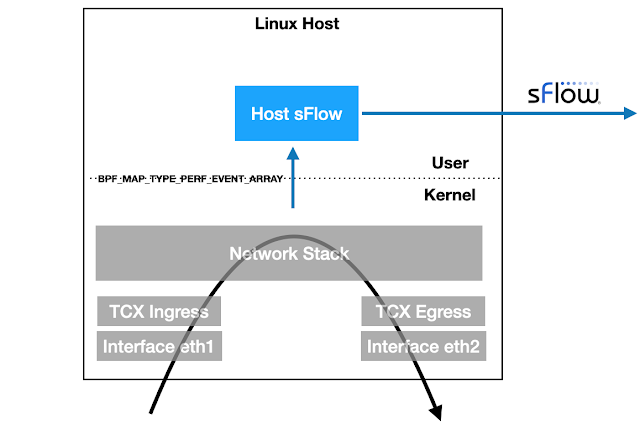
Linux 6.11+ kernels provide TCX attachment points for eBPF programs to efficiently examine packets as they ingress and egress the host. The latest version of the open source Host sFlow agent includes support for TCX packet sampling to stream industry standard sFlow telemetry to a central collector for network wide visibility, e.g. Deploy real-time network dashboards using Docker compose describes how to quickly set up a Prometheus database and use Grafana to build network dashboards.
static __always_inline void sample_packet(struct __sk_buff *skb, __u8 direction) {
    __u32 key = skb->ifindex;
    __u32 *rate = bpf_map_lookup_elem(&sampling, &key);
    if (!rate || (*rate > 0 && bpf_get_prandom_u32() % *rate != 0))
        return;

    struct packet_event_t pkt = {};
    pkt.timestamp = bpf_ktime_get_ns();
    pkt.ifindex = skb->ifindex;
    pkt.sampling_rate = *rate;
    pkt.ingress_ifindex = skb->ingress_ifindex;
    pkt.routed_ifindex = direction ? 0 : get_route(skb);
    pkt.pkt_len = skb->len;
    pkt.direction = direction;

    __u32 hdr_len = skb->len < MAX_PKT_HDR_LEN ? skb->len : MAX_PKT_HDR_LEN;
    if (hdr_len > 0 && bpf_skb_load_bytes(skb, 0, pkt.hdr, hdr_len) < 0)
        return;
    bpf_perf_event_output(skb, &events, BPF_F_CURRENT_CPU, &pkt, sizeof(pkt));
}

SEC("tcx/ingress")
int tcx_ingress(struct __sk_buff *skb) {
    sample_packet(skb, 0);

    return TCX_NEXT;
}

SEC("tcx/egress")
int tcx_egress(struct __sk_buff *skb) {
    sample_packet(skb, 1);

    return TCX_NEXT;
}
The sample.bpf.c file Continue reading
Tracing network packets with eBPF and pwru
pwru (packet, where are you?) is an open source tool from Cilium that used eBPF instrumentation in recent Linux kernels to trace network packets through the kernel.In this article we will use Multipass to create a virtual machine to experiment with pwru. Multipass is a command line tool for running Ubuntu virtual machines on Mac or Windows. Multipass uses the native virtualization capabilities of the host operating system to simplify the creation of virtual machines.
multipass launch --name=ebpf noble
multipass exec ebpf -- sudo apt update
multipass exec ebpf -- sudo apt -y install git clang llvm make libbpf-dev flex bison golang
multipass exec ebpf -- git clone https://github.com/cilium/pwru.git
multipass exec ebpf --working-directory pwru -- make
multipass exec ebpf -- sudo ./pwru/pwru -h
Run the commands above to create the virtual machine and build pwru from sources.
multipass exec ebpf -- sudo ./pwru/pwru port httpsRun pwru to trace https traffic on the virtual machine.
multipass exec ebpf -- curl https://sflow-rt.comIn a second window, run the above command to generate an https request from the virtual machine.
SKB                CPU PROCESS          NETNS      MARK/x        IFACE       PROTO  MTU   LEN   TUPLE FUNC
0xffff9fc40335a0e8 0   ~r/bin/curl:8966 4026531840 0               0          Continue reading
AI Metrics with InfluxDB Cloud
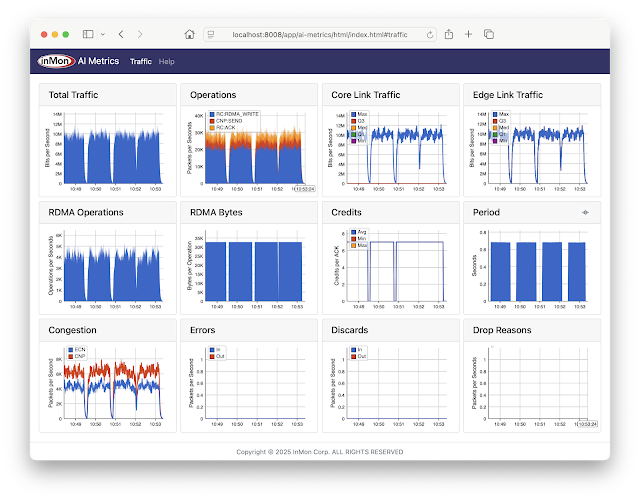
The InfluxDB AI Metrics dashboard shown above tracks performance metrics for AI/ML RoCEv2 network traffic, for example, large scale CUDA compute tasks using NVIDIA Collective Communication Library (NCCL) operations for inter-GPU communications: AllReduce, Broadcast, Reduce, AllGather, and ReduceScatter.The metrics include:
- Total Traffic Total traffic entering fabric
- Operations Total RoCEv2 operations broken out by type
- Core Link Traffic Histogram of load on fabric links
- Edge Link Traffic Histogram of load on access ports
- RDMA Operations Total RDMA operations
- RDMA Bytes Average RDMA operation size
- Credits Average number of credits in RoCEv2 acknowledgements
- Period Detected period of compute / exchange activity on fabric (in this case just over 0.5 seconds)
- Congestion Total ECN / CNP congestion messages
- Errors Total ingress / egress errors
- Discards Total ingress / egress discards
- Drop Reasons Packet drop reasons
Note: InfluxDB Cloud has a free service tier that can be used to test this example.
Save the following compose.yml file on a system running Docker.
configs:
  config.telegraf:
    content: |
      [agent]
        interval = '15s'
        round_interval = true
        omit_hostname = true
      [[outputs.influxdb_v2]]
        urls = ['https://<INFLUXDB_CLOUD_INSTANCE>.cloud2.influxdata.com']
         Continue reading
AI network performance monitoring using containerlab
AI Metrics is available on GitHub. The application provides performance metrics for AI/ML RoCEv2 network traffic, for example, large scale CUDA compute tasks using NVIDIA Collective Communication Library (NCCL) operations for inter-GPU communications: AllReduce, Broadcast, Reduce, AllGather, and ReduceScatter.The screen capture is from a containerlab topology that emulates a AI compute cluster connected by a leaf and spine network. The metrics include:
- Total Traffic Total traffic entering fabric
- Operations Total RoCEv2 operations broken out by type
- Core Link Traffic Histogram of load on fabric links
- Edge Link Traffic Histogram of load on access ports
- RDMA Operations Total RDMA operations
- RDMA Bytes Average RDMA operation size
- Credits Average number of credits in RoCEv2 acknowledgements
- Period Detected period of compute / exchange activity on fabric (in this case just over 0.5 seconds)
- Congestion Total ECN / CNP congestion messages
- Errors Total ingress / egress errors
- Discards Total ingress / egress discards
- Drop Reasons Packet drop reasons
Note: Clicking on peaks in the charts shows values at that time.
This article gives step-by-step instructions to run the demonstration.
git clone https://github.com/sflow-rt/containerlab.gitDownload the sflow-rt/containerlab project from GitHub.
git clone https://github.com/sflow-rt/containerlab.git
cd containerlab
./run-clab
Run the above commands Continue reading
AI Metrics with Grafana Cloud
The Grafana AI Metrics dashboard shown above tracks performance metrics for AI/ML RoCEv2 network traffic, for example, large scale CUDA compute tasks using NVIDIA Collective Communication Library (NCCL) operations for inter-GPU communications: AllReduce, Broadcast, Reduce, AllGather, and ReduceScatter.The metrics include:
- Total Traffic Total traffic entering fabric
- Operations Total RoCEv2 operations broken out by type
- Core Link Traffic Histogram of load on fabric links
- Edge Link Traffic Histogram of load on access ports
- RDMA Operations Total RDMA operations
- RDMA Bytes Average RDMA operation size
- Credits Average number of credits in RoCEv2 acknowledgements
- Period Detected period of compute / exchange activity on fabric (in this case just over 0.5 seconds)
- Congestion Total ECN / CNP congestion messages
- Errors Total ingress / egress errors
- Discards Total ingress / egress discards
- Drop Reasons Packet drop reasons
Note: Grafana Cloud has a free service tier that can be used to test this example.
Multi-vendor support for dropped packet notifications
The sFlow Dropped Packet Notification Structures extension was published in October 2020. Extending sFlow to provide visibility into dropped packets offers significant benefits for network troubleshooting, providing real-time network wide visibility into the specific packets that were dropped as well the reason the packet was dropped. This visibility instantly reveals the root cause of drops and the impacted connections. Packet discard records complement sFlow's existing counter polling and packet sampling mechanisms and share a common data model so that all three sources of data can be correlated, for example, packet sampling reveals the top consumers of bandwidth on a link, helping to get to the root cause of congestion related packet drops reported for the link.
Today the following network operating systems include support for the drop notification extension in their sFlow agent implementations:
- Arista Dropped packet notifications with Arista Networks
- Cisco Dropped packet notifications with Cisco 8000 Series Routers
- Linux Linux as a network operating systemUsing sFlow to monitor dropped packets
- NVIDIA NVIDIA Cumulus Linux 5.11 for AI / ML
- VyOS VyOS 1.4 LTS released
Two additional sFlow dropped packet notification implementations are in the pipeline and should be available later this year:
- SONiC The Switch Continue reading
AI Metrics with Prometheus and Grafana
The Grafana AI Metrics dashboard shown above tracks performance metrics for AI/ML RoCEv2 network traffic, for example, large scale CUDA compute tasks using NVIDIA Collective Communication Library (NCCL) operations for inter-GPU communications: AllReduce, Broadcast, Reduce, AllGather, and ReduceScatter.The metrics include:
- Total Traffic Total traffic entering fabric
- Operations Total RoCEv2 operations broken out by type
- Core Link Traffic Histogram of load on fabric links
- Edge Link Traffic Histogram of load on access ports
- RDMA Operations Total RDMA operations
- RDMA Bytes Average RDMA operation size
- Credits Average number of credits in RoCEv2 acknowledgements
- Period Detected period of compute / exchange activity on fabric (in this case just over 0.5 seconds)
- Congestion Total ECN / CNP congestion messages
- Errors Total ingress / egress errors
- Discards Total ingress / egress discards
- Drop Reasons Packet drop reasons
This article gives step-by-step instructions to set up the dashboard in a production environment.
git clone https://github.com/sflow-rt/prometheus-grafana.git
sed -i -e 's/prometheus/ai-metrics/g' prometheus-grafana/env_vars
./prometheus-grafana/start.sh
The easiest way to get started is to use Docker, see Deploy real-time network dashboards using Docker compose, and deploy the sflow/ai-metrics image bundling the AI Metrics application to generate metrics.
scrape_configs:
  - job_name: 'sflow-rt-ai-metrics'
    metrics_path: /app/ai-metrics/scripts/metrics.js/prometheus/txt
    scheme:  Continue reading
Dropped packet notifications with Cisco 8000 Series Routers
The availability of the Cisco IOS XR Release 25.1.1 brings sFlow dropped packet notification support to Cisco 8000 series routers, making it easy to capture and analyze packets dropped at router ingress, aiding in understanding blocked traffic types, identifying potential security threats, and optimizing network performance.
sFlow Configuration for Traffic Monitoring and Analysis describes the steps to enable sFlow and configure packet sampling and interface counter export from a Cisco 8000 Series router to a remote sFlow analyzer.
Note: Devices using NetFlow or IPFIX must transition to sFlow for regular sampling before utilizing the dropped packet feature, ensuring compatibility and consistency in data analysis.
Router(config)#monitor-session monitor1
Router(config)#destination sflow EXP-MAP
Router(config)#forward-drops rx
Configure a monitor-session with the new destination sflow option to export dropped packet notifications (which include ingress interface, drop reason, and header of dropped packet) to the configured sFlow analyzer.
Cisco lists the following benefits of streaming dropped packets in the configuration guide:
- Enhanced Network Visibility: Captures and forwards dropped packets to an sFlow collector, providing detailed insights into packet loss and improving diagnostic capabilities.
- Comprehensive Analysis: Allows for simultaneous analysis of regular and dropped packet flows, offering a holistic view of network performance.
- Troubleshooting: Empowers Continue reading
Comparing AI / ML activity from two production networks
AI Metrics describes how to deploy the open source ai-metrics application. The application provides performance metrics for AI/ML RoCEv2 network traffic, for example, large scale CUDA compute tasks using NVIDIA Collective Communication Library (NCCL) operations for inter-GPU communications: AllReduce, Broadcast, Reduce, AllGather, and ReduceScatter. The screen capture from the article (above) shows results from a simulated 48,000 GPU cluster.This article goes beyond simulation to demonstrate the AI Metrics dashboard by comparing live traffic seen in two production AI clusters.
