Combating Ransomware in Multi-Cloud Environments
 The rapidly evolving threat environment, coupled with a more vulnerable enterprise network signals a paradigm shift in how organizations will protect data residing on multi-cloud systems.
Inside Nvidia’s NVSwitch GPU Interconnect
At the GPU Technology Conference last week, we told you all about the new NVSwitch memory fabric interconnect that Nvidia has created to link multiple “Volta” GPUs together and that is at the heart of the DGX-2 system that the company has created to demonstrate its capabilities and to use on its internal Saturn V supercomputer at some point in the future.
Since the initial announcements, more details have been revealed by Nvidia about NVSwitch, including details of the chip itself and how it helps applications wring a lot more performance from the GPU accelerators.
Our first observation upon looking …
Inside Nvidia’s NVSwitch GPU Interconnect was written by Timothy Prickett Morgan at The Next Platform.
Innaput Actors Utilize Remote Access Trojan Since 2016, Presumably Targeting Victim Files
Overview ASERT recently identified a campaign targeting commercial manufacturing in the US and potentially Europe in late 2017. The threat actors used phishing and downloader(s) to install a Remote Access Trojan (RAT) ASERT calls InnaputRAT on the target’s machine. The RAT contained a series of […]Sigfox USA President Says Executive Departures Are Typical of Startups
 Can the IoT market support both LPWA and cellular? Yes, says Sigfox, but forming partnerships with other IoT firms may be the best option.
Why and how to deploy Voyager
In Part I of this blog series, “What is the open packet optical switch, Voyager?”, we discussed the challenges and remedies for providing additional bandwidth for intra and inter data center connections. DWDM is a powerful technology that provides hundreds of gigabits of bandwidth over hundreds or thousands of kilometers using just a fiber pair. We also reviewed some information about DWDM networks and transponder functionality. Voyager provides all the functionality of Cumulus Linux running on a Broadcom Tomahawk based switch and integrates the transponders into the switch itself, all in 1RU. This makes it the first open and fully integrated box operating at DWDM, Layer 2 and Layer 3 in 1RU, making it extremely flexible.
Incorporating routing, switching and DWDM in one node could mean fewer boxes needed for the network, since DWDM functionality could be incorporated directly into border leafs. Because it runs Cumulus Linux (CL), all CL data center functionality, such as VXLAN Routing with EVPN, is also supported. For example, a pair of Voyager nodes can be used as VXLAN routing centralized routers with EVPN, hosting VXLAN VTEPs, running MLAG, and provide the long distance DWDM connectivity all in one box!
Voyager also Continue reading
Another Step Toward FPGAs in Supercomputing
There has been plenty of talk about where FPGA acceleration might fit into high performance computing but there are only a few testbeds and purpose-built clusters pushing this vision forward for scientific applications.
While we do not necessarily expect supercomputing centers to turn their backs on GPUs as the accelerator of choice in favor of FPGAs anytime in the foreseeable future. there is some smart investment happening in Europe and to a lesser extent, in the U.S. that takes advantage of recent hardware additions and high-level tool development that put field programmable devices within closer reach–even for centers whose users …
Another Step Toward FPGAs in Supercomputing was written by Nicole Hemsoth at The Next Platform.
ONOS traffic analytics
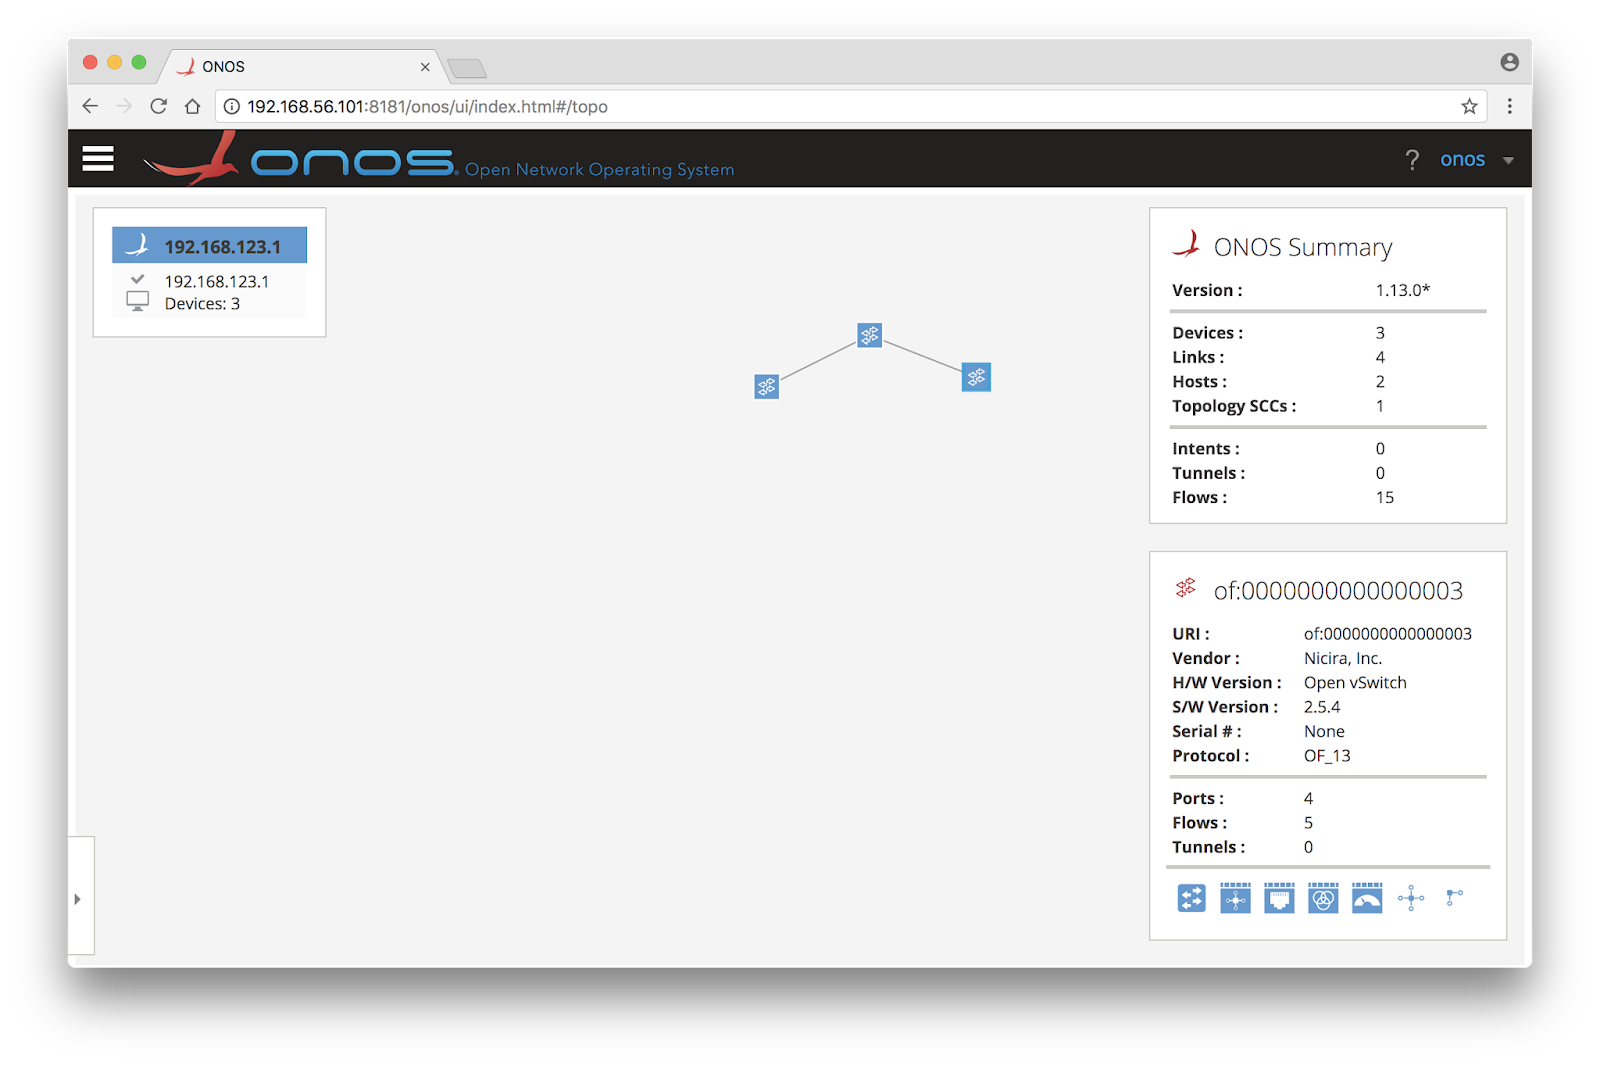
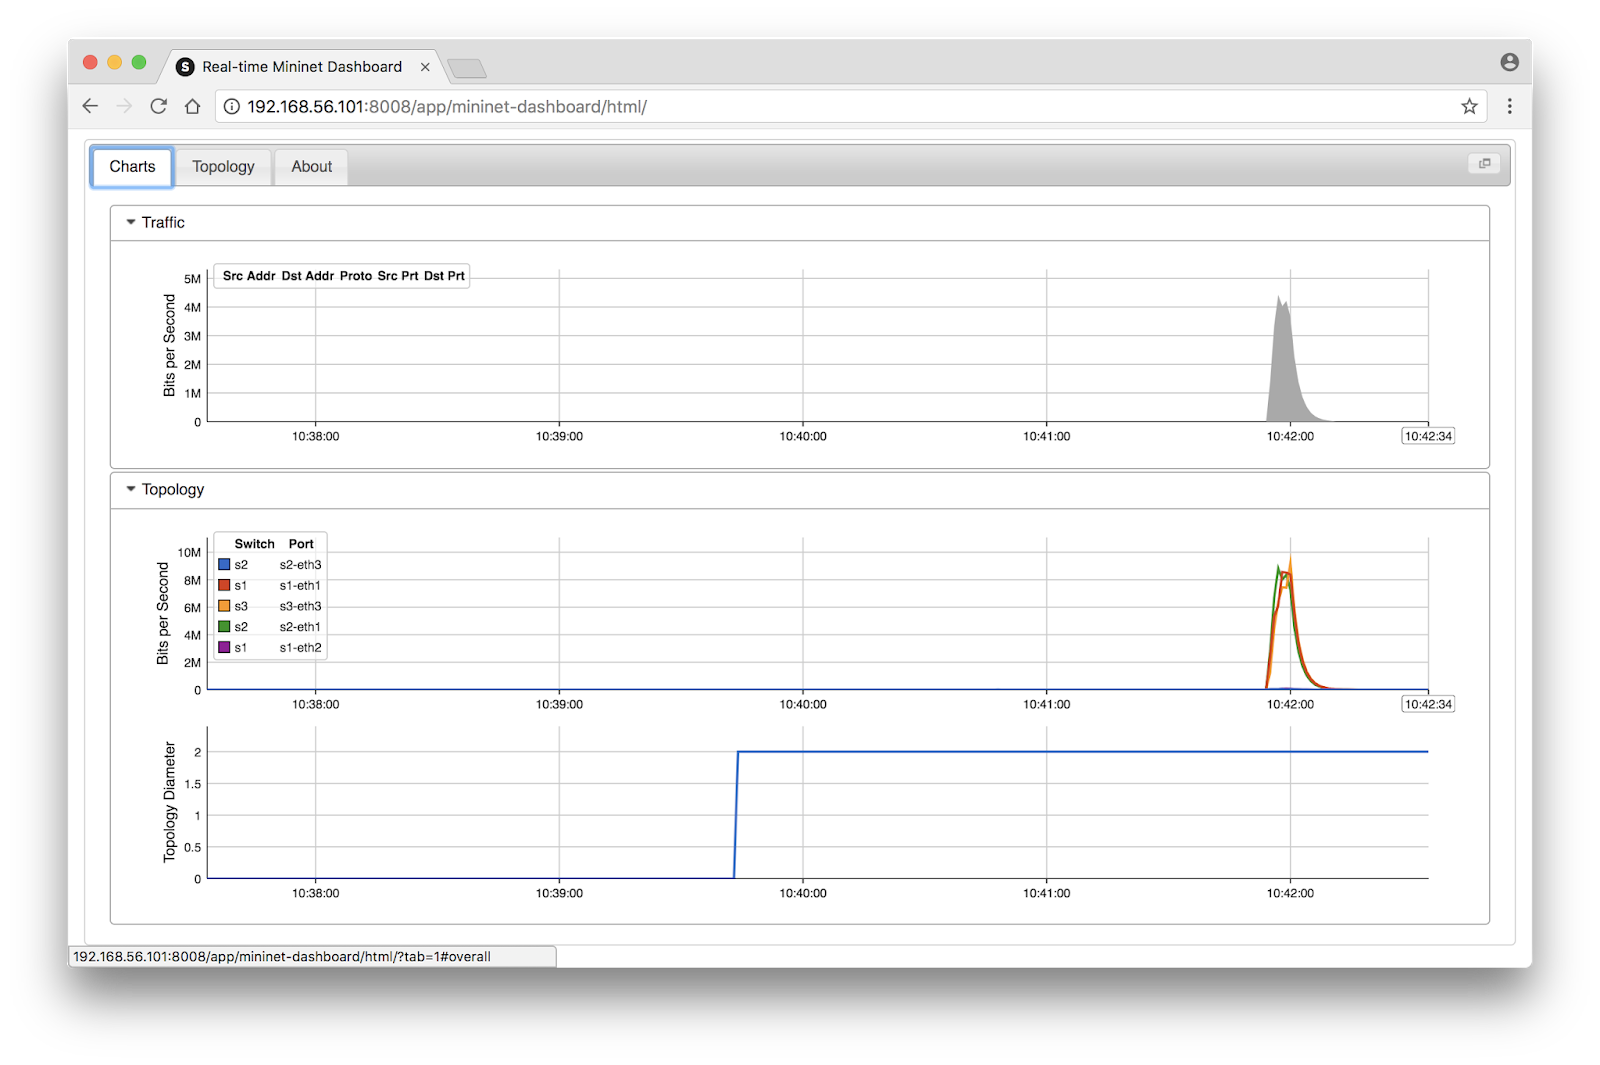
Mininet and onos.py workflow describes how to run ONOS using the Mininet network emulator. Mininet allows virtual networks to be quickly constructed and is a simple way to experiment with ONOS. In addition, Mininet flow analytics describes how to enable industry standard sFlow streaming telemetry in Mininet, proving a simple way monitor traffic in the ONOS controlled network.
For example, the following command creates a Mininet network, controlled by ONOS, and monitored using sFlow:
sudo mn --custom ~/onos/tools/dev/mininet/onos.py,sflow-rt/extras/sflow.py \The screen capture above shows the network topology in the ONOS web user interface.
--link tc,bw=10 --controller onos,1 --topo tree,2,2
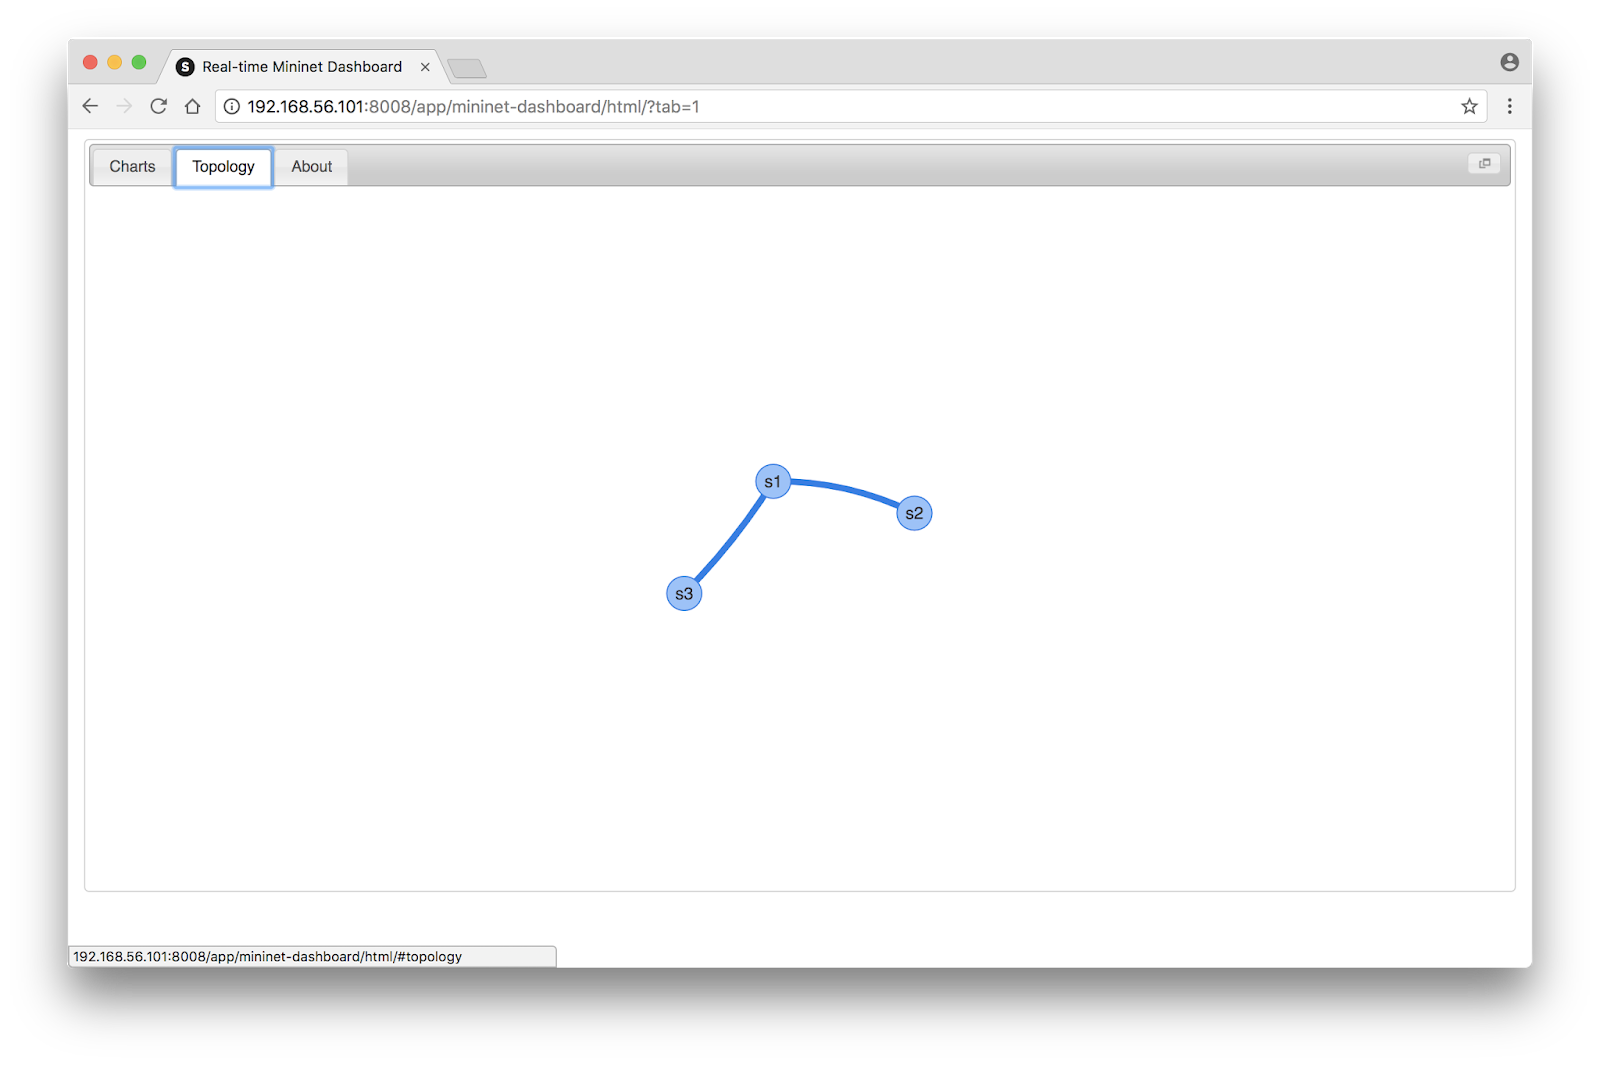
In this case, the traffic was created by the following Mininet command:
mininet-onos> iperf h1 h3
SWIM Dives Into the Competitive Edge, IoT Analytics Waters
 The managed software platform uses a "digital twin" to learn from the data coming into the system to find hidden patterns and predict future behavior.
ARM Reaches Into the Data Center, Competes With Intel
 ARM is also targeting the telco central office, working with such open source groups as the Central Office Re-architected as a Data Center (CORD).
128 Technology Delivers SD-WAN the Right Way
 Most SD-WAN vendors are limited by their inability to create a Service-Centric Fabric.
Reaction: The NRE as the new architect
Over at the Packet Pushers, Anthony Miloslavsky suggests that network architects have outlived their usefulness, so it is time to think of a new role. He describes a role called the “NRE” to replace the architect; the NRE would—
…spend no less than 50% of their time focusing on automation, while spending the other 50% deeply embedded in the operations/engineering/architecture realms of networking. They participate in an on-call rotation to stay in touch with the ops side of the house, with a focus on “treating operations as if it’s a software problem” in response. NREs would provide a expert big picture view of BOTH the development/automation and network operation/design sides of the house.
The author goes on to argue that we need someone who will do operations, engineering, architecture, and development because “pure architecture” folks tend to “lose touch” with the operations side of things. It is too easy to “throw a solution over the cubicle wall” without considering the implementation and operational problems. But, as a friend used to ask of everything when I was still in electronics, will it work? I suspect the answer is no for several reasons.
First, there is no such person as described, and Continue reading
Apple Poaches Google AI Chief John Giannandrea
 Just two days after Giannandrea left Google, he was hired by Apple in a move to boost its AI-capabilities against competitors, including Google and Amazon.
Dell EMC, VMware Top HCI Hardware, Software Revenue Rankings
 Both of Dell Technologies’ brands come out on top of IDC’s latest quarterly tracker, which includes separate rankings for HCI branded products and hyperconverged software providers.
Chuck Robbins Continues to Rewire Cisco
An overview of recent organizational changes at Cisco as the CEO shifts executive roles and responsibilities and brings new leadership on board.