DockerCon EU 2015: Contribute & Collaborate at DockerCon Europe
As the countdown to DockerCon EU 2015 ticks away, we’re excited to introduce a new track and summit dedicated to the Docker Project’s open source community. This past July we had a blast discussing everything Project-related in the Contributor Zone … ContinuedSegment: Rebuilding Our Infrastructure with Docker, ECS, and Terraform
This is a guest repost from Calvin French-Owen, CTO/Co-Founder of Segment.
In Segment’s early days, our infrastructure was pretty hacked together. We provisioned instances through the AWS UI, had a graveyard of unused AMIs, and configuration was implemented three different ways.
As the business started taking off, we grew the size of the eng team and the complexity of our architecture. But working with production was still limited to a handful of folks who knew the arcane gotchas. We’d been improving the process incrementally, but we needed to give our infrastructure a deeper overhaul to keep moving quickly.
So a few months ago, we sat down and asked ourselves: “What would an infrastructure setup look like if we designed it today?”
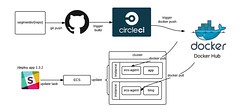
Over the course of 10 weeks, we completely re-worked our infrastructure. We retired nearly every single instance and old config, moved our services to run in Docker containers, and switched over to use fresh AWS accounts.
We spent a lot of time thinking about how we could make a production setup that’s auditable, simple, and easy to use–while still allowing for the flexibility to scale and grow.
Here’s our solution.
Separate AWS Accounts
Worth Reading: The Australian Cyber Security Report

The post Worth Reading: The Australian Cyber Security Report appeared first on 'net work.
Network Break 58: On Dell And EMC, Open Networking
We drill into details of the Dell/EMC acquisition, critique HP's response, examine Intel's quarterly results, opine on Wal-Mart's open source contribution, and check in on the latest from the open networking movement.
The post Network Break 58: On Dell And EMC, Open Networking appeared first on Packet Pushers.
Can You Answer Correctly? BGP Dual-omed With Different As-Path
R23 is configured with maximum-paths 2 and, as you can see, is in the dual-homed topology. All of the attributes are 100% identical with the exception of what you see listed in the picture below. R23 has 2 paths listed in its BGP table for all prefixes being advertised from R15 yet, only installs 1 into its RIB, why does this happen? In addition, what command can I use to fix my problem.
I know the answer but, do you? Leave your answer in the comments!

Multitasking, Microtasking, and Macrotasking
![]()
![]()
One of the most frustrating things in my daily life is reaching lunch and not having a single thing I can point to as “done” for the day. I’m certain this is something every engineer faces from time to time — or even all the time (like me), because even Dilbert has something to say about it.

This is all the more frustrating for me because I actually don’t have clones (contrary to rumor #1), and I actually do sleep (contrary to rumor #2). I even spend time with my wife and kids from time to time, as well as volunteer at a local church and seminary (teaching philosophy/ethics/logic/theology/worldview/apologetics to a high school class, and being a web master/all around IT resource, guest lecturer, etc., in the other). My life’s motto seems to be waste not a moment, from reading to writing to research to, well just about everything that doesn’t involve other people (I try to never be in a hurry when dealing with people, though this it’s honestly hard to do).
So, without clones, and with sleep, how can we all learn to be more productive? I’m no master of time (honestly), but my first rule is: Continue reading
5 New Networking Requirements Driven By Internet of Things and Big Data
The Internet of Things is leading to an explosion in the data available to make faster and better-informed business decisions. The key to exploiting this data for business benefit is accessing it on demand and rapidly analyzing it to deliver value. This requires massive volumes of data be moved across the infrastructure, from distributed locations of rest, to locations of analysis. Many networks, however, are fragile, outdated and unprepared for that level of stress. This means it’s time for the network to undergo its own transformation to meet these data transport needs.
As data is created in greater amounts – and inevitably transferred between resources – the network must become increasingly powerful, flexible and agile in order to keep up with application demands.
Where can networks improve? What do they need that they don’t have now? We’ve outlined five different characteristics below.
Agility. Data and application agility is meaningless if the network cannot keep pace. And keeping pace means removing complexity, simplifying operations and embracing automation to provide a dynamic and responsive infrastructure
Scalability. In a dynamic data and application environment where data volumes are exploding, it’s about more than just scaling up. The challenge with scalability now is really Continue reading
We Need Product Documentation, not just Glitzy Demos
Whenever a vendor approaches me touting the benefits of their new gizmo, they want to give me a product demo, or offer me access to online labs… and I always tell them I’m not interested until I see their design and configuration guides.
Here’s why I think you should take the same approach:
Read more ...Education for SDN from the ONF
After an incredibly busy week at the Layer 123 SDN World Congress in Düsseldorf, questions of how education is delivered and how it should be delivered in to the field are churning in my aching brain. After a (really) high number of conversations, it’s pretty clear that education for SDN, NfV and network automation is on the mind of professionals and current students alike.
With an almost cocky and over-confident certainty, it’s easy to guess that most network engineers and architects have taken the Cisco road to gain skill sets. Some invest in more neutral options like CBT Nuggets and IPSpace.net, which bring a rich variety of additional content. Cisco have almost certainly set in concrete the way traditional network engineers ‘have’ to learn and as the corporate ladder is ascended year by year, every freshly minted manager believes that his or her staff must follow the same road and ‘earn their spurs’. Not to say there was anything wrong with it, but times change and so must education and learning.
The traditional path to education and certification goes something like this:
NetEng: I need to learn and validate my learning for my employer, or partnership status Continue reading