Author Archives: Peter
Author Archives: Peter


The SC23-NRE-026 Standard Packet Drop Monitoring In High Performance Networks dashboard combines telemetry from all the Arista switches in the SCinet network to provide real-time network-wide view of performance. Each of the three charts demonstrate a different type of measurement in the sFlow telemetry stream:

IXP Metrics is available on Github. The application provides real-time monitoring of traffic between members of an Internet eXchange Provider (IXP) network.
This article will use Arista switches as an example to illustrate the steps needed to deploy the monitoring solution, however, these steps should work for other network equipment vendors (provided you modify the vendor specific elements in this example).
git clone https://github.com/sflow-rt/prometheus-grafana.git
cd prometheus-grafana
env RT_IMAGE=ixp-metrics ./start.sh
The easiest way to get started is to use Docker, see Deploy real-time network dashboards using Docker compose, and deploy the sflow/ixp-metrics image bundling the IXP Metrics application.
scrape_configs:
  - job_name: sflow-rt-ixp-metrics
    metrics_path: /app/ixp-metrics/scripts/metrics.js/prometheus/txt
    static_configs:
    - targets: ['sflow-rt:8008']
Follow the directions in the article to add a Prometheus scrape task to retrieve the metrics.
sflow source-interface management 1
sflow destination 10.0.0.50
sflow polling-interval 20
sflow sample 50000
sflow run
Enable sFlow on all exchange switches, directing sFlow telemetry to the Docker host (in this case 10.0.0.50).


git clone https://github.com/sflow-rt/containerlab.git
cd containerlab
./run-clab
Run the above commands to download the project and run Containerlab on a system with Docker installed. Docker Desktop is a conventient way to run the labs on a laptop.
containerlab deploy -t clos5.ymlStart the emulation.
./topo.py clab-clos5Post topology to sFlow-RT REST API. Connect to http://localhost:8008/app/containerlab-dashboard/html/ to access the Dashboard shown at the top of this article.
docker exec -it clab-clos5-h1 iperf3 -c 172.16. Continue reading


Deploy real-time network dashboards using Docker compose, describes how to quickly deploy a real-time network analytics stack that includes the sFlow-RT analytics engine, Prometheus time series database, and Grafana to create dashboards. This article describes how to extend the example using the Grafana Network Weathermap Plugin to display network topologies like the ones shown here.


git clone https://github.com/sflow-rt/prometheus-grafana.git
cd prometheus-grafana
./start.sh
Download the sflow-rt/prometheus-grafana project from GitHub on a system with Docker installed and start the containers. The start.sh script runs docker compose to bring up the containers specified in the compose.yml file, passing in user information so that the containers have correct permission to write data files in the prometheus and grafana directories.
All the Docker images in this example are available for both x86 and ARM processors, so this stack can be deployed on Intel/AMD platforms as well as Apple M1/M2 or Raspberry Pi. Raspberry Pi 4 real-time network analytics describes how to configure a Raspberry Pi 4 to run Docker and perform real-time network analytics and is a simple way to run this stack for smaller networks.
Configure sFlow Agents in network devices to stream sFlow telemetry to the host running the analytics stack. See Getting Started for information on how to verify that sFlow telemetry is being received.

 |
| CanaKit Raspberry Pi 4 EXTREME Kit - Aluminum |


Next, follow instruction for installing Docker Engine (Raspberry Pi OS Lite is based on Debian 11).


The Containerlab project currently has limited support for Mac OS, stating "ARM-based Macs (M1/2) are not supported, and no binaries are generated for this platform. This is mainly due to the lack of network images built for arm64 architecture as of now." However, this argument doesn't apply to the Linux based images used in these examples.
First install Docker Desktop on your Apple silicon based Mac (select the Apple Chip option).
mkdir clab
cd clab
docker run --rm -it --privileged \
  --network host --pid="host" \
  -v /var/run/docker.sock:/var/run/docker.sock \
  -v /run/netns:/run/netns \
  -v $(pwd):$(pwd) -w $(pwd) \
  sflow/clab bash
Run Containerlab by typing the above commands in a terminal. This command uses a pre-built multi-architecture Continue reading

vyos@vyos:~$ add container image sflow/ddos-protectFirst, download the sflow/ddos-protect image.
vyos@vyos:~$ mkdir -m 777 /config/sflow-rtCreate a directory to store persistent container state.
set container network sflowrt prefix 192.168.1.0/24Define an internal network to connect to container. Currently VyOS BGP does not allow direct connections to local addresses (e.g. 127.0.0.1), so we need to put controller on its own network so the router can connect and receive DDoS mitigation BGP RTBH / Flowspec controls.
set container name sflow-rt image sflow/ddos-protect
set container name sflow-rt host-name sflow-rt
set container name sflow-rt arguments '-Dddos_protect.router=192.168.1.1 -Dddos_protect.enable.flowspec=yes'
set container name sflow-rt environment RTMEM value 200M
set container name sflow-rt memory 0
set container name sflow-rt volume store source /config/sflow-rt
set container name sflow-rt volume store destination /sflow-rt/store
set container name sflow-rt network sflowrt address 192.168.1.2
Configure a container to run the image. The Continue reading

vyos@vyos:~$ add container image sflow/ddos-protectFirst, download the sflow/ddos-protect image.
vyos@vyos:~$ mkdir -m 777 /config/sflow-rtCreate a directory to store persistent container state.
set container name sflow-rt image sflow/ddos-protect
set container name sflow-rt allow-host-networks
set container name sflow-rt arguments '-Dhttp.hostname=10.0.0.240'
set container name sflow-rt environment RTMEM value 200M
set container name sflow-rt memory 0
set container name sflow-rt volume store source /config/sflow-rt
set container name sflow-rt volume store destination /sflow-rt/store
Configure a container to run the image. The RMEM environment variable setting limits the amount of memory that the container will use to 200M bytes. The -Dhttp.hostname argument sets the internal web server to listen on management address, 10.0.0.240, assigned to eth0 on this router. The container has is no built-in authentication, so access needs to be limited using an ACL or through a reverse proxy - see Download and install.
set system sflow interface eth0
set system sflow interface eth1
set system sflow interface  Continue reading

vyos@vyos:~$ uname -r
6.1.22-amd64-vyos
The latest VyOS rolling release runs on a Linux 6.1 kernel and the latest release of VyOS now provides enhanced visibility into dropped packets using kernel reason codes.
vyos@vyos:~$ show version
Version:          VyOS 1.4-rolling-202303310716
Release train:    current

Built by:         [email protected]
Built on:         Fri 31 Mar 2023 07:16 UTC
Build UUID:       1a7448d9-d53c-48a0-8644-ed1970c1abb8
Build commit ID:  75c9311fba375e

Architecture:     x86_64
Boot via:         installed image
System type:       guest

Hardware vendor:  innotek GmbH
Hardware model:   VirtualBox
Hardware S/N:     0
Hardware UUID:    da75808d-ff60-1d4c-babd-84a7fa341053

Copyright:        VyOS maintainers and contributors
Verify that the version of of VyOS is VyOS 1.4-rolling-202303310716 or later.
In the previous article, VyOS dropped packet notifications, two tests were performed, the first a failed attempt to connect to the VyOS router using telnet (telnet has been disabled in Continue reading

The recent addition of dropreason.h in Linux 6+ kernels provides detailed reasons for packet drops. The netlink drop_monitor API has been extended to include the NET_DM_ATTR_REASON attribute to report the drop reason, see net_dropmon.h.
The following example illustrates the value of the reason code in explaining Linux packet drops.
tcp_v4_rcv+0x7c/0xef0The value of NET_DM_ATTR_SYMBOL shown above indicates that the packet was dropped in the tcp_v4_rcv function in Linux kernel at memory location 0x7c/0xef0. While this information is helpful, there are many reasons why a TCP packet may be dropped.
NO_SOCKETIn this case, the value of NET_DM_ATTR_REASON shown above indicates that the TCP packet was dropped because no application had opened a socket and so there was nowhere to deliver the packet.
In the case of Linux-based hardware switches or smart network adapters, where packet processing is offloaded to hardware, the netlink drop_monitor events include NET_DM_ATTR_HW_TRAP_GROUP_NAME and NET_DM_ATTR_HW_TRAP_NAME attributes and packet header information supplied by the hardware Continue reading

Dropped packets have a profound impact on network performance and availability. Packet discards due to congestion can significantly impact application performance. Dropped packets due to black hole routes, expired TTLs, MTU mismatches, etc. can result in insidious connection failures that are time consuming and difficult to diagnose. Visibility into dropped packets offers significant benefits for network troubleshooting, providing real-time network-wide visibility into the specific packets that were dropped as well the reason the packet was dropped. This visibility instantly reveals the root cause of drops and the impacted connections.
vyos@vyos:~$ show version
Version:          VyOS 1.4-rolling-202303260914
Release train:    current

Built by:         [email protected]
Built on:         Sun 26 Mar 2023 09:14 UTC
Build UUID:       72b34f74-bfcd-4b51-9b95-544319c2dac5
Build commit ID:  d68bda6a295ba9

Architecture:     x86_64
Boot via:         installed image
System type:       guest

Hardware vendor:  innotek GmbH
Hardware model:   VirtualBox
Hardware S/N:     0
Hardware UUID:    df0a2b79-b8c4-8342-a27f-76aa3e52ad6d

Copyright:        VyOS maintainers and contributors
Verify that the version of of VyOS is VyOS 1.4-rolling-202303260914 or later.
On VyOS dropped packet monitoring Continue reading
vyos@vyos:~$ show versionVerify that the version of of VyOS is VyOS 1.4-rolling-202303170317 or later
Version: VyOS 1.4-rolling-202303170317
Release train: current
Built by: [email protected]
Built on: Fri 17 Mar 2023 03:17 UTC
Build UUID: 45391302-1240-4cc7-95a8-da8ee6390765
Build commit ID: e887f582cfd7de
Architecture: x86_64
Boot via: installed image
System type: guest
Hardware vendor: innotek GmbH
Hardware model: VirtualBox
Hardware S/N: 0
Hardware UUID: 871dd0f0-c4ec-f147-b1a7-ed536511f141
Copyright: VyOS maintainers and contributors
set system sflow interface eth0The above commands configure sFlow export in the VyOS CLI using the embedded Host sFlow agent.
set system sflow interface eth1
set system sflow interface eth2
set system sflow polling 30
set system sflow sampling-rate 1000
set system sflow server 10.0.0.30 port 6343
docker run --name sflow-rt -p 8008:8008 -p 6343:6343/udp -d sflow/prometheusA quick way to experiment with sFlow is to run the pre-built sflow/prometheus image Continue reading

VyOS claims sFlow support, so why is it necessary to install an alternative sFlow agent? The following experiment demonstrates that there are significant issues with the VyOS sFlow implementation.
vyos@vyos:~$ show versionInstall a recent version of VyOS under VirtualBox and configure routing between two Linux virtual machines connected to eth1 and eth2 on the router. Out of band management is configured on eth0.
Version: VyOS 1.4-rolling-202301260317
Release train: current
Built by: [email protected]
Built on: Thu 26 Jan 2023 03:17 UTC
Build UUID: a95385b7-12f9-438d-b49c-b91f47ea7ab7
Build commit ID: d5ea780295ef8e
Architecture: x86_64
Boot via: installed image
System type: KVM guest
Hardware vendor: innotek GmbH
Hardware model: VirtualBox
Hardware S/N: 0
Hardware UUID: 6988d219-49a6-0a4a-9413-756b0395a73d
Copyright: VyOS maintainers and contributors
set system flow-accounting disable-imtThe above commands configure sFlow monitoring Continue reading
set system flow-accounting sflow agent-address 10.0.0.50
set system flow-accounting sflow sampling-rate 1000
set system flow-accounting sflow server 10.0.0.30 port 6343
set system flow-accounting interface eth0
set system flow-accounting interface eth1
set system flow-accounting interface eth2

This article describes an experiment with Containerlab's advanced Generated topologies capability, taking the 3 stage Clos topology shown above and creating a template that can be used to generate topologies with any number of leaf and spine switches.
The clos3.yml topology file specifies the 2 leaf 2 spine topology shown above:
name: clos3
mgmt:
  network: fixedips
  ipv4_subnet: 172.100.100.0/24
  ipv6_subnet: 2001:172:100:100::/80

topology:
  defaults:
    env:
      COLLECTOR: 172.100.100.8
  nodes:
    leaf1:
      kind: linux
      image: sflow/clab-frr
      mgmt_ipv4: 172.100.100.2
      mgmt_ipv6: 2001:172:100:100::2
      env:
        LOCAL_AS: 65001
        NEIGHBORS: eth1 eth2
        HOSTPORT: eth3
        HOSTNET: "172.16.1.1/24"
        HOSTNET6: "2001:172:16:1::1/64"
      exec:
        - touch /tmp/initialized
    leaf2:
      kind: linux
      image: sflow/clab-frr
      mgmt_ipv4: 172.100.100.3
      mgmt_ipv6: 2001:172:100:100::3
      env:
        LOCAL_AS: 65002
        NEIGHBORS:  Continue reading

CONTAINERlab is a Docker orchestration tool for creating virtual network topologies. The sflow-rt/containerlab project contains a number of topologies demonstrating industry standard streaming sFlow telemetry with realistic data center topologies. This article extends the examples in Real-time telemetry from a 5 stage Clos fabric and Real-time EVPN fabric visibility to demonstrate visibility into IPv6 traffic flows.
docker run --rm -it --privileged --network host --pid="host" \
  -v /var/run/docker.sock:/var/run/docker.sock -v /run/netns:/run/netns \
  -v $(pwd):$(pwd) -w $(pwd) \
  ghcr.io/srl-labs/clab bash
Run the above command to start Containerlab if you already have Docker installed. Otherwise, Installation provides detailed instructions for a variety of platforms.
curl -O https://raw.githubusercontent.com/sflow-rt/containerlab/master/clos5.yml
Download the topology file for the 5 stage Clos fabric shown above.
containerlab deploy -t clos5.yml
Finally, deploy the topology.

docker exec -it clab-clos5-h1 iperf3 -c 2001:172:16:4::2
Each of the hosts in the network has an iperf3 server, so running the above command will test bandwidth between Continue reading


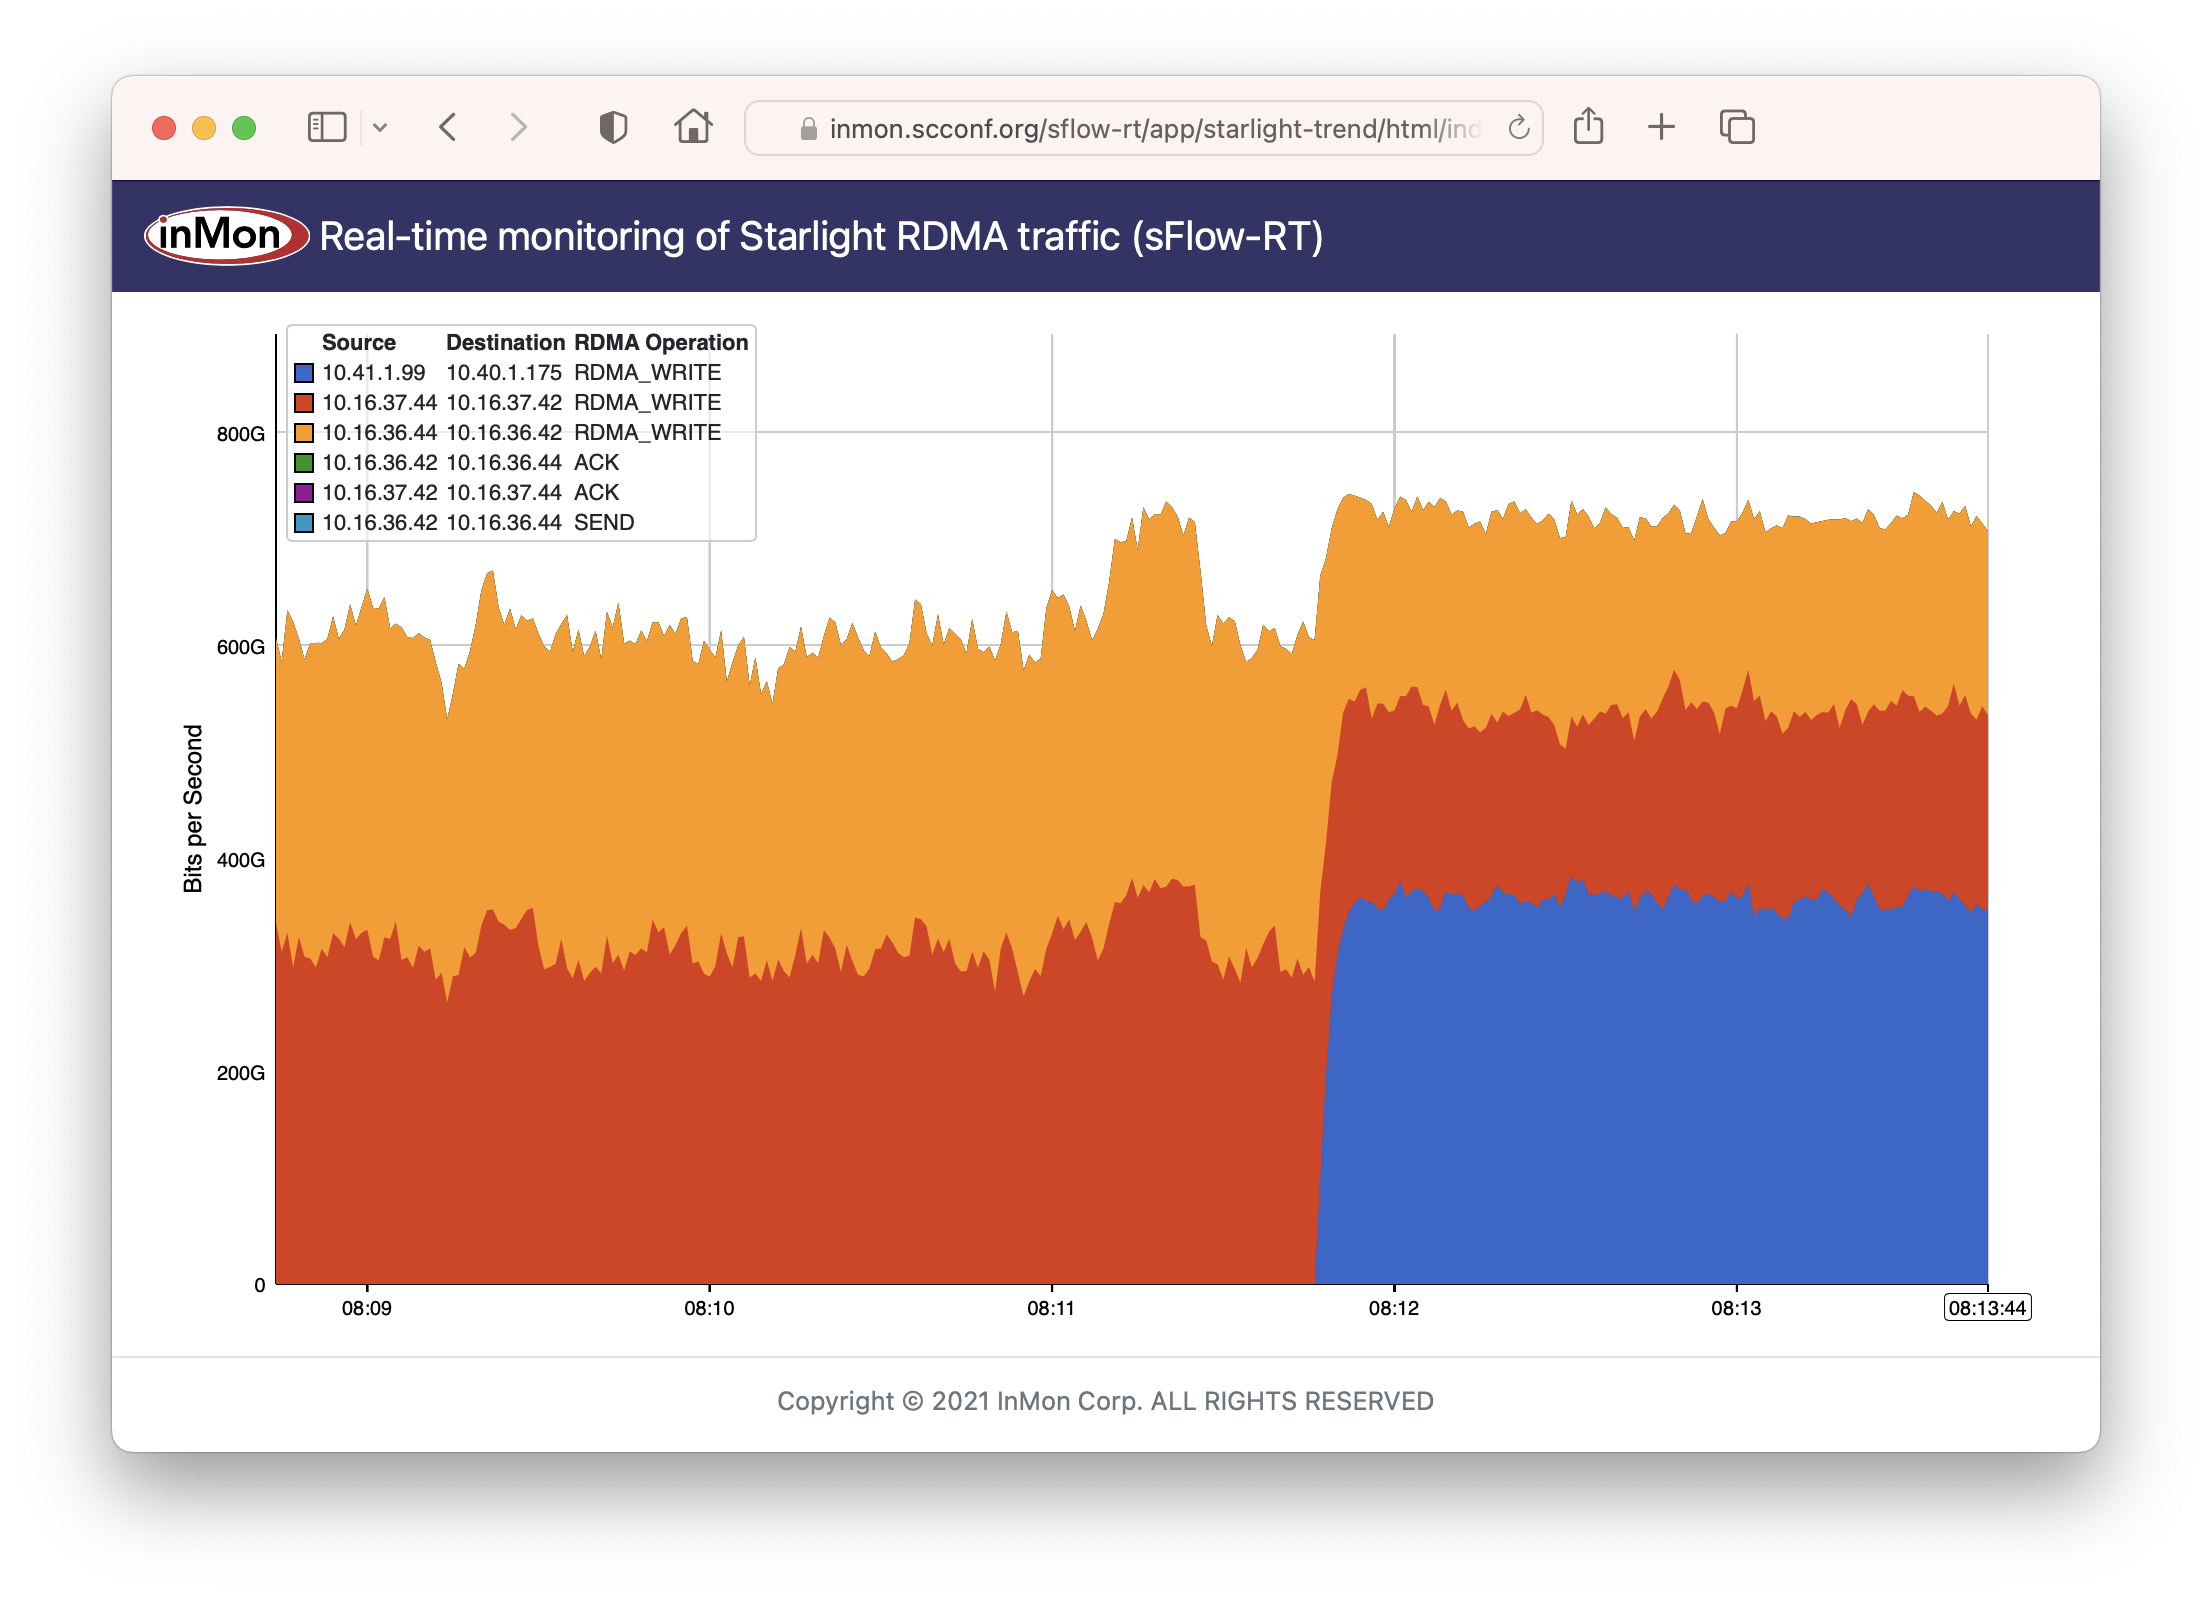


Scientific network tags (scitags) is an initiative promoting identification of the science domains and their high-level activities at the network level. Participants include, dCache, ESnet, GÉANT, Internet2, Jisc, NORDUnet, OFTS, OSG, RNP, RUCIO, StarLight, XRootD.

This article will demonstrate how industry standard sFlow telemetry streaming from switches and routers can be used to report on science domain activity in real-time using the sFlow-RT analytics engine.

The scitags initiative makes use of the IPv6 packet header to mark traffic. Experiment and activity identifiers are encoded in the IPv6 Flow label field. Identifiers are published in an online registry in the form of a JSON document, https://www.scitags.org/api.json.
One might expect IPFIX / NetFlow to be a Continue reading

