Author Archives: Peter
Author Archives: Peter
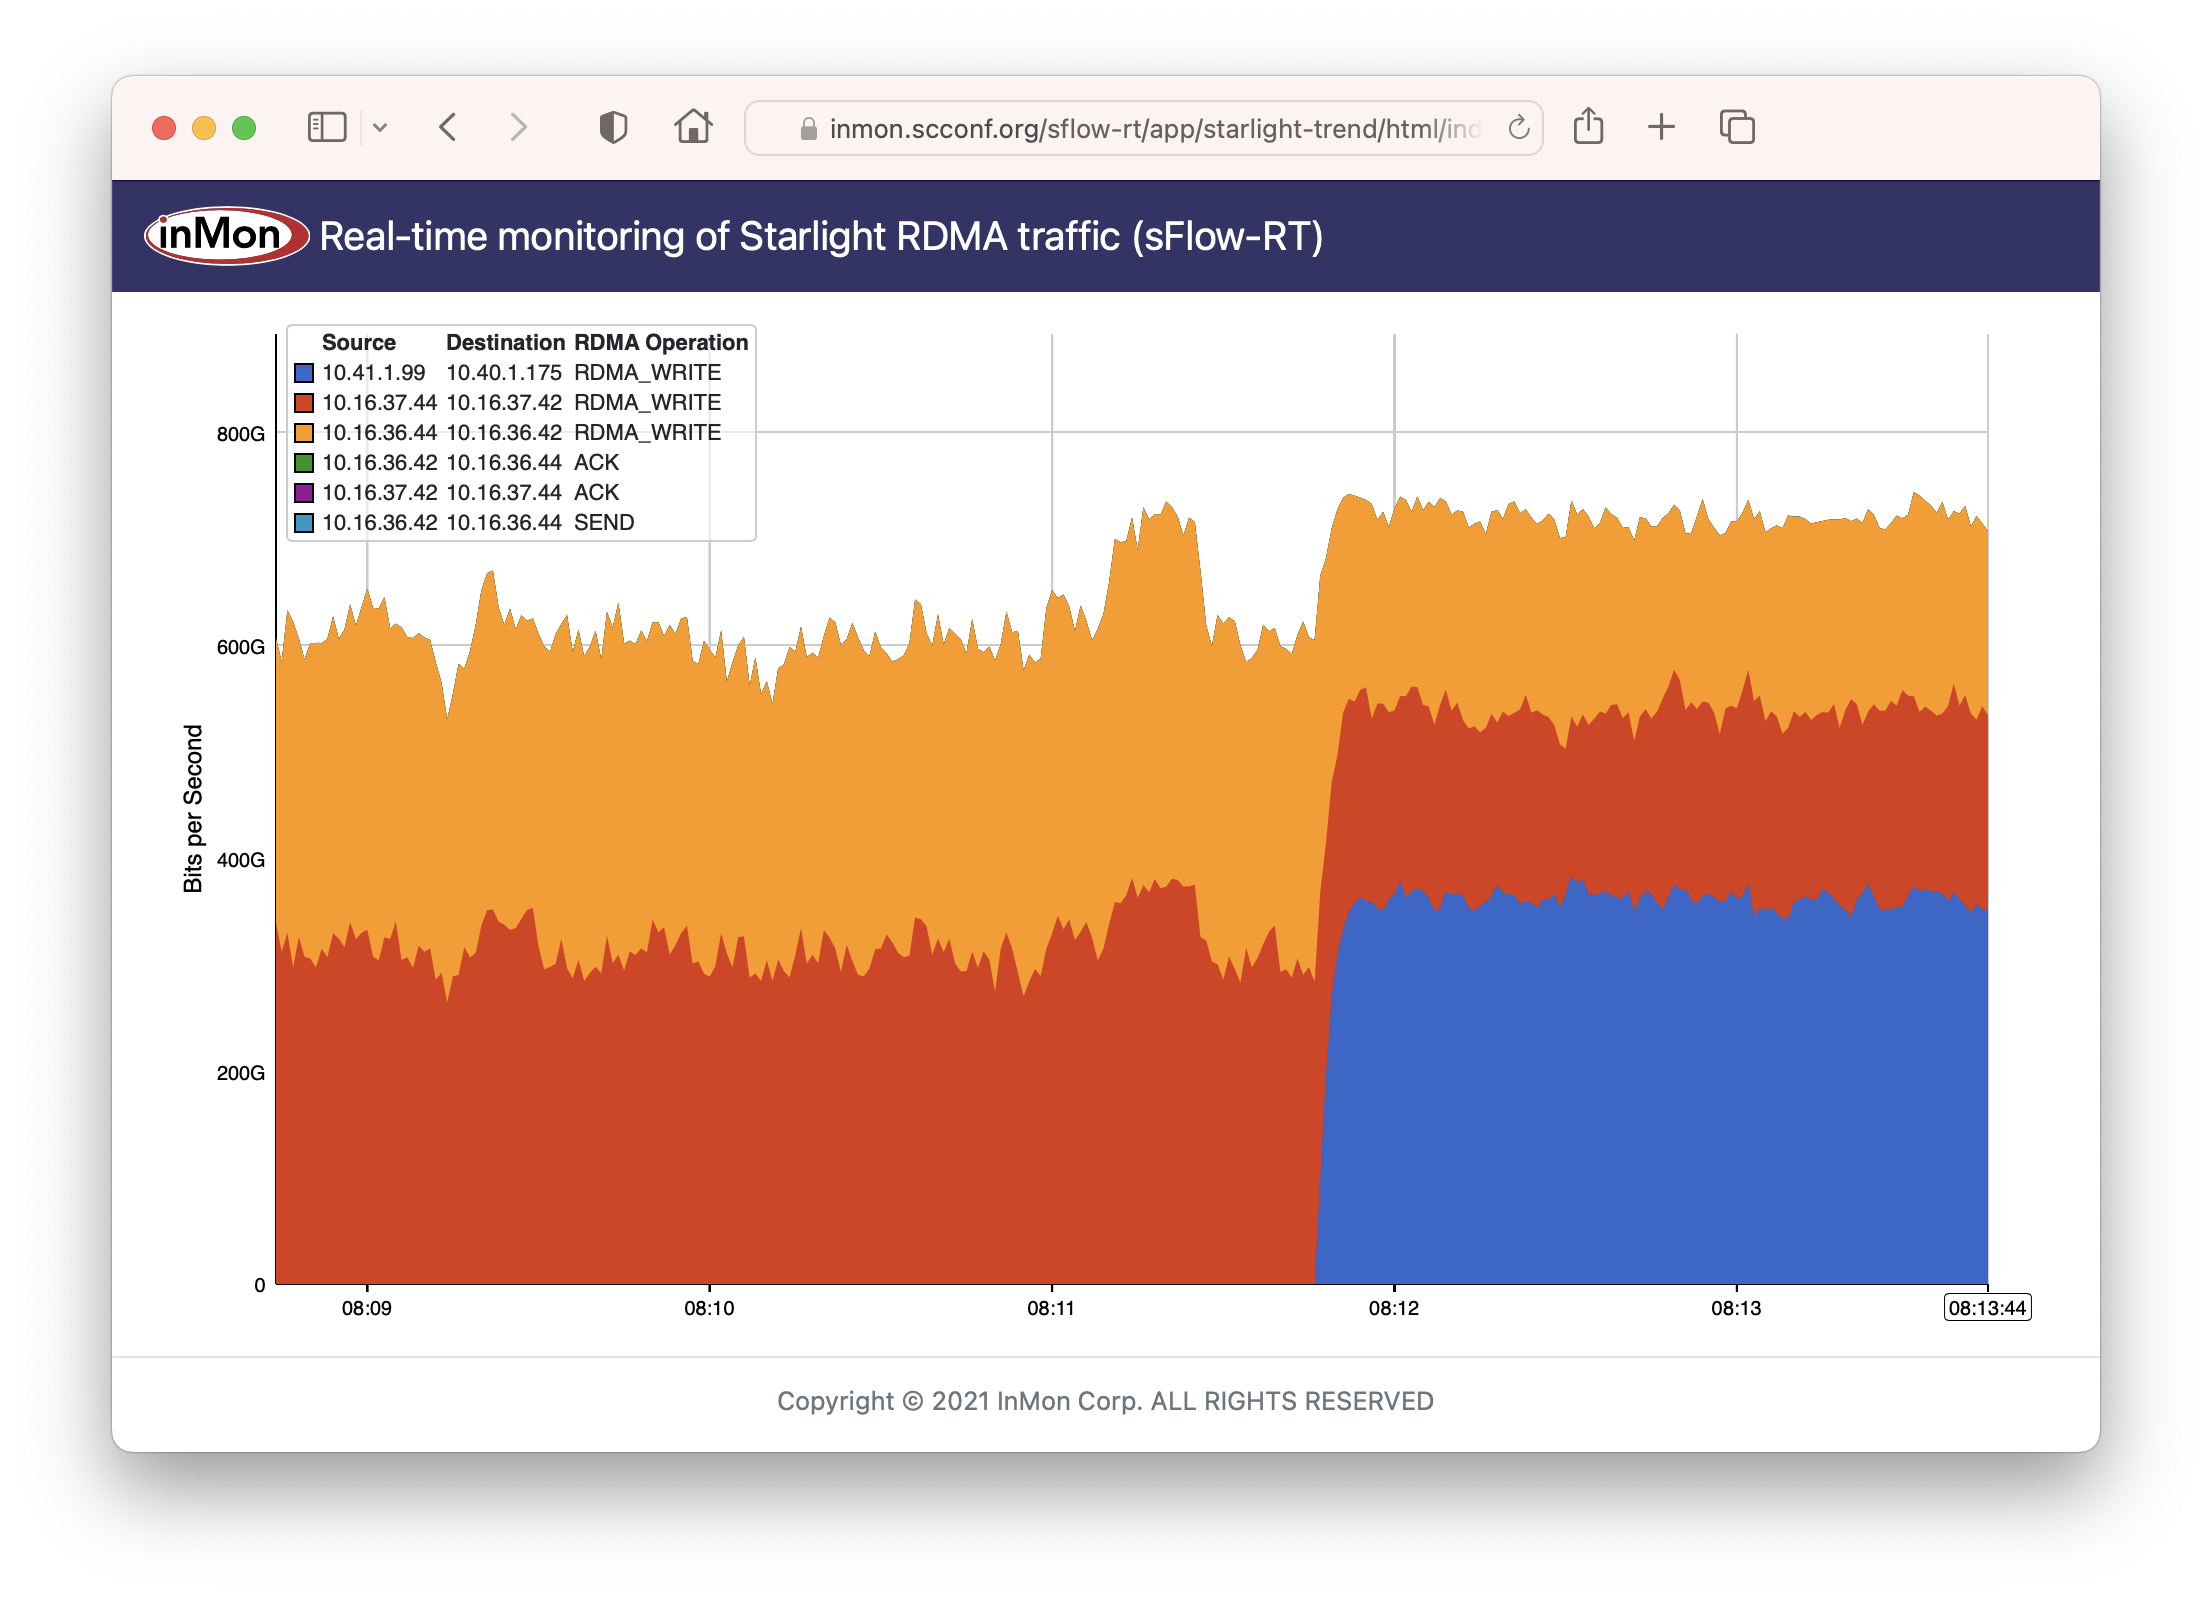


Scientific network tags (scitags) is an initiative promoting identification of the science domains and their high-level activities at the network level. Participants include, dCache, ESnet, GÉANT, Internet2, Jisc, NORDUnet, OFTS, OSG, RNP, RUCIO, StarLight, XRootD.

This article will demonstrate how industry standard sFlow telemetry streaming from switches and routers can be used to report on science domain activity in real-time using the sFlow-RT analytics engine.

The scitags initiative makes use of the IPv6 packet header to mark traffic. Experiment and activity identifiers are encoded in the IPv6 Flow label field. Identifiers are published in an online registry in the form of a JSON document, https://www.scitags.org/api.json.
One might expect IPFIX / NetFlow to be a Continue reading

Sonification presents data as sounds instead of visual charts. One of the best known examples of sonification is the representation of radiation level as a click rate in a Geiger counter. This article describes ddos-sonify, an experiment to see if sound can be usefully employed to represent information about Distributed Denial of Service (DDoS) attacks. The DDoS attacks and BGP Flowspec responses testbed was used to create the video demonstration at the top of this page in which a series of simulated DDoS attacks are detected and mitigated. Play the video to hear the results.
The software uses the Tone.js library to control Web Audio sound generation functionality in a web browser.
var voices = {};
var loop;
var loopInterval = '4n';
$('#sonify').click(function() {
  if($(this).prop("checked")) {
    voices.synth = new Tone.PolySynth(Tone.Synth).toDestination();
    voices.metal = new Tone.PolySynth(Tone.MetalSynth).toDestination();
    voices.pluck = new Tone.PolySynth(Tone.PluckSynth).toDestination();
    voices.membrane = new Tone.PolySynth(Tone.MembraneSynth).toDestination();
    voices.am = new Tone.PolySynth(Tone.AMSynth).toDestination();
    voices.fm = new Tone.PolySynth(Tone.FMSynth).toDestination();
    voices.duo = new Tone.PolySynth(Tone.DuoSynth).toDestination();
    Tone.Transport.bpm.value=80;
    loop = new Tone.Loop((now) => {
      sonify(now);
    },loopInterval).start(0);
     Continue reading

This article describes how use the instrumentation built into ConnectX SmartNICs for data center wide network visibility. Real-time network telemetry for automation provides some background, giving an overview of the sFlow industry standard with an example of troubleshooting a high performance GPU compute cluster.
Linux as a network operating system describes how standard Linux APIs are used in NVIDIA Spectrum switches to monitor data center network performance. Linux Kernel Upstream Release Notes v5.19 describes recent driver enhancements for ConnectX SmartNICs that extend visibility to servers for end-to-end visibility into the performance of high performance distributed compute infrastructure.
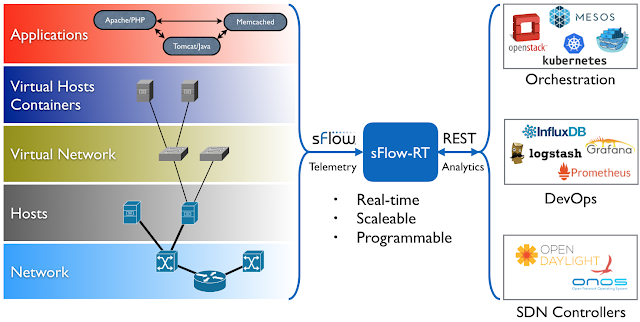
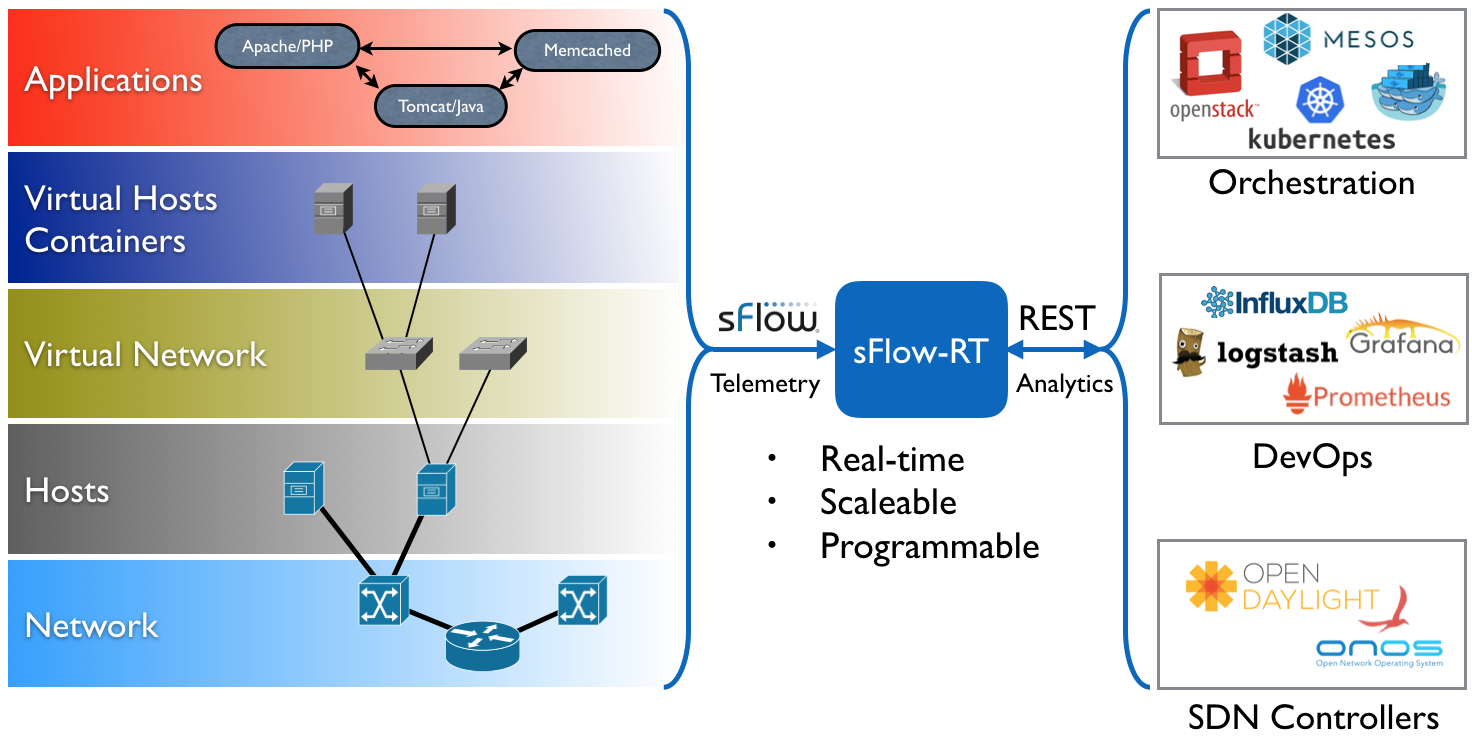
The open source Host sFlow agent uses standard Linux APIs to configure instrumentation in switches and hosts, streaming the resulting measurements to analytics software in real-time for comprehensive data center wide visibility.

psample { Continue reading

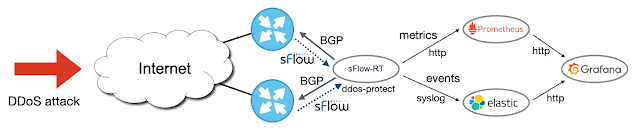
This article builds on the Docker testbed to demonstrate how advanced flow analytics can be used to separate the two types of traffic and detect the DDoS attack.
docker run --rm -d -e "COLLECTOR=host.docker.internal" -e "SAMPLING=100" \First, start a Host sFlow agent using the pre-built sflow/host-sflow image to generate the sFlow telemetry that would stream from the switches and routers in a production deployment.
--net=host -v /var/run/docker.sock:/var/run/docker.sock:ro \
--name=host-sflow sflow/host-sflow
setFlow('ddos_amplification', {
  keys:'ipdestination,udpsourceport',
  value: 'frames',
  values: ['count:ipsource']
});
setThreshold('ddos_amplification', {
  metric:'ddos_amplification',
  value: 10000,
  byFlow:true,
  timeout: 2
});
setEventHandler(function(event) {
  var [ipdestination,udpsourceport] = event.flowKey.split(',');
  var [sourcecount] = event.values;
   Continue reading

This article uses Containerlab to emulate a simple network and experiment with Nokia SR Linux and sFlow telemetry. Containerlab provides a convenient method of emulating network topologies and configurations before deploying into production on physical switches.
curl -O https://raw.githubusercontent.com/sflow-rt/containerlab/master/srlinux.yml
Download the Containerlab topology file.
containerlab deploy -t srlinux.yml
Deploy the topology.
docker exec -it clab-srlinux-h1 traceroute 172.16.2.2
Run traceroute on h1 to verify path to h2.
traceroute to 172.16.2.2 (172.16.2.2), 30 hops max, 46 byte packets
 1  172.16.1.1 (172.16.1.1)  2.234 ms  *  1.673 ms
 2  172.16.2.2 (172.16.2.2)  0.944 ms  0.253 ms  0.152 ms
Results show path to h2 (172.16.2.2) via router interface (172.16.1.1).
docker exec -it clab-srlinux-switch sr_cli
Access SR Linux command line on switch.
Using configuration file(s): []
Welcome to the srlinux CLI.
Type 'help' (and press <ENTER>) if you need any help using this.
--{ + running }--[  ]--
A:switch#
SR Linux CLI describes how to use the interface.
A:switch# show system sflow status
Get status of sFlow telemetry.
-------------------------------------------------------------------------
Admin State             Continue reading
Remote Triggered Black Hole Scenario describes how to use the Ixia-c traffic generator to simulate a DDoS flood attack. Ixia-c supports the Open Traffic Generator API that is used in the article to program two traffic flows: the first representing normal user traffic (shown in blue) and the second representing attack traffic (show in red).
The article goes on to demonstrate the use of remotely triggered black hole (RTBH) routing to automatically mitigate the simulated attack. The chart above shows traffic levels during two simulated attacks. The DDoS mitigation controller is disabled during the first attack. Enabling the controller for the second attack causes to attack traffic to be dropped the instant it crosses the threshold.

The diagram shows the Containerlab topology used in the Remote Triggered Black Hole Scenario lab (which can run on a laptop). The Ixia traffic generator's eth1 interface represents the Internet and its eth2 interface represents the Customer Network being attacked. Industry standard sFlow telemetry from the Customer router, ce-router, streams to the DDoS mitigation controller (running an instance of DDoS Protect). When the controller detects a denial of service attack it pushed a control via BGP to the ce-router, Continue reading

docker run --rm -it --privileged --network host --pid="host" \Start Containerlab.
-v /var/run/docker.sock:/var/run/docker.sock -v /run/netns:/run/netns \
-v ~/clab:/home/clab -w /home/clab \
ghcr.io/srl-labs/clab bash
curl -O https://raw.githubusercontent.com/sflow-rt/containerlab/master/ddos.ymlDownload the Containerlab topology file.
sed -i "s/\\.ip_flood\\.action=filter/\\.ip_flood\\.action=drop/g" ddos.ymlChange mitigation policy for IP Flood attacks from Flowspec filter to RTBH.
containerlab deploy -t ddos.ymlDeploy the topology.
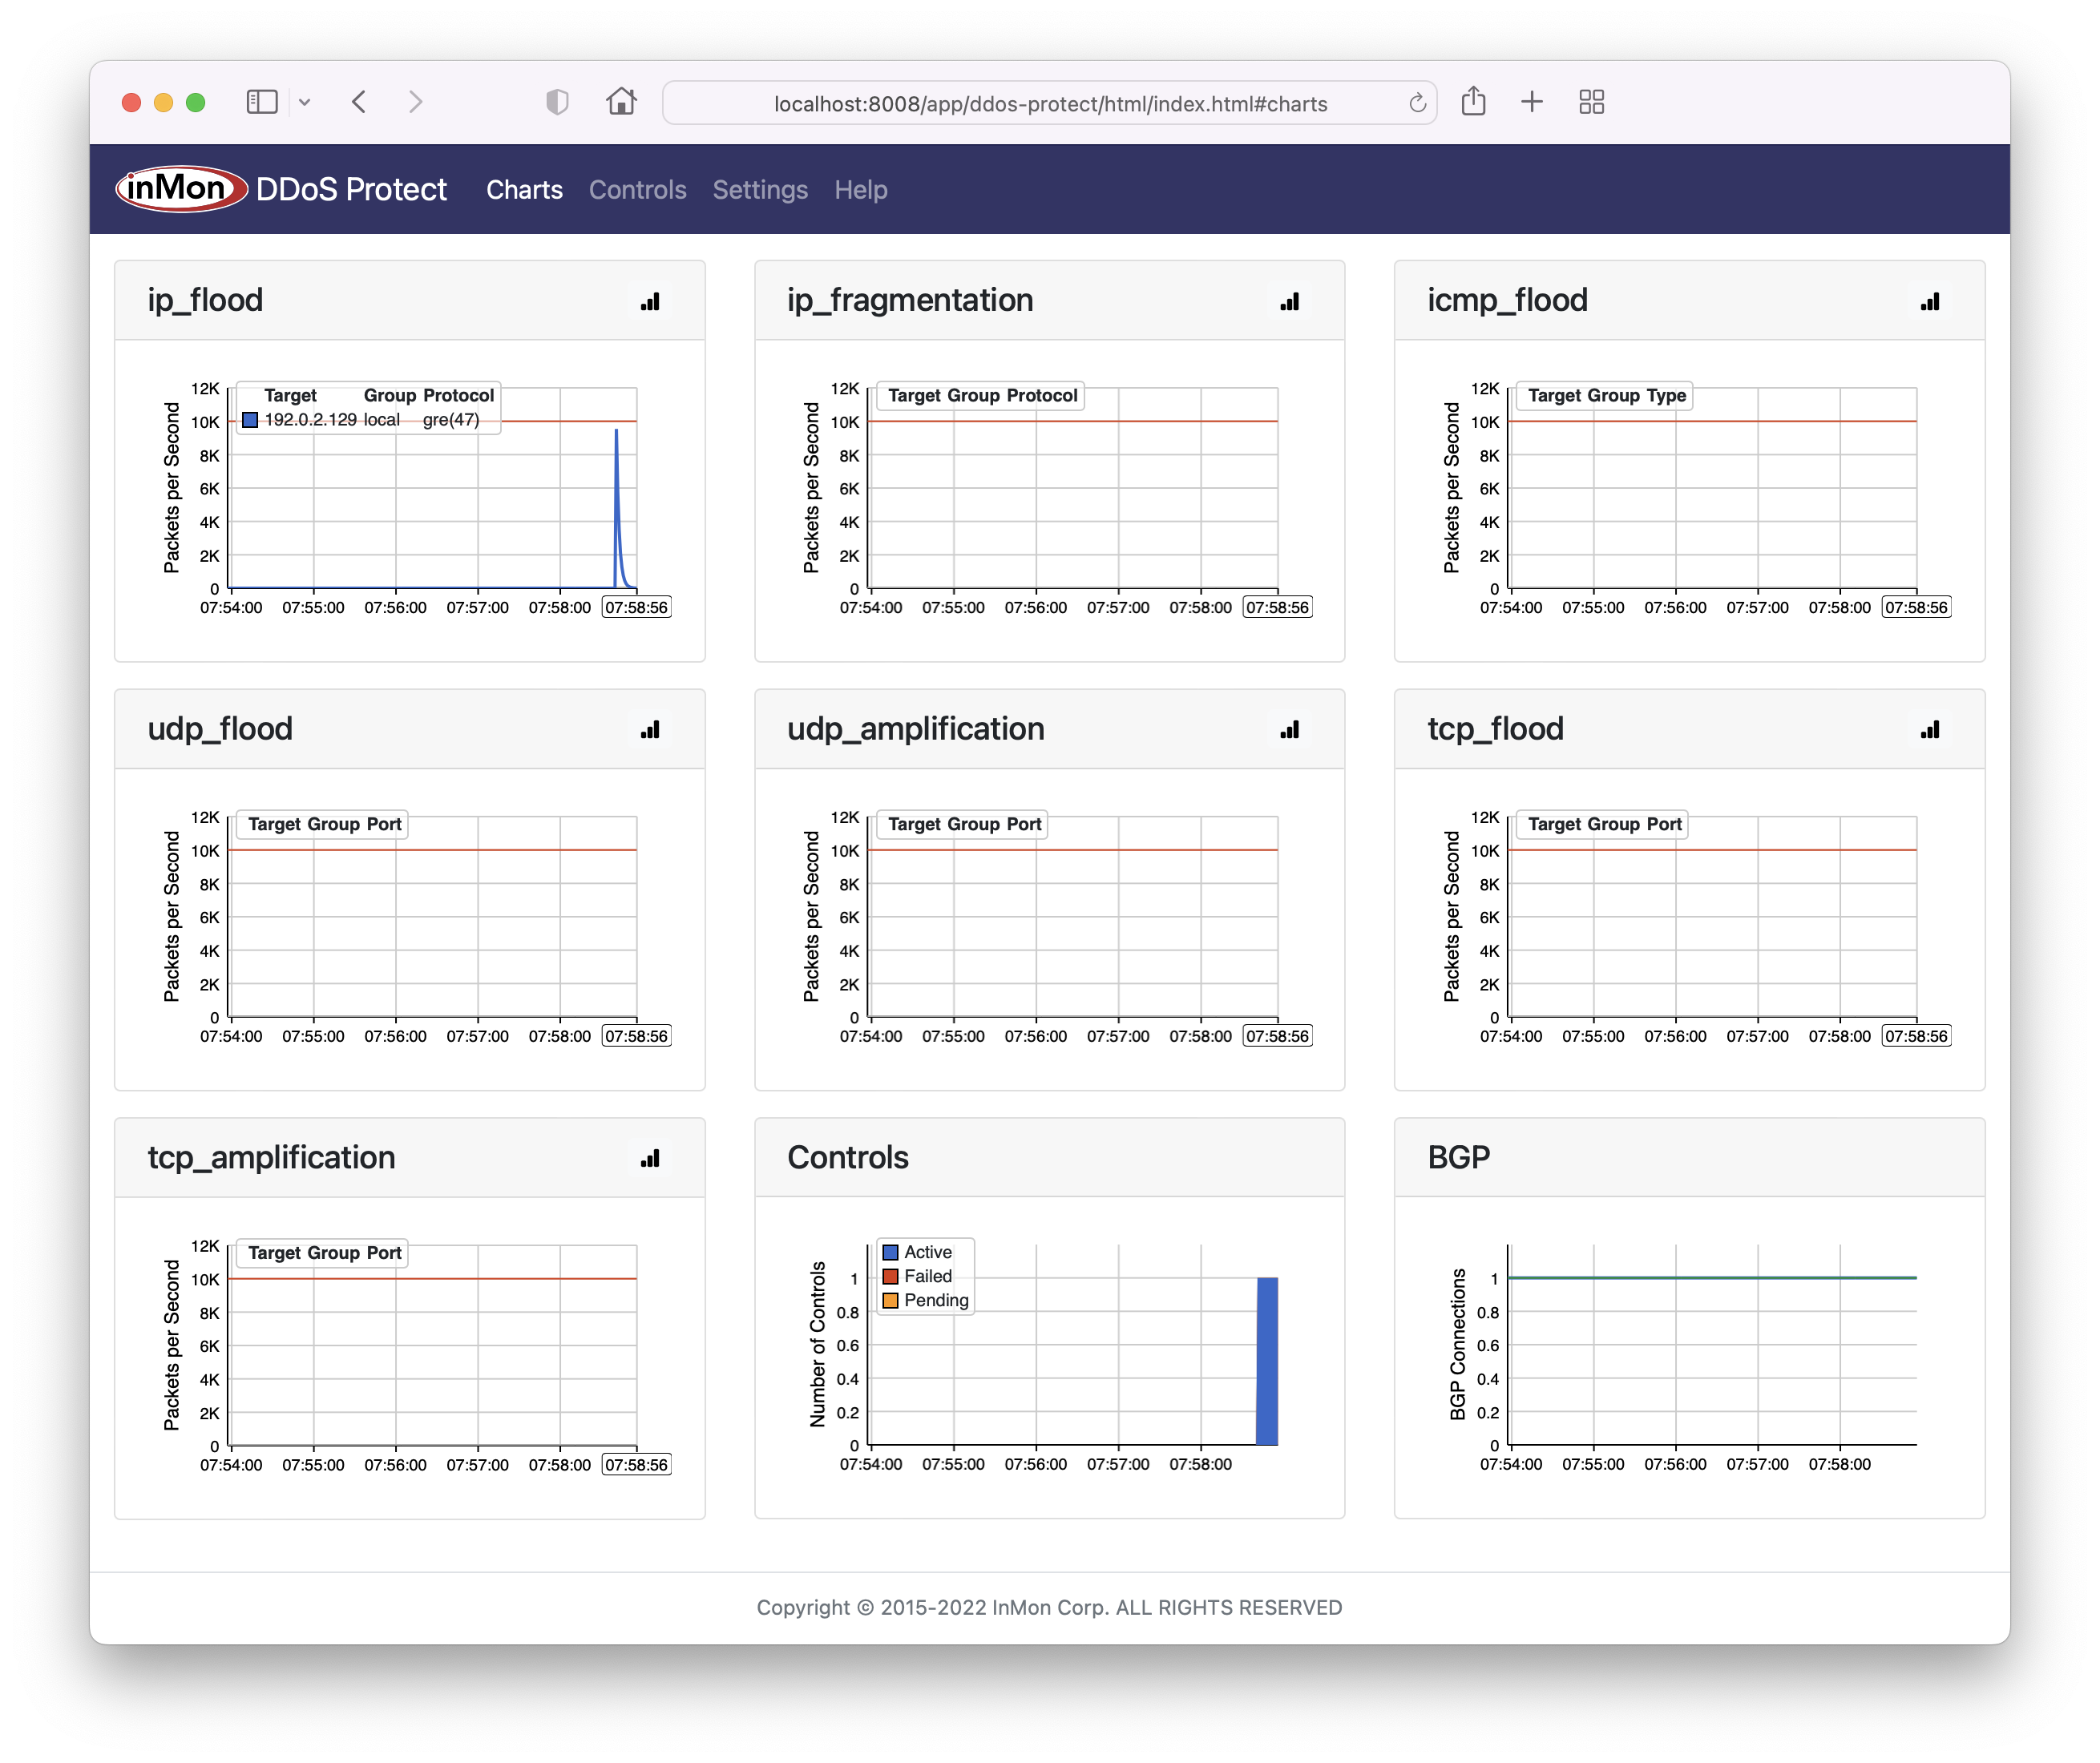
docker exec -it clab-ddos-attacker hping3 \Launch an IP Flood attack. The DDoS Protect dashboard shows that as soon as the ip_flood attack traffic reaches the threshold a control is implemented and the attack traffic is immediately dropped. The entire process between the attack being launched, detected, and mitigated happens within a second, ensuring minimal impact on network capacity and services.
--flood --rawip -H 47 192.0.2.129
docker exec -it clab-ddos-sp-router vtysh -c "show running-config"See Continue reading
Note: Most routers also support Cisco Netflow/IPFIX. Rapidly detecting large flows, sFlow vs. NetFlow/IPFIX describes why you should choose sFlow if you are interested in real-time monitoring and control applications.DDoS mitigation is a popular use case for sFlow telemetry in routers. The combination of sFlow for real-time DDoS detection with BGP RTBH / Flowspec mitigation on routing platforms makes for a compelling solution.

This article describes how to use the Containerlab DDoS testbed to simulate variety of flood attacks and observe the automated mitigation action designed to eliminate the attack traffic.
docker run --rm -it --privileged --network host --pid="host" \Start Containerlab.
-v /var/run/docker.sock:/var/run/docker.sock -v /run/netns:/run/netns \
-v ~/clab:/home/clab -w /home/clab \
ghcr.io/srl-labs/clab bash
curl -O https://raw.githubusercontent.com/sflow-rt/containerlab/master/ddos.ymlDownload the Containerlab topology file.
containerlab deploy -t ddos.ymlDeploy the topology and access the DDoS Protect screen at http://localhost:8008/app/ddos-protect/html/.
docker exec -it clab-ddos-sp-router vtysh -c "show bgp ipv4 flowspec detail"
At any time, run the command above to see the BGP Flowspec rules installed on the sp-router. Simulate the volumetric attacks using hping3.
Note: While the hping3 --rand-source option to generate packets with random source addresses would create a more authentic DDoS attack simulation, the option is not used in these examples because the victims responses to the attack packets (ICMP Port Unreachable) will be sent back to the random addresses and may leak out of the Containerlab test network. Instead varying source / destination ports are used to create entropy in the attacks.
When you are finished trying the examples below, run the following command Continue reading

docker run --rm -it --privileged --network host --pid="host" \Start Containerlab.
-v /var/run/docker.sock:/var/run/docker.sock -v /run/netns:/run/netns \
-v ~/clab:/home/clab -w /home/clab \
ghcr.io/srl-labs/clab bash
curl -O https://raw.githubusercontent.com/sflow-rt/containerlab/master/ddos.ymlDownload the Containerlab topology file.
containerlab deploy -t ddos.ymlFinally, deploy the topology.


docker exec -it clab-ddos-attacker hping3 --flood --udp -k -s 53 192.0.2.129Start a simulated DNS amplification attack using hping3.


docker run --rm -it --privileged --network host --pid="host" \Start Containerlab.
-v /var/run/docker.sock:/var/run/docker.sock -v /run/netns:/run/netns \
-v ~/clab:/home/clab -w /home/clab \
ghcr.io/srl-labs/clab bash
curl -O https://raw.githubusercontent.com/sflow-rt/containerlab/master/evpn3.ymlDownload the Containerlab topology file.
containerlab deploy -t evpn3.ymlFinally, deploy the topology.
docker exec -it clab-evpn3-leaf1 vtysh -c "show running-config"See configuration of leaf1 switch.
Building configuration...The loopback address on the switch, 192.168.1.1/32, is advertised to neighbors so that the VxLAN tunnel endpoint Continue reading
Current configuration:
!
frr version 8.1_git
frr defaults datacenter
hostname leaf1
no ipv6 forwarding
log stdout
!
router bgp 65001
bgp bestpath as-path multipath-relax
bgp bestpath compare-routerid
neighbor fabric peer-group
neighbor fabric remote-as external
neighbor fabric description Internal Fabric Network
neighbor fabric capability extended-nexthop
neighbor eth1 interface peer-group fabric
neighbor eth2 interface peer-group fabric
!
address-family ipv4 unicast
network 192.168.1.1/32
exit-address-family
!
address-family l2vpn evpn
neighbor fabric activate
advertise-all-vni
exit-address-family
exit
!
ip nht resolve-via-default
!
end
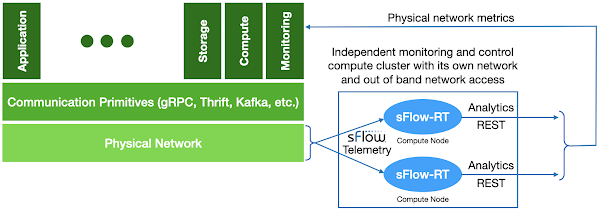
This article offers a response, describing how to introduce an uncorrelated monitor-of-monitors into the data center to provide real-time visibility that survives when the primary monitoring systems fail.
Summary of the AWS Service Event in the Northern Virginia (US-EAST-1) Region, This congestion immediately impacted the availability of real-time monitoring data for our internal operations teams, which impaired their ability to find the source of congestion and resolve it. December 10th, 2021
Standardizing on a small set of communication primitives (gRPC, Thrift, Kafka, etc.) simplifies the creation of large scale distributed services. The communication primitives abstract the physical network to provide reliable communication to support distributed services running on compute nodes. Monitoring is typically regarded as a distributed service that is part of the compute infrastructure, relying on agents on compute nodes to transmit measurements to scale out analysis, storage, automation, and Continue reading
DDoS protection quickstart guide shows how sFlow streaming telemetry and BGP RTBH/Flowspec are combined by the DDoS Protect application running on the sFlow-RT real-time analytics engine to automatically detect and block DDoS attacks.
This article discusses how to deploy the solution in a Cisco environment. Cisco has a long history of supporting BGP Flowspec on their routing platforms and has recently added support for sFlow, see Cisco 8000 Series routers, Cisco ASR 9000 Series Routers, and Cisco NCS 5500 Series Routers.
First, IOS-XR doesn't provide a way to connect to the non-standard BGP port (1179) that sFlow-RT uses by default. Allowing sFlow-RT to open the standard BGP port (179) requires that the service be given additional Linux capabilities.
docker run --rm --net=host --sysctl net.ipv4.ip_unprivileged_port_start=0 \
sflow/ddos-protect -Dbgp.port=179
The above command launches the prebuilt sflow/ddos-protect Docker image. Alternatively, if sFlow-RT has been installed as a deb / rpm package, then the required permissions can be added to the service.
sudo systemctl edit sflow-rt.service
Type the above command to edit the service configuration and add the following lines:
[Service]
AmbientCapabilities=CAP_NET_BIND_SERVICE
Next, edit the sFlow-RT configuration file for the DDoS Protect application:
sudo vi /usr/local/sflow-rt/conf.d/ddos-protect.conf

docker run --rm -it --privileged --network host --pid="host" \Start Containerlab.
-v /var/run/docker.sock:/var/run/docker.sock -v /run/netns:/run/netns \
-v ~/clab:/home/clab -w /home/clab \
ghcr.io/srl-labs/clab bash
curl -O https://raw.githubusercontent.com/sflow-rt/containerlab/master/clos5.ymlDownload the Containerlab topology file.
sed -i "s/prometheus/topology/g" clos5.ymlChange the sFlow-RT image from sflow/prometheus to sflow/topology in the Containerlab topology. The sflow/topology image packages sFlow-RT with useful applications that combine topology awareness with analytics.
containerlab deploy -t clos5.ymlDeploy the topology.
curl -O https://raw.githubusercontent.com/sflow-rt/containerlab/master/clos5.jsonDownload the sFlow-RT topology file.
curl -X PUT -H "Content-Type: application/json" -d @clos5.json \Post the topology to sFlow-RT.
http://localhost:8008/topology/json

docker exec -it clab-clos5-h1 iperf3 -c 172.16.4.2Generate traffic. You should see the Nodes No Flows number drop Continue reading

docker run --rm -it --privileged --network host --pid="host" \Run the above command to start Containerlab if you already have Docker installed; the ~/clab directory will be created to persist settings. Otherwise, Installation provides detailed instructions for a variety of platforms.
-v /var/run/docker.sock:/var/run/docker.sock -v /run/netns:/run/netns \
-v ~/clab:/home/clab -w /home/clab \
ghcr.io/srl-labs/clab bash
curl -O https://raw.githubusercontent.com/sflow-rt/containerlab/master/clos5.ymlNext, download the topology file for the 5 stage Clos fabric shown at the top of this article.
containerlab deploy -t clos5.ymlFinally, deploy the topology.
Note: The 3 stage Clos topology, clos3.yml, described in the previous article is also available.The initial launch may take a couple of minutes as the container images are downloaded for the first time. Once the images are downloaded, the topology deploys in around 10 seconds.


Summary of the AWS Service Event in the Northern Virginia (US-EAST-1) Region, "This congestion immediately impacted the availability of real-time monitoring data for our internal operations teams, which impaired their ability to find the source of congestion and resolve it." December 10th, 2021
The data in these charts was created using Mininet to simulate packet loss in a simple network. If you are interested in replicating these results, Multipass describes how to run Mininet on your laptop.
sudo mn --link tc,loss=5
For example, the above command simulates a simple network consisting of two hosts connected by a switch. A packet loss rate of 5% is configured for each link.
Simple Python scripts running on the simulated hosts were used to simulate transfer of network telemetry.
#! Continue reading

Cisco already supports industry standard sFlow telemetry across a range of products and the recent IOS-XR Release 7.5.1 extends support to Cisco NCS 5500 series routers.
Note: The NCS 5500 series routers also support Cisco Netflow. Rapidly detecting large flows, sFlow vs. NetFlow/IPFIX describes why you should choose sFlow if you are interested in real-time monitoring and control applications.
flow exporter-map SF-EXP-MAP-1
 version sflow v5
 !
 packet-length 1468
 transport udp 6343
 source GigabitEthernet0/0/0/1
 destination 192.127.0.1
 dfbit set
!
Configure the sFlow analyzer address in an exporter-map.
flow monitor-map SF-MON-MAP
 record sflow
 sflow options
  extended-router
  extended-gateway
  if-counters polling-interval 300
  input ifindex physical
  output ifindex physical
 !
 exporter SF-EXP-MAP-1
!
Configure sFlow options in a monitor-map.
sampler-map SF-SAMP-MAP
 random 1 out-of 20000
!
Define the sampling rate in a sampler-map.
interface GigabitEthernet0/0/0/3
 flow datalinkframesection monitor-map SF-MON-MAP sampler SF-SAMP-MAP ingress
Enable sFlow on each interface for complete visibilty into network traffic.
The diagram shows the general architecture of an sFlow monitoring deployment. All the switches stream sFlow telemetry to a central sFlow analyzer Continue reading
Cisco already supports industry standard sFlow telemetry across a range of products and the recent IOS-XR Release 7.5.1 extends support to Cisco ASR 9000 Series Routers.
Note: The ASR 9000 series routers also support Cisco Netflow. Rapidly detecting large flows, sFlow vs. NetFlow/IPFIX describes why you should choose sFlow if you are interested in real-time monitoring and control applications.
The following commands configure an ASR 9000 series router to sample packets at 1-in-20,000 and stream telemetry to an sFlow analyzer (192.127.0.1) on UDP port 6343.
flow exporter-map SF-EXP-MAP-1
 version sflow v5
 !
 packet-length 1468
 transport udp 6343
 source GigabitEthernet0/0/0/1
 destination 192.127.0.1
 dfbit set
!
Configure the sFlow analyzer address in an exporter-map.
flow monitor-map SF-MON-MAP
 record sflow
 sflow options
  extended-router
  extended-gateway
  if-counters polling-interval 300
  input ifindex physical
  output ifindex physical
 !
 exporter SF-EXP-MAP-1
!
Configure sFlow options in a monitor-map.
sampler-map SF-SAMP-MAP
 random 1 out-of 20000
!
Define the sampling rate in a sampler-map.
interface GigabitEthernet0/0/0/3
 flow datalinkframesection monitor-map SF-MON-MAP sampler SF-SAMP-MAP ingress
Enable sFlow on each interface for complete visibilty into network traffic.
The diagram shows the general architecture of an sFlow monitoring deployment. All the switches stream sFlow telemetry to a central sFlow analyzer for network Continue reading
