Author Archives: Peter
Author Archives: Peter


sflow sample 16384
sflow polling-interval 30
sflow extension bgp
sflow destination 10.0.0.70
sflow run
docker run --rm -d -e "COLLECTOR=host.docker.internal" -e "SAMPLING=10" \Continue reading
--net=host -v /var/run/docker.sock:/var/run/docker.sock:ro \
--name=host-sflow sflow/host-sflow
docker run --rm -d -e "COLLECTOR=host.docker.internal" -e "SAMPLING=10" \
--net=host -v /var/run/docker.sock:/var/run/docker.sock:ro \
--name=host-sflow sflow/host-sflow
docker run --rm sflow/exabgp
GW=`docker network inspect bridge -f '{{range .IPAM.Config}}{{.Gateway}}{{end}}'`

SUBNET=`docker network inspect bridge -f '{{range .IPAM.Config}}{{.Subnet}}{{end}}'`

docker run --rm -p 6343:6343/udp -p 8008:8008 -p 1179:1179 --name=sflow-rt \
sflow/ddos-protect -Dddos_protect.router=$GW -Dddos_protect.as=65001 \
-Dddos_protect.enable.flowspec=yes -Dddos_protect.group.local=$SUBNET \
-Dddos_protect.mode=automatic \
-Dddos_protect.udp_amplification.action=filter \
-Dddos_protect.udp_amplification.threshold=5000
Open the sFlow-RT dashboard at http://localhost:8008/
Broadcom BroadView+ Root Cause Analysis with Mirror-on-Drop (MOD) and Inband Flow Analyzer (IFA) from Gestalt IT on Vimeo.


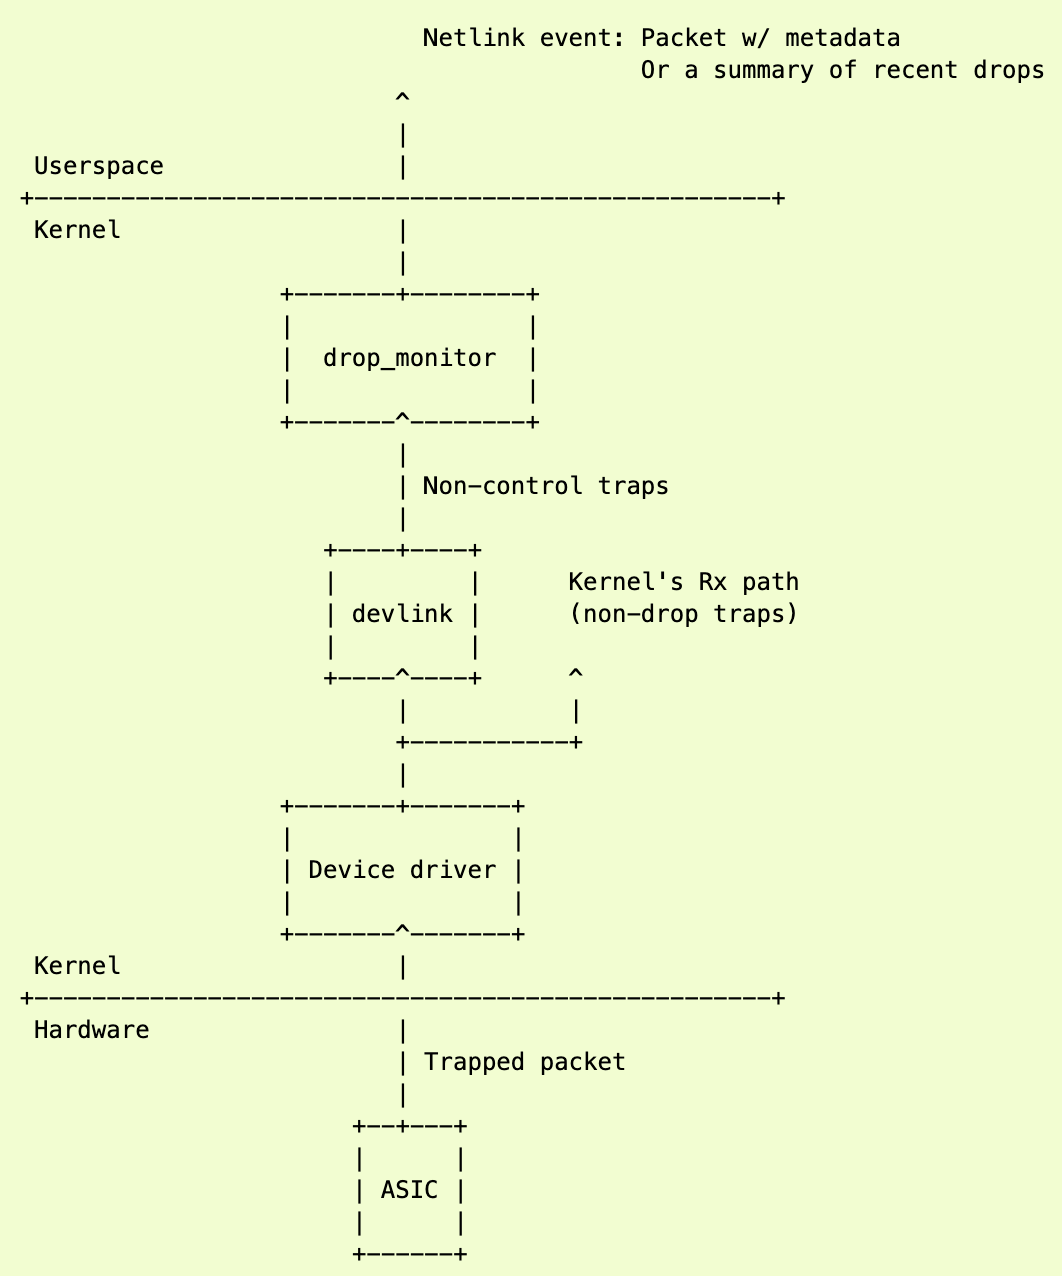
pp@ubuntu20:~$ sudo dropwatch
Initializing null lookup method
dropwatch> set alertmode packet
Setting alert mode
Alert mode successfully set
dropwatch> start
Enabling monitoring...
Kernel monitoring activated.
Issue Ctrl-C to stop monitoring
drop at: __udp4_lib_rcv+0xae5/0xbb0 (0xffffffffb05ead95)
origin: software
input port ifindex: 2
timestamp: Wed Jul 15 23:57:36 2020 223253465 nsec
protocol: 0x800
length: 128
original  Continue reading
curl -O https://raw.githubusercontent.com/sflow-rt/fabric-view/master/demo/ecmp.pcapFirst, download the captured sFlow data.
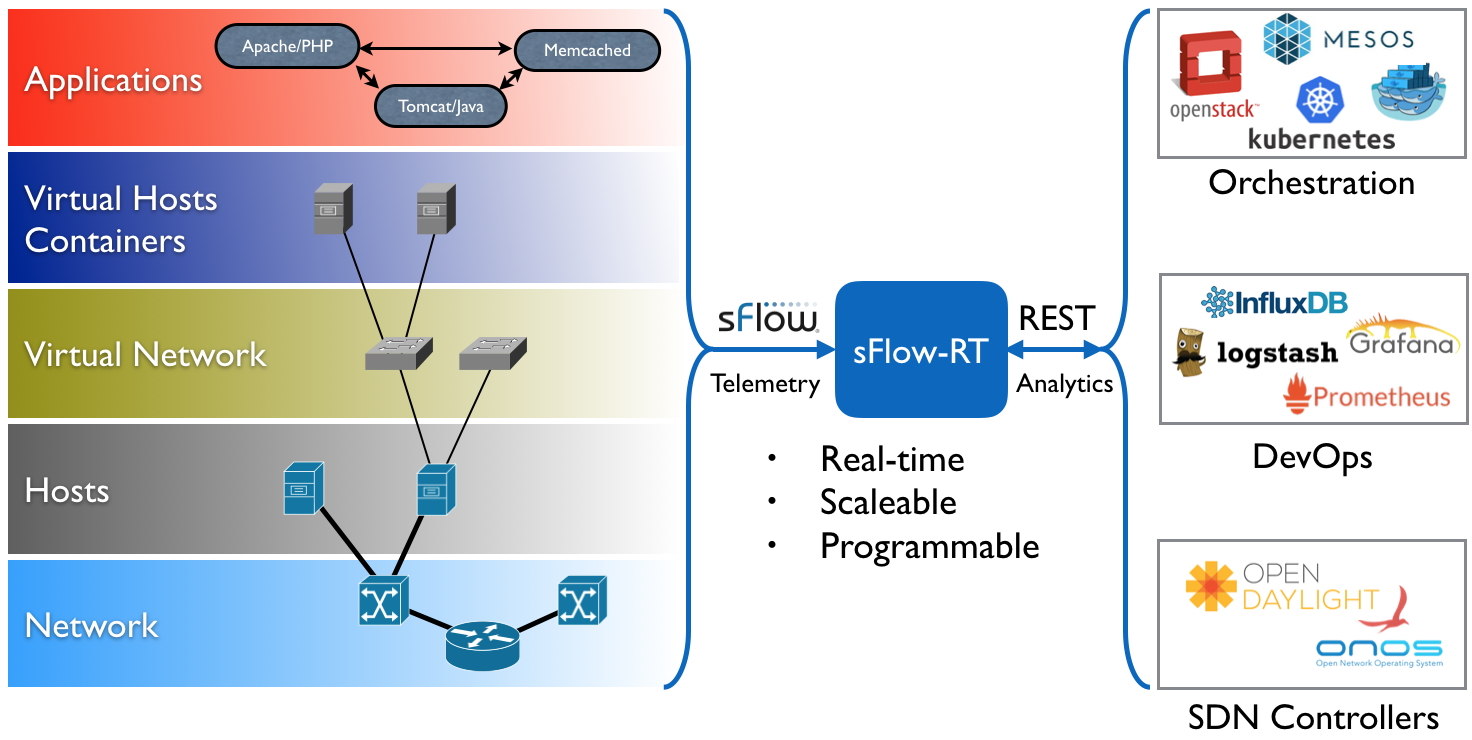
curl -O https://inmon.com/products/sFlow-RT/sflow-rt.tar.gzThe above commands download and run sFlow-RT, with browse-metrics, browse-flows, and prometheus applications on a system with Java 1.8+ installed.
tar -xzf sflow-rt.tar.gz
./sflow-rt/get-app.sh sflow-rt browse-metrics
./sflow-rt/get-app.sh sflow-rt browse-flows
./sflow-rt/get-app.sh sflow-rt prometheus
./sflow-rt/start.sh -Dsflow.file=$PWD/ecmp.pcap
docker Continue reading


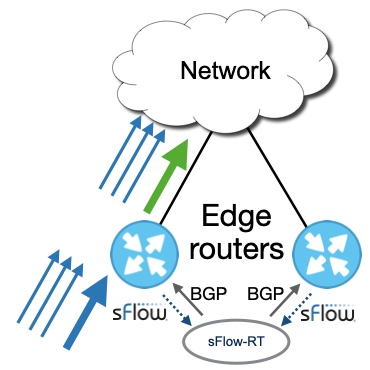
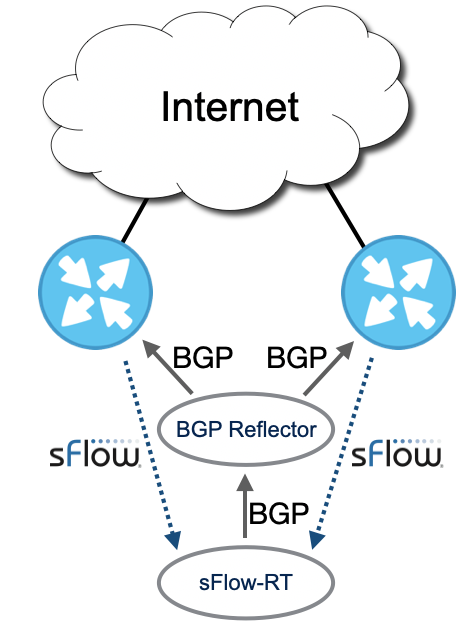
ddos_protect.router=10.0.0.96,10.0.0.97Configuring multiple BGP connections is simple, the ddos_protect.router configuration option has been extended to accept a comma separated list of IP addresses for the routers that will be connecting to the controller.


apiVersion: v1Run the Continue reading
kind: Service
metadata:
name: sflow-rt-sflow
spec:
type: NodePort
selector:
name: sflow-rt
ports:
- protocol: UDP
port: 6343
---
apiVersion: v1
kind: Service
metadata:
name: sflow-rt-rest
spec:
type: LoadBalancer
selector:
name: sflow-rt
ports:
- protocol: TCP
port: 8008
---
apiVersion: apps/v1
kind: Deployment
metadata:
name: sflow-rt
spec:
replicas: 1
selector:
matchLabels:
name: sflow-rt
template:
metadata:
labels:
name: sflow-rt
spec:
containers:
- name: sflow-rt
image: sflow/prometheus:latest
ports:
- name: http
protocol: TCP
containerPort: 8008
- name: sflow
protocol: UDP
containerPort: 6343

wget https://github.com/sflow/host-sflow/releases/download/v2.0.25-3/hsflowd-ubuntu18_2.0.25-3_amd64.debThe above commands download and install the software.
sudo dpkg -i hsflowd-ubuntu18_2.0.25-3_amd64.deb
sudo systemctl enable hsflowd
sflow {
  collector { ip=10.0.0.30 }
  pcap { speed=1G-1T }
  tcp { }
  systemd { }
}
Edit the /etc/hsflowd.conf file. The above example sends sFlow to a collector at 10.0.0.30, enables packet sampling on all network adapters, adds TCP performance information, and exports metrics for Linux services. See Configuring Host sFlow for Linux for the complete set of configuration options.sudo systemctl restart hsflowdRestart the Host sFlow daemon to start streaming telemetry to Continue reading
docker run --rm -d -e "COLLECTOR=host.docker.internal" -e "SAMPLING=10" \Note: Host, Docker, Swarm and Kubernetes monitoring describes how to deploy Host sFlow agents to monitor large scale container environments.
--net=host -v /var/run/docker.sock:/var/run/docker.sock:ro \
--name=host-sflow sflow/host-sflow
docker run --rm -d -p 5201:5201 --name iperf3 sflow/iperf3 -sIn a separate terminal window, run the following command to start sFlow-RT:
Continue reading