QUIC

An easy way to see if you have any QUIC traffic on your network is to use the standard sFlow instrumentation built into network switches. Configure the switches to send sFlow telemetry to an sFlow collector for visibility into network traffic.
For example, use Docker to run the sFlow-RT active-flows application to analyze the sFlow data stream:
docker run -p 6343:6343/udp -p 8008:8008 -d sflow/top-flowsAccess the web interface at http://localhost:8008/ and enter the following Flow Specification to monitor QUICK flows:
dns:ipsource,dns:ipdestination,quicpackettypeNote: Real-time domain name lookups describes how sFlow-RT incorporates DNS (Domain Name Service) requests in its real-time analytics pipeline so that traffic flows can be identified by domain name.

Telegraf, InfluxDB, Chronograf, and Kapacitor
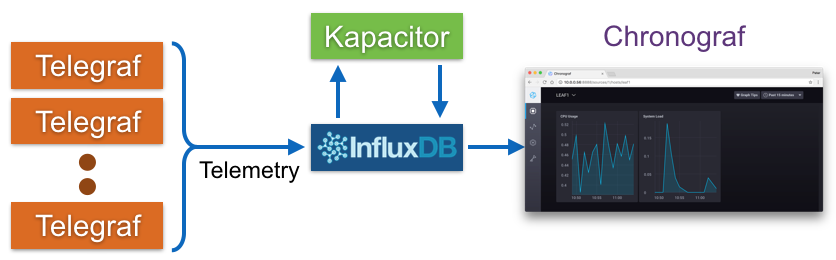
The following telegraf.js script instructs sFlow-RT to periodically export host metrics to InfluxDB:
var influxdb = "http://10.0.0.56:8086/write?db=telegraf";

function sendToInfluxDB(msg) {
  if(!msg || !msg.length) return;

  var req = {
    url:influxdb,
    operation:'POST',
    headers:{"Content-Type":"text/plain"},
    body:msg.join('\n')
  };
  req.error = function(e) {
    logWarning('InfluxDB POST failed, error=' + e);
  }
  try { httpAsync(req); }
  catch(e) {
    logWarning('bad request ' + req.url + ' ' + e);
  }
}

var metric_names = [
   Continue reading
Using Ganglia to monitor Linux services

Monitoring Linux services
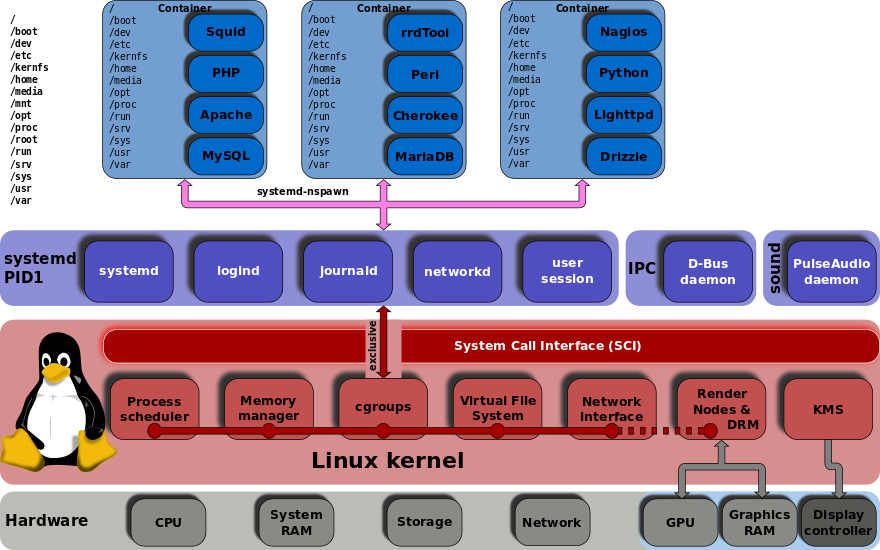
This article describes how to use the open source Host sFlow agent to gather telemetry from daemons running under systemd.
Host sFlow systemd monitoring exports a standard set of metrics for each systemd service - the sFlow Host Structures extension defines metrics for Virtual Nodes (virtual machines, containers, etc.) that are used to export Xen, KVM, Docker, and Java resource usage. Exporting the standard metrics for systemd services provides interoperability with sFlow analyzers, allowing them to report on Linux services using existing virtual node monitoring capabilities.
While running daemons within containers helps systemd maintain control of the resources, it also provides a very useful abstraction for monitoring. For example, a single service (like the Apache web server) may consist of dozens of processes. Reporting on container level metrics abstracts away the per-process details and gives a view of the total resources consumed by the service. In addition, service metadata (like the service name) provides a useful way of identifying and grouping Continue reading
IPv6 Internet router using merchant silicon
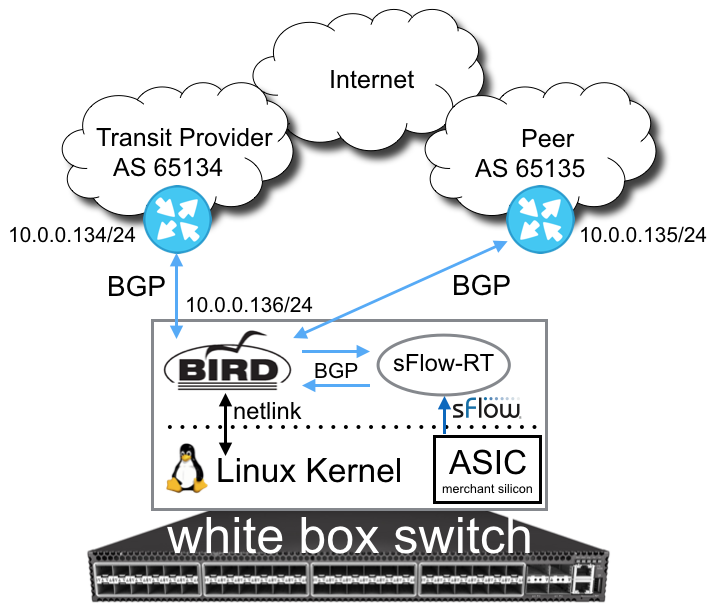
The article describes a simple self contained solution that uses standard APIs and should be able to run on a variety of Linux based network operating systems, including: Cumulus Linux, Dell OS10, Arista EOS, and Cisco NX-OS.
The diagram shows the elements of the solution. Standard sFlow instrumentation embedded in the merchant silicon ASIC data plane in the white box switch provides real-time information on traffic flowing through the switch. The sFlow agent is configured to send the sFlow to an instance of sFlow-RT running on the switch. The Bird routing daemon is used to handle the BGP peering sessions and to install routes in the Linux kernel using the standard netlink interface. The network operating system in turn programs the switch ASIC with the kernel routes so that packets are forwarded by the switch hardware and not by the kernel software.
The key to this solution is Bird's multi-table capabilities. The full Internet Continue reading
Monitoring at Terabit speeds


From the SCinet web page, "The Fastest Network Connecting the Fastest Computers: SC16 will host the most powerful and advanced networks in the world – SCinet. Created each year for the conference, SCinet brings to life a very high-capacity network that supports the revolutionary applications and experiments that are a hallmark of the SC conference."
SC16 live real-time weathermaps provides additional demonstrations of high performance network monitoring.
SC16 live real-time weathermaps

From the SCinet web page, "The Fastest Network Connecting the Fastest Computers: SC16 will host the most powerful and advanced networks in the world – SCinet. Created each year for the conference, SCinet brings to life a very high-capacity network that supports the revolutionary applications and experiments that are a hallmark of the SC conference."
The real-time weathermap leverages industry standard sFlow instrumentation built into network switch and router hardware to provide scaleable monitoring of the SCinet network. Link colors are updated every second to reflect operational status and utilization of each link.
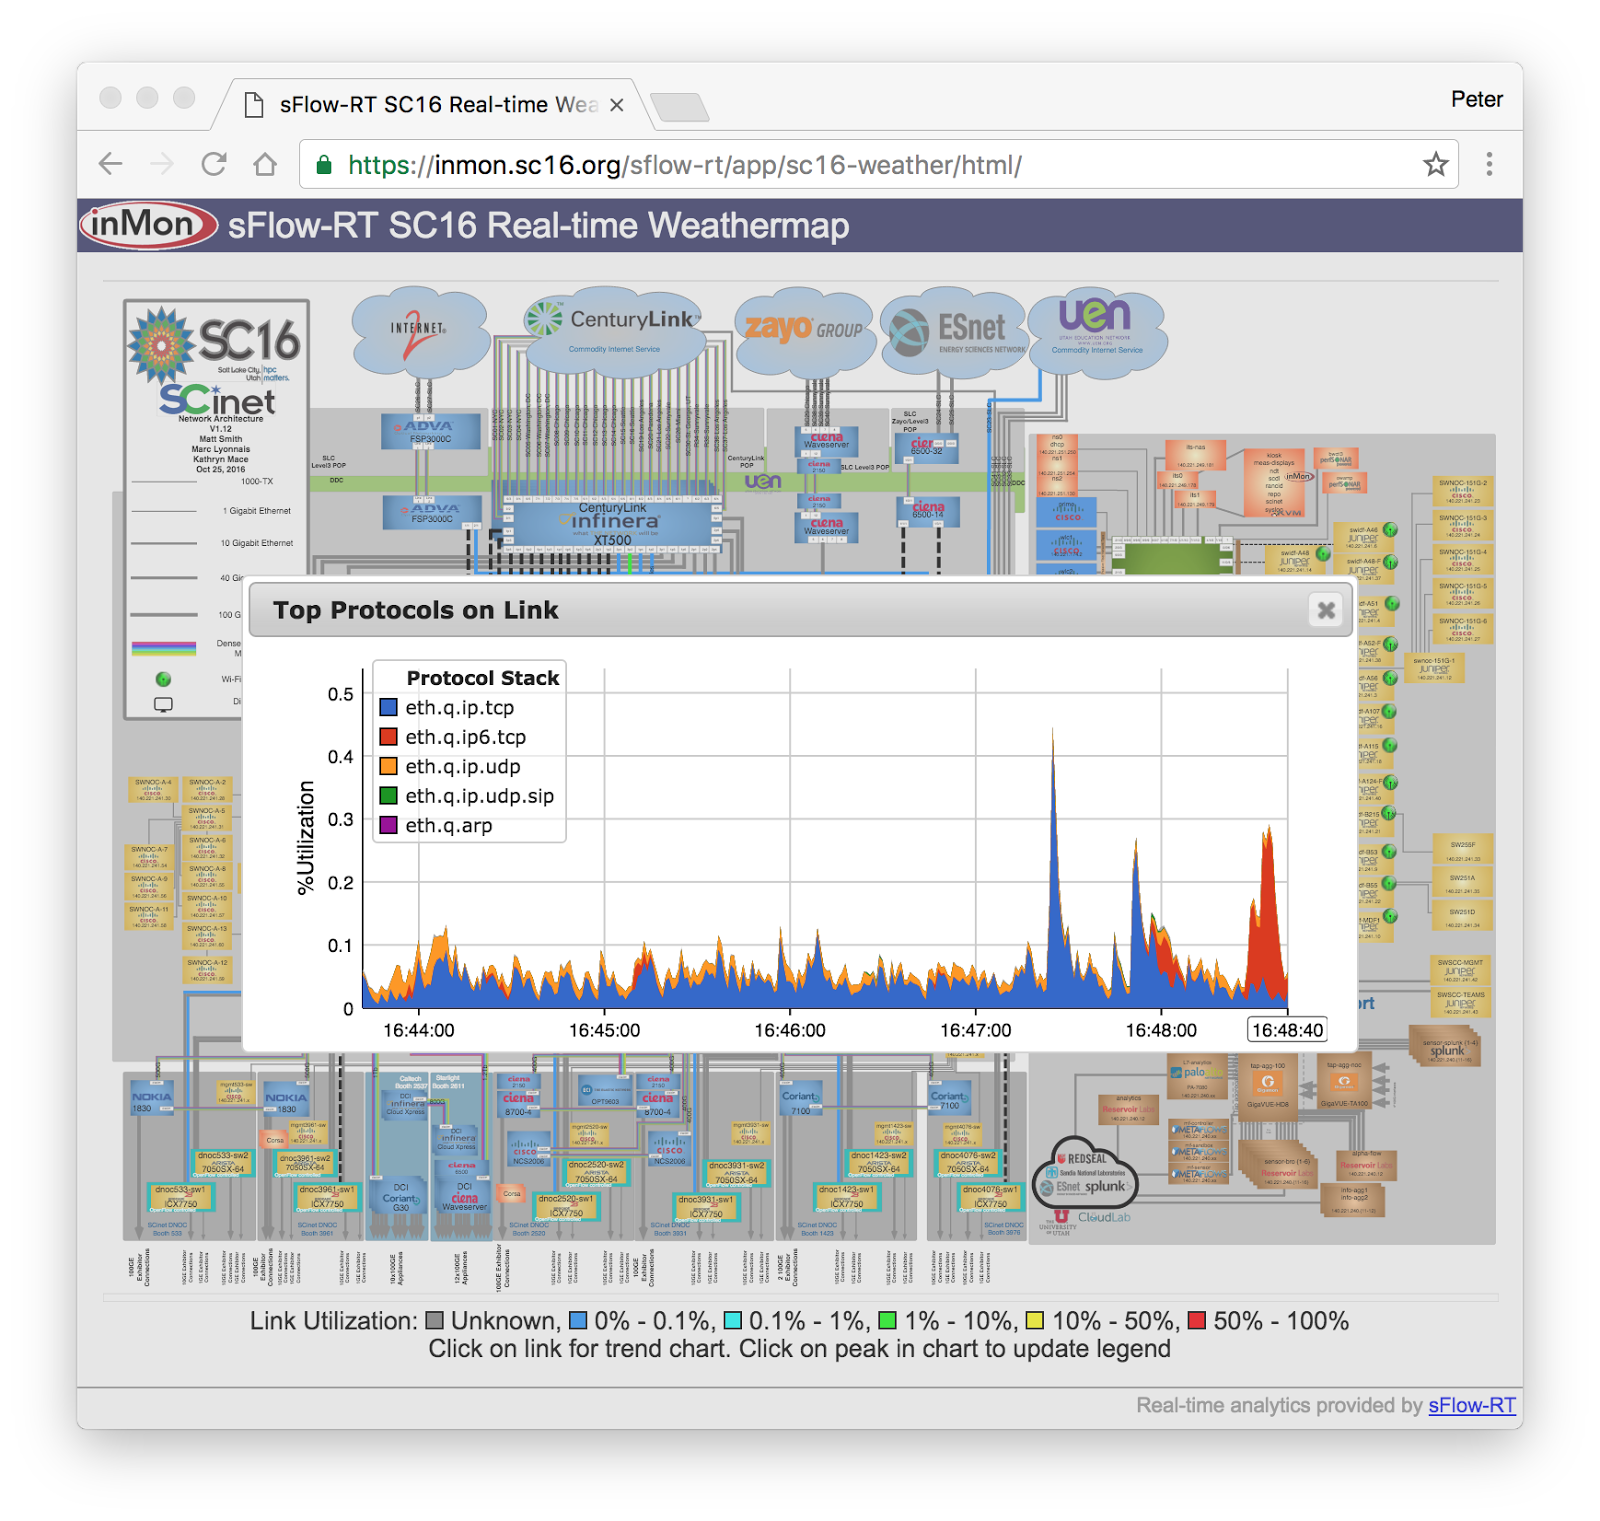
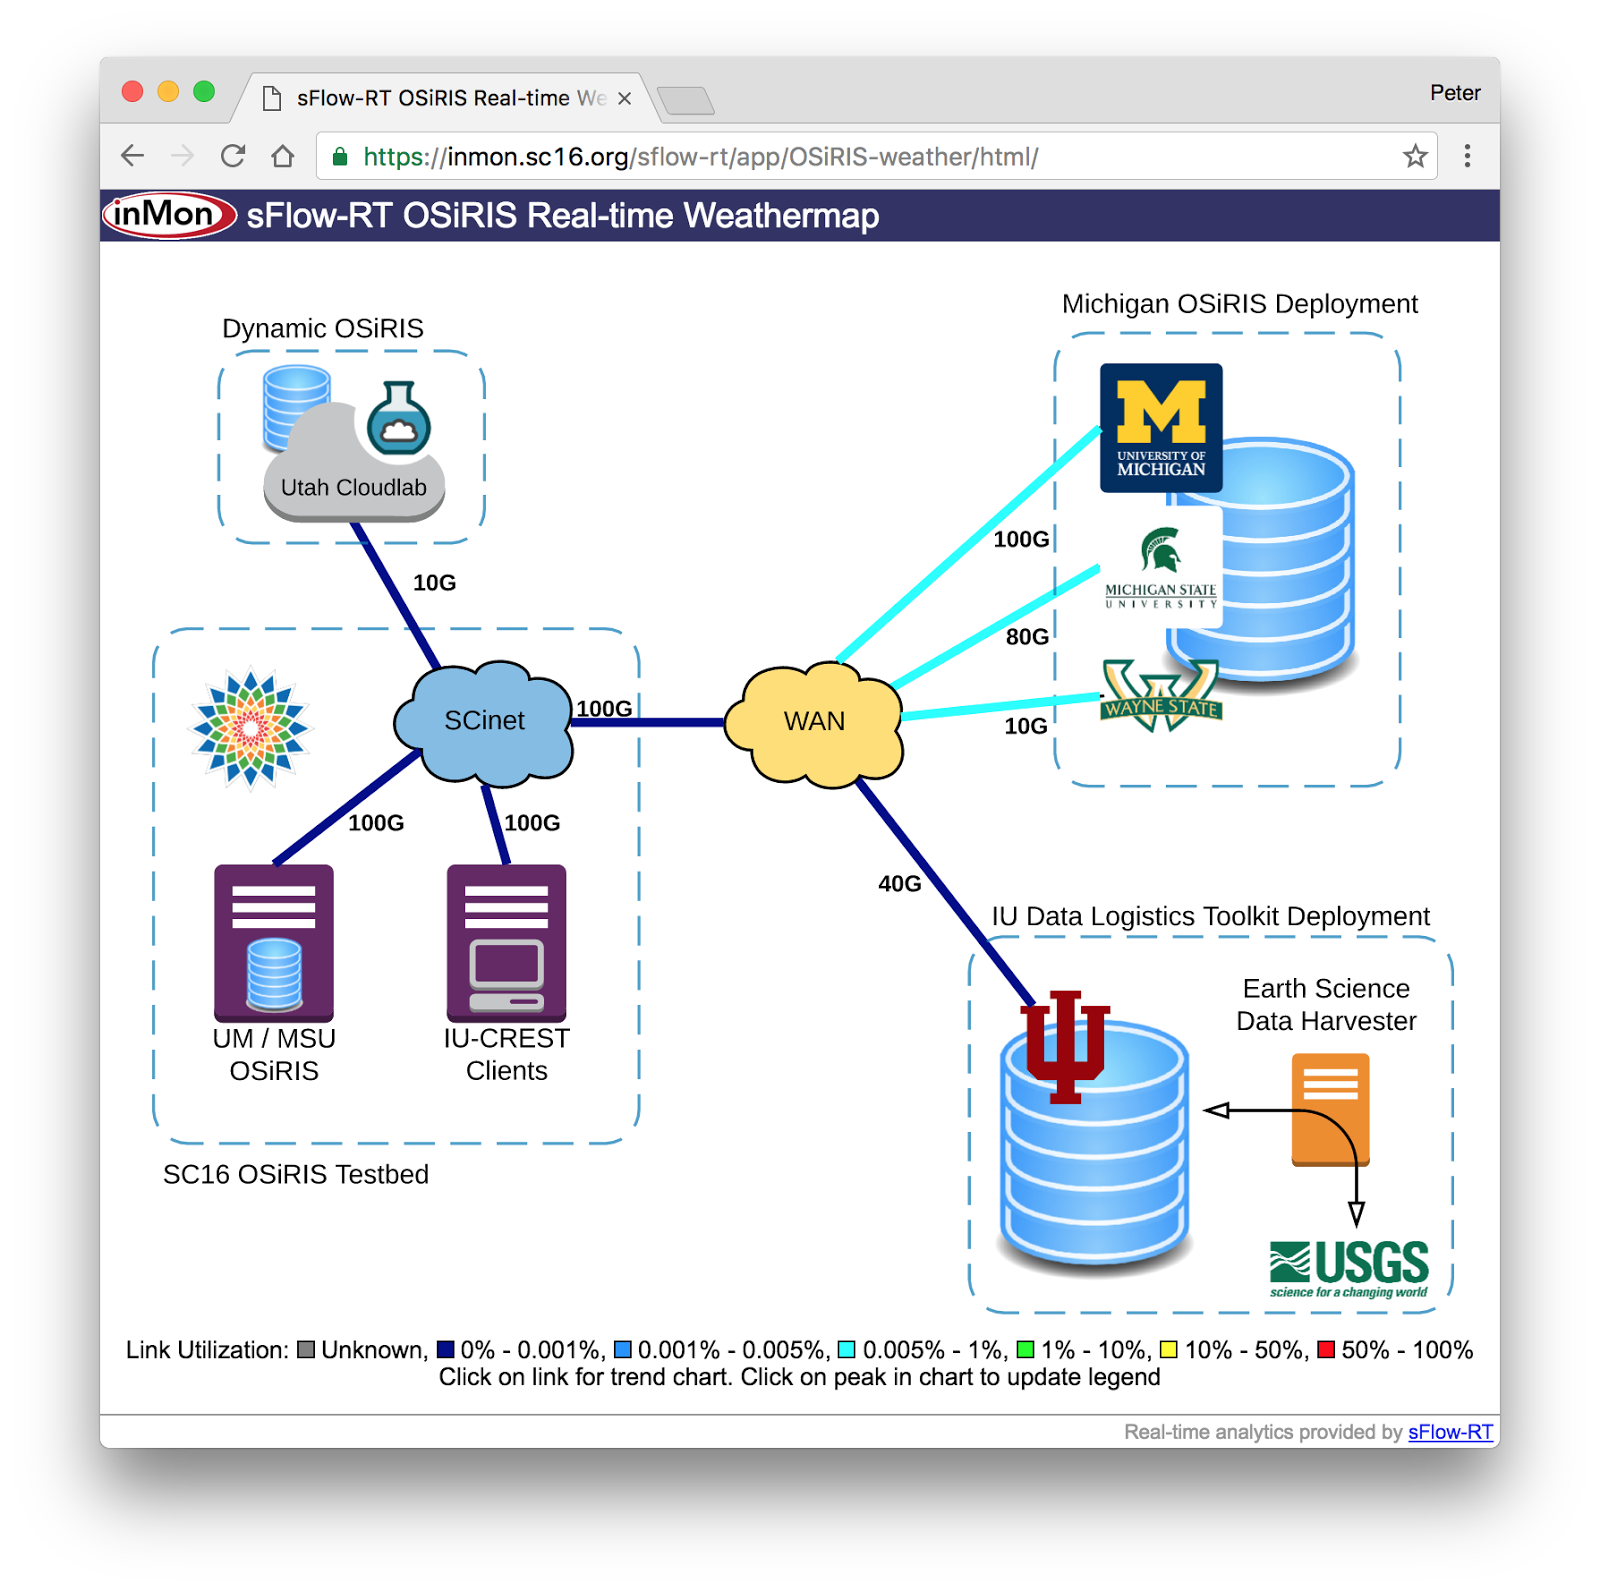
Connect to http://inmon.sc16.org/sflow-rt/app/OSiRIS-weather/html/ to see an animated diagram of the SC16 OSiRIS demonstration connecting SCinet with University of Michigan, Michigan State, Wayne Continue reading
Network performance monitoring

# tcpdump -ni eth0 tcpThe host TCP/IP stack continuously measured round trip time and estimates available bandwidth for each active connection as part of its normal operation. The tcpdump output shown above highlights timestamp information that is exchanged in TCP packets to provide the accurate round trip time measurements needed for reliable high speed data transfer.
11:29:28.949783 IP 10.0.0.162.ssh > 10.0.0.70.56174: Flags [P.], seq 1424968:1425312, ack 1081, win 218, options [nop,nop,TS val 2823262261 ecr 2337599335], length 344
11:29:28.950393 IP 10.0.0.70.56174 > 10.0.0.162.ssh: Flags [.], ack 1425312, win 4085, options [nop,nop,TS val 2337599335 ecr 2823262261], length 0
The open source Host sFlow agent already makes use of Berkeley Packet Filter (BPF) capability on Linux to efficiently sample packets and provide visibility into traffic flows. Adding support Continue reading
Real-time domain name lookups
First, use the dns.servers System Property is used to specify one or more DNS servers to handle the reverse lookup requests. For example, the following command uses Docker to run sFlow-RT with DNS lookups directed to server 10.0.0.1:
docker run -e "RTPROP=-Ddns.servers=10.0.0.1" \The following Python script dnspair.py uses the sFlow-RT REST API to define a flow and log the resulting flow records:
-p 8008:8008 -p 6343:6343/udp -d sflow/sflow-rt
#!/usr/bin/env pythonRunning the script generates the following output:
import requests
import json
flow = {'keys':'dns:ipsource,dns:ipdestination',
'value':'bytes','activeTimeout':10,'log':True}
requests.put('http://localhost:8008/flow/dnspair/json',data=json.dumps(flow))
flowurl = 'http://localhost:8008/flows/json?name=dnspair&maxFlows=10&timeout=60'
flowID = -1
while 1 == 1:
r = requests.get(flowurl + "&flowID=" + str(flowID))
if r.status_code != 200: break
flows = r.json()
if len(flows) == 0: continue
flowID = flows[0]["flowID"]
flows.reverse()
for f in flows:
print json.dumps(f,indent=1)
$ ./dnspair.py
{
 "value": 233370.92322668363,
 "end": 1476234478177,
 "name": "dnspair",
 "flowID":  Continue reading
Collecting Docker Swarm service metrics

In this example, Docker Swarm is used to deploy a simple web service on a four node cluster:
docker service create --replicas 2 -p 80:80 --name apache httpd:2.4Next, the following script tests the agility of monitoring systems by constantly changing the number of replicas in the service:
#!/bin/bashThe above test is easy to set up and is a quick way to stress test monitoring systems and reveal accuracy and performance problems when they are confronted with container workloads.
while true
do
docker service scale apache=$(( ( RANDOM % 20 ) + 1 ))
sleep 30
done
Many approaches to gathering and recording metrics were developed for static environments and have a great deal of difficulty tracking rapidly changing container-based service pools without missing information, leaking resources, and slowing down. For example, each new container in Docker Swarm has unique name, e.g. apache.16.17w67u9157wlri7trd854x6q0. Monitoring solutions that record container names, or even worse, index data by container name, will suffer from bloated Continue reading
Docker 1.12 swarm mode elastic load balancing
Docker Built-In Orchestration Ready For Production: Docker 1.12 Goes GA describes the native swarm mode feature that integrates cluster management, virtual networking, and policy based deployment of services.
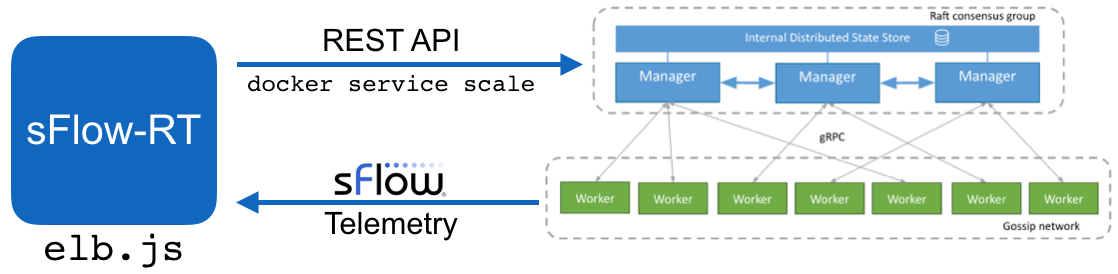
This article will demonstrate how real-time streaming telemetry can be used to construct an elastic load balancing solution that dynamically adjusts service capacity to match changing demand.
Getting started with swarm mode describes the steps to configure a swarm cluster. For example, following command issued on any of the Manager nodes deploys a web service on the cluster:
docker service create --replicas 2 -p 80:80 --name apache httpd:2.4And the following command raises the number of containers in the service pool from 2 to 4:
docker service scale apache=4Asynchronous Docker metrics describes how sFlow telemetry provides the real-time visibility required for elastic load balancing. The diagram shows how streaming telemetry allows the sFlow-RT controller to determine the load on the service pool so that it can use the Docker service API to automatically increase or decrease the size of the pool as demand changes. Elastic load balancing of the service pools ensures consistent service levels by adding additional resources if demand increases. In addition, efficiency is improved by releasing resources Continue reading
Asynchronous Docker metrics

This article describes how the latest version of the Host sFlow agent is able to track the performance of a rapidly changing population of Docker containers and export a real-time stream of standard sFlow metrics.

The diagram at the beginning of this article shows the sequence of messages, going from top to bottom, required to track a container. The Host sFlow agent first registers for container Continue reading
Triggered remote packet capture using filtered ERSPAN

Traditional hierarchical network designs were relatively straightforward to monitor using a packet broker since traffic flowed through a small number of core switches and so a small number of taps provided network wide visibility. The move to leaf and spine fabric architectures eliminates the performance bottleneck of core switches to deliver low latency and high bandwidth connectivity to data center applications. However, traditional packet brokers are less attractive since spreading traffic across many links with equal cost multi-path (ECMP) routing means that many more links need to be monitored.
This article will explore how the remote Selective Spanning capability in Cumulus Linux 3.0 combined with industry standard sFlow telemetry embedded in commodity switch hardware provides a cost effective alternative to traditional packet brokers.
Cumulus Linux uses iptables rules to specify packet capture sessions. For example, the following rule forwards packets with source IP 20.0.1.0 and destination IP 20.0.1.2 to a packet analyzer on host 20.0.2.2:
-A FORWARD --in-interface swp+ -s 20.0.0.2 -d 20. Continue reading
Real-time web analytics


The following sFlow-RT metrics report request rates based on the standard sFlow HTTP counters:
- http_method_option
- http_method_get
- http_method_head
- http_method_post
- http_method_put
- http_method_delete
- http_method_trace
- http_method_connect
- http_method_other
- http_status_1xx
- http_status_2xx
- http_status_3xx
- http_status_4xx
- http_status_5xx
- http_status_other
- http_requests
- workers_active
- workers_idle
- workers_max
- workers_utilization
- req_delayed
- req_dropped
http://localhost:8008/metric/ALL/sum:http_method_get,sum:http_method_post/jsonMore interesting is that the sFlow telemetry stream also includes randomly sampled HTTP request records with the following attributes:
- protocol
- serveraddress
- serveraddress6
- serverport
- clientaddress
- clientaddress6
- clientport
- proxyprotocol
- proxyserveraddress
- proxyserveraddress6
- proxyserverport
- proxyclientaddress
- proxyclientaddress6
- proxyclientport
- httpmethod
- httpprotocol
- httphost
- httpuseragent
- httpxff
- httpauthuser
- httpmimetype
- httpurl
- httpreferer
- httpstatus
- Continue reading
Network and system analytics as a Docker service
The sFlow-RT analytics software is now on Docker Hub, making it easy to deploy real-time sFlow analytics as a Docker service:
docker run -p 8008:8008 -p 6343:6343/udp -d sflow/sflow-rtConfigure standard sFlow Agents to stream telemetry to the analyzer and retrieve analytics using the REST API on port 8008.
Increase memory from default 1G to 2G:
docker run -e "RTMEM=2G" -p 8008:8008 -p 6343:6343/udp -d sflow/sflow-rtSet System Property to enable country lookups when Defining Flows:
docker run -e "RTPROP=-Dgeo.country=resources/config/GeoIP.dat" -p 8008:8008 -p 6343:6343/udp -d sflow/sflow-rtRun sFlow-RT Application. Drop the -d option while developing an application to see output of logging commands and use control-c to stop the container.
docker run -v /Users/pp/my-app:/sflow-rt/app/my-app -p 8008:8008 -p 6343:6343/udp -d sflow/sflow-rtA simple Dockerfile can be used to generate a new image that includes the application:
FROM sflow/sflow-rt:latestSimilarly, Continue reading
COPY /Users/pp/my-app /sflow-rt/app
Internet router using Cumulus Linux

First, add the Debian Jessie repository:
sudo sh -c 'echo "deb http://ftp.us.debian.org/debian jessie main contrib" > \Next, install Host sFlow, Java, and Bird:
/etc/apt/sources.list.d/deb.list'
sudo apt-get updateInstall sFlow-RT (the latest version is available at sFlow-RT.com):
sudo apt-get install hsflowd
sudo apt-get install unzip
sudo apt-get install default-jre-headless
sudo apt-get install bird
wget http://www.inmon.com/products/sFlow-RT/sflow-rt_2.0-1116.debIncrease the default virtual memory limit for sflowrt (needs to be greater than 1/3 amount of RAM on system to start Java virtual machine, see Giant Bug: Cannot run java with a virtual mem limit (ulimit -v)):
sudo dpkg -i sflow-rt_2.0-1116.deb
sudo sh -c 'echo "sflowrt soft as 2000000" > \Note: Maximum Java heap memory has a default of 1G and is controlled by settings in /usr/local/sflow-rt/conf.d/sflow-rt.jvm file.
/etc/security/limits.d/99-sflowrt.conf'
Install the Active Route Manager application:
sudo sh -c "/usr/local/sflow-rt/get-app. Continue reading
World map

Download and install sFlow-RT to run the world-map application. Enable the System Property, geo.country=resources/config/GeoIP.dat, to allow the application to identify countries based on IP addresses.
Internet router using merchant silicon

This article describes a simple self contained solution that uses standard APIs and should be able to run on a variety of Linux based network operating systems, including: Cumulus Linux, Dell OS10, Arista EOS, and Cisco NX-OS. The distinguishing feature of this solution is its real-time response, where previous solutions respond to changes in traffic within minutes or hours, this solution updates hardware routes within seconds.
The diagram shows the elements of the solution. Standard sFlow instrumentation embedded in the merchant silicon ASIC data plane in the white box switch provides real-time information on traffic flowing through the switch. The sFlow agent is configured to send the sFlow to an instance Continue reading
Network, host, and application monitoring for Amazon EC2

However, there are limitations on the types of traffic that are logged, a 10-15 minute delay in accessing flow records, and costs associated with using VPC and storing the logs in CloudWatch (currently $0.50 per GB ingested, $0.03 per GB archived per month, and possible addition Data Transfer OUT charges).
In addition, collecting basic host metrics at 1 minute granularity using CloudWatch is an additional $3.50 per instance per month.
The open source Host sFlow agent offers an alternative:
- Lightweight, requiring minimal CPU and memory on EC2 instances.
- Real-time, up to the second network visibility
- Efficient, export of extensive set of host metrics every 10-60 seconds (configurable).
$ cat /etc/issueThe following commands build the latest Continue reading
Amazon Linux AMI release 2016.03
Real-time BGP route analytics

- sFlow real-time traffic data identifies active BGP routes
- BGP path attributes are available in flow definitions
Setup
First download sFlow-RT. Next create a configuration file, bgp.js, in the sFlow-RT home directory with the following contents:var reflectorIP = '10.0.0.254';The following sFlow-RT System Properties load the configuration file and enable BGP:
var myAS = '65162';
var myID = '10.0.0.162';
var sFlowAgentIP = '10.0.0.253';
// allow BGP connection from reflectorIP
bgpAddNeighbor(reflectorIP,myAS,myID);
// direct sFlow from sFlowAgentIP to reflectorIP routing table
// calculate a 60 second moving average byte rate for each route
bgpAddSource(sFlowAgentIP,reflectorIP,60,'bytes');
- script.file=bgp.js
- bgp.start=yes
Continue reading