Configuring OpenSwitch
The following configuration enables sFlow monitoring of all interfaces on a white box switch running the OpenSwitch operating system, sampling packets at 1-in-4096, polling counters every 20 seconds and sending the sFlow to an analyzer (10.0.0.50) on UDP port 6343 (the default sFlow port):switch(config)# sflow collector 10.0.0.50A previous posting discussed the selection of sampling rates. Additional information can be found in the OpenSwitch sFlow User Guide.
switch(config)# sflow sampling 4096
switch(config)# sflow polling 20
switch(config)# sflow enable
See Trying out sFlow for suggestions on getting started with sFlow monitoring and reporting.
Cisco Tetration analytics
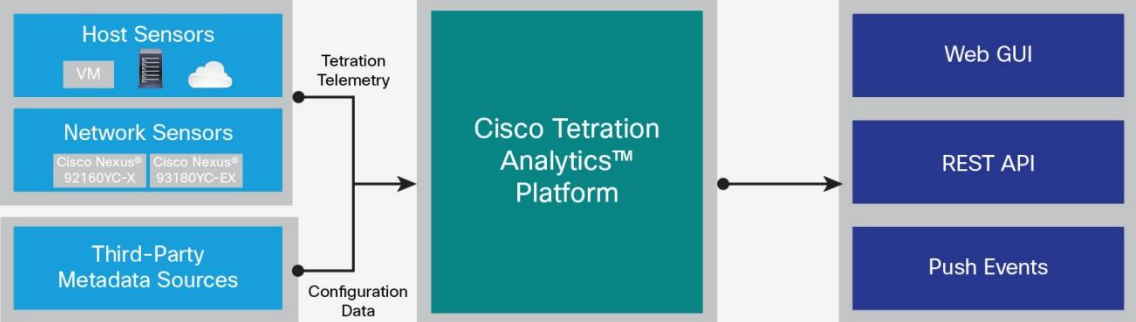
Cisco Tetration Analytics Data Sheet describes the hardware requirements:
And the power requirements:
No pricing is given, but based on the hardware, data center space, power and cooling requirements, this brute force approach to analytics will be reassuringly expensive to purchase and operate.
Update June 22, 2016: See 451 Research report, Cisco Tetration: a $3m, 1,700-pound appliance for network traffic analytics is born, for pricing information.

Programmable hardware: Barefoot Networks, PISA, and P4
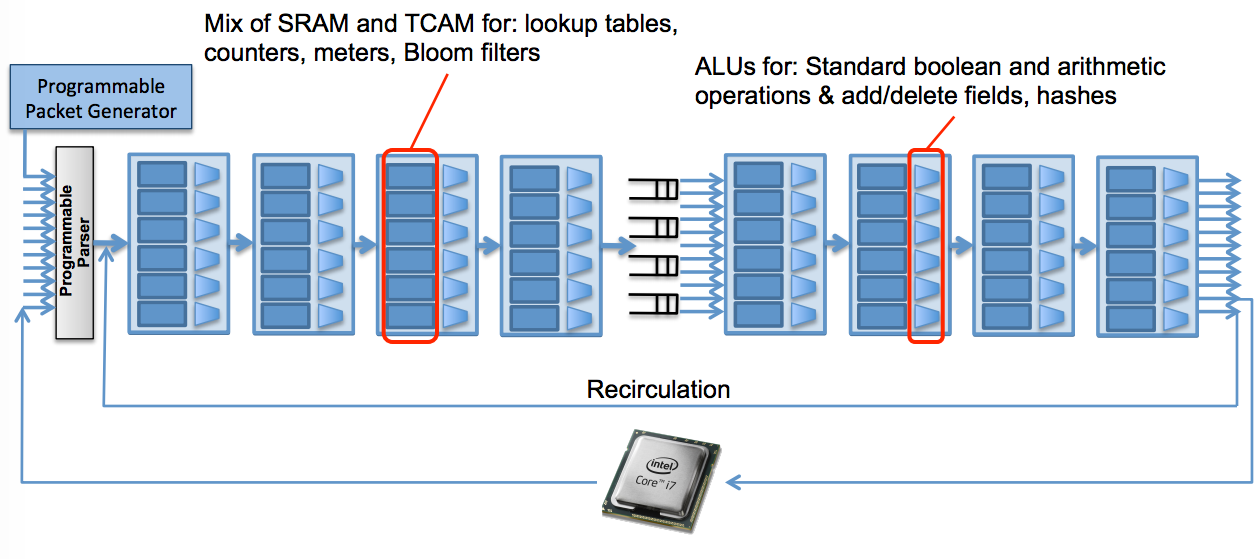
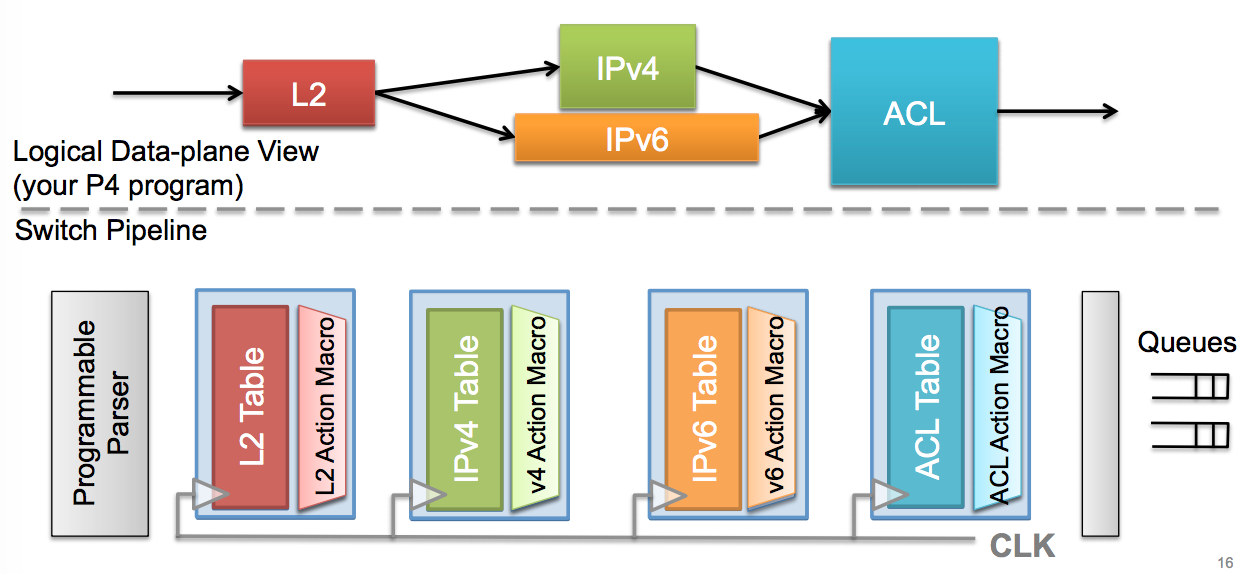
table sflow_ing_take_sample {
    /* take_sample > MAX_VAL_31 and valid sflow_session_id => take the sample */
    reads {
        ingress_metadata.sflow_take_sample : ternary;
        sflow_metadata.sflow_session_id : exact;
    }
    actions {
        nop;
        sflow_ing_pkt_to_cpu;
    }
}
Network visibility is one of the major use cases for P4 based switches. Improving Network Monitoring and Management with Programmable Data Planes describes how P4 can be used to collect information about latency and queueing in the switch forwarding pipeline.
Merchant silicon based routing, flow analytics, and telemetry
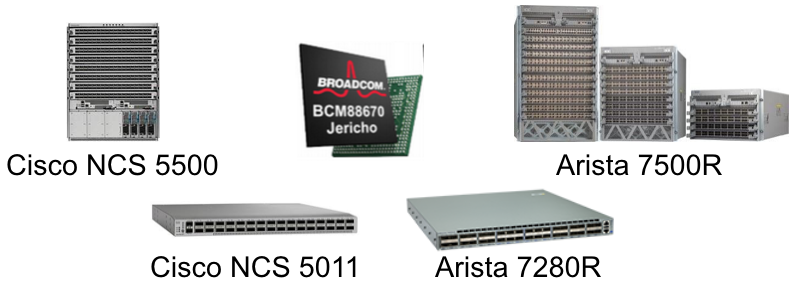
The router market is poised to be similarly disrupted with the introduction of devices based on Broadcom's Jericho ASIC, which has the capacity to handle over 1 million routes in hardware (the full Internet routing table is currently around 600,000 routes).
An edge router is a very pricey box indeed, often costing anywhere from $100,000 to $200,000 per 100 Gb/sec port, depending on features in the router and not including optical cables that are also terribly expensive. Moreover, these routers might only be able to cram 80 ports into a half rack or full rack of space. The 7500R universal spine and 7280R universal leaf switches cost on the order of $3,000 per 100 Gb/sec port, and they are considerably denser and less expensive. - Leaving Fixed Function Switches Behind For Universal LeafsBroadcom Jericho ASICs are currently available in Arista 7500R/7280R routers and in Cisco NCS 5000 series routers. Expect further disruption Continue reading
Docker networking with IPVLAN and Cumulus Linux

Eliminating the complexity associated with switching broadcast domains, VLANs, spanning tree, etc. allows a purely routed network to be easily scaled to very large sizes. However, there are some challenges to overcome:
IPVlan will require routes to be distributed to each endpoint. The driver only builds the Ipvlan L3 mode port and attaches the container to the interface. Route distribution throughout a cluster is beyond the initial implementation of this single host scoped driver. In L3 mode, the Docker host is very similar to a router starting new networks in the container. They are on networks that the upstream network will not know about without route distribution.Cumulus Networks has been working to simplify routing in the ECMP leaf and spine networks and the white paper Routing on the Host: An Introduction shows how the routing configuration used on Cumulus Linux can be extended to the hosts.
Update June 2, 2016: Routing on the Host contains packaged versions of the Continue reading
Streaming telemetry

The OpenConfig project extends beyond configuration, "Streaming telemetry is a new paradigm for network monitoring in which data is streamed from devices continuously with efficient, incremental updates. Operators can subscribe to the specific data items they need, using OpenConfig data models as the common interface."
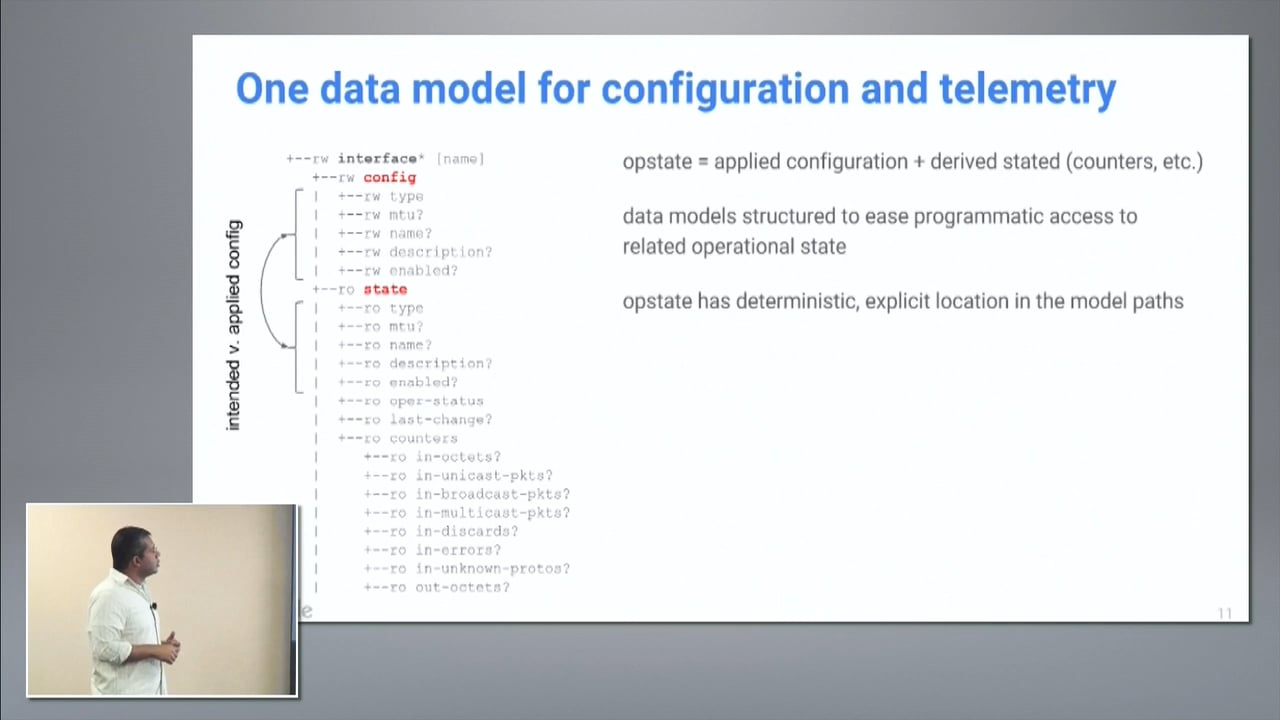
Anees Shaikh's Network Field Day talk provides an overview of OpenConfig and includes an example that demonstrates how configuration and state are combined in a single YANG data model. In the example, read/write config attributes used to configure a network interface (name, description, MTU, operational state) are combined with the state attributes needed to verify the configuration (MTU, name, description, oper-status, last-change) and collect metrics (in-octets, in-ucast-pkts, in-broadcast-pkts, ...).
Anees positions OpenConfig streaming telemetry mechanism as an attractive alternative to polling for metrics using Simple Network Management Protocol (SNMP) - see Push vs Pull for a detailed comparison between pushing (streaming) and pulling (polling) metrics.

Streaming telemetry is Continue reading
Internet of Things (IoT) telemetry

The recently released Raspberry Pi Zero (costing $5) is an example of the type of embedded low power computer enabling IoT. These small devices are typically wired to one or more sensors (measuring temperature, humidity, location, acceleration, etc.) and embedded in or attached to physical devices.
Collecting real-time telemetry from large numbers of small devices that may be located within many widely dispersed administrative domains poses a number of challenges, for example:
- Discovery - How are newly connected devices discovered?
- Configuration - How can the numerous individual devices be efficiently configured?
- Transport - How efficiently are measurements transported and delivered?
- Latency - How long does it take before measurements are remotely accessible?
The following steps describe how to install the Host sFlow Continue reading
OVS Orbit podcast with Ben Pfaff

Follow the link to see listen to the podcast, read the extensive show notes, follow related links, and to subscribe to the podcast.
Raspberry Pi real-time network analytics

A future article will examine how the Host sFlow agent can be used to efficiently stream measurements from large numbers of inexpensive Rasberry Pi devices ($5 for model Zero) to the sFlow-RT collector to monitor and control the "Internet of Things" (IoT).The following instructions show how to install sFlow-RT on Raspbian Jesse (the Debian Linux based Raspberry Pi operating system).
wget http://www.inmon.com/products/sFlow-RT/sflow-rt_2.0-1092.debWe are ignoring the dependency on openjdk and will use the default Raspbian Java 1.8 version Continue reading
sudo dpkg -i --ignore-depends=openjdk-7-jre-headless sflow-rt_2.0-1092.deb
OpenNSL

The recent inclusion of the APIs needed to enable sFlow instrumentation in Broadcom hardware allows open source network operating systems such as OpenSwitch and Open Network Linux to implement the sFlow telemetry standard.
Mininet dashboard
The following steps install the dashboard and start sFlow-RT:
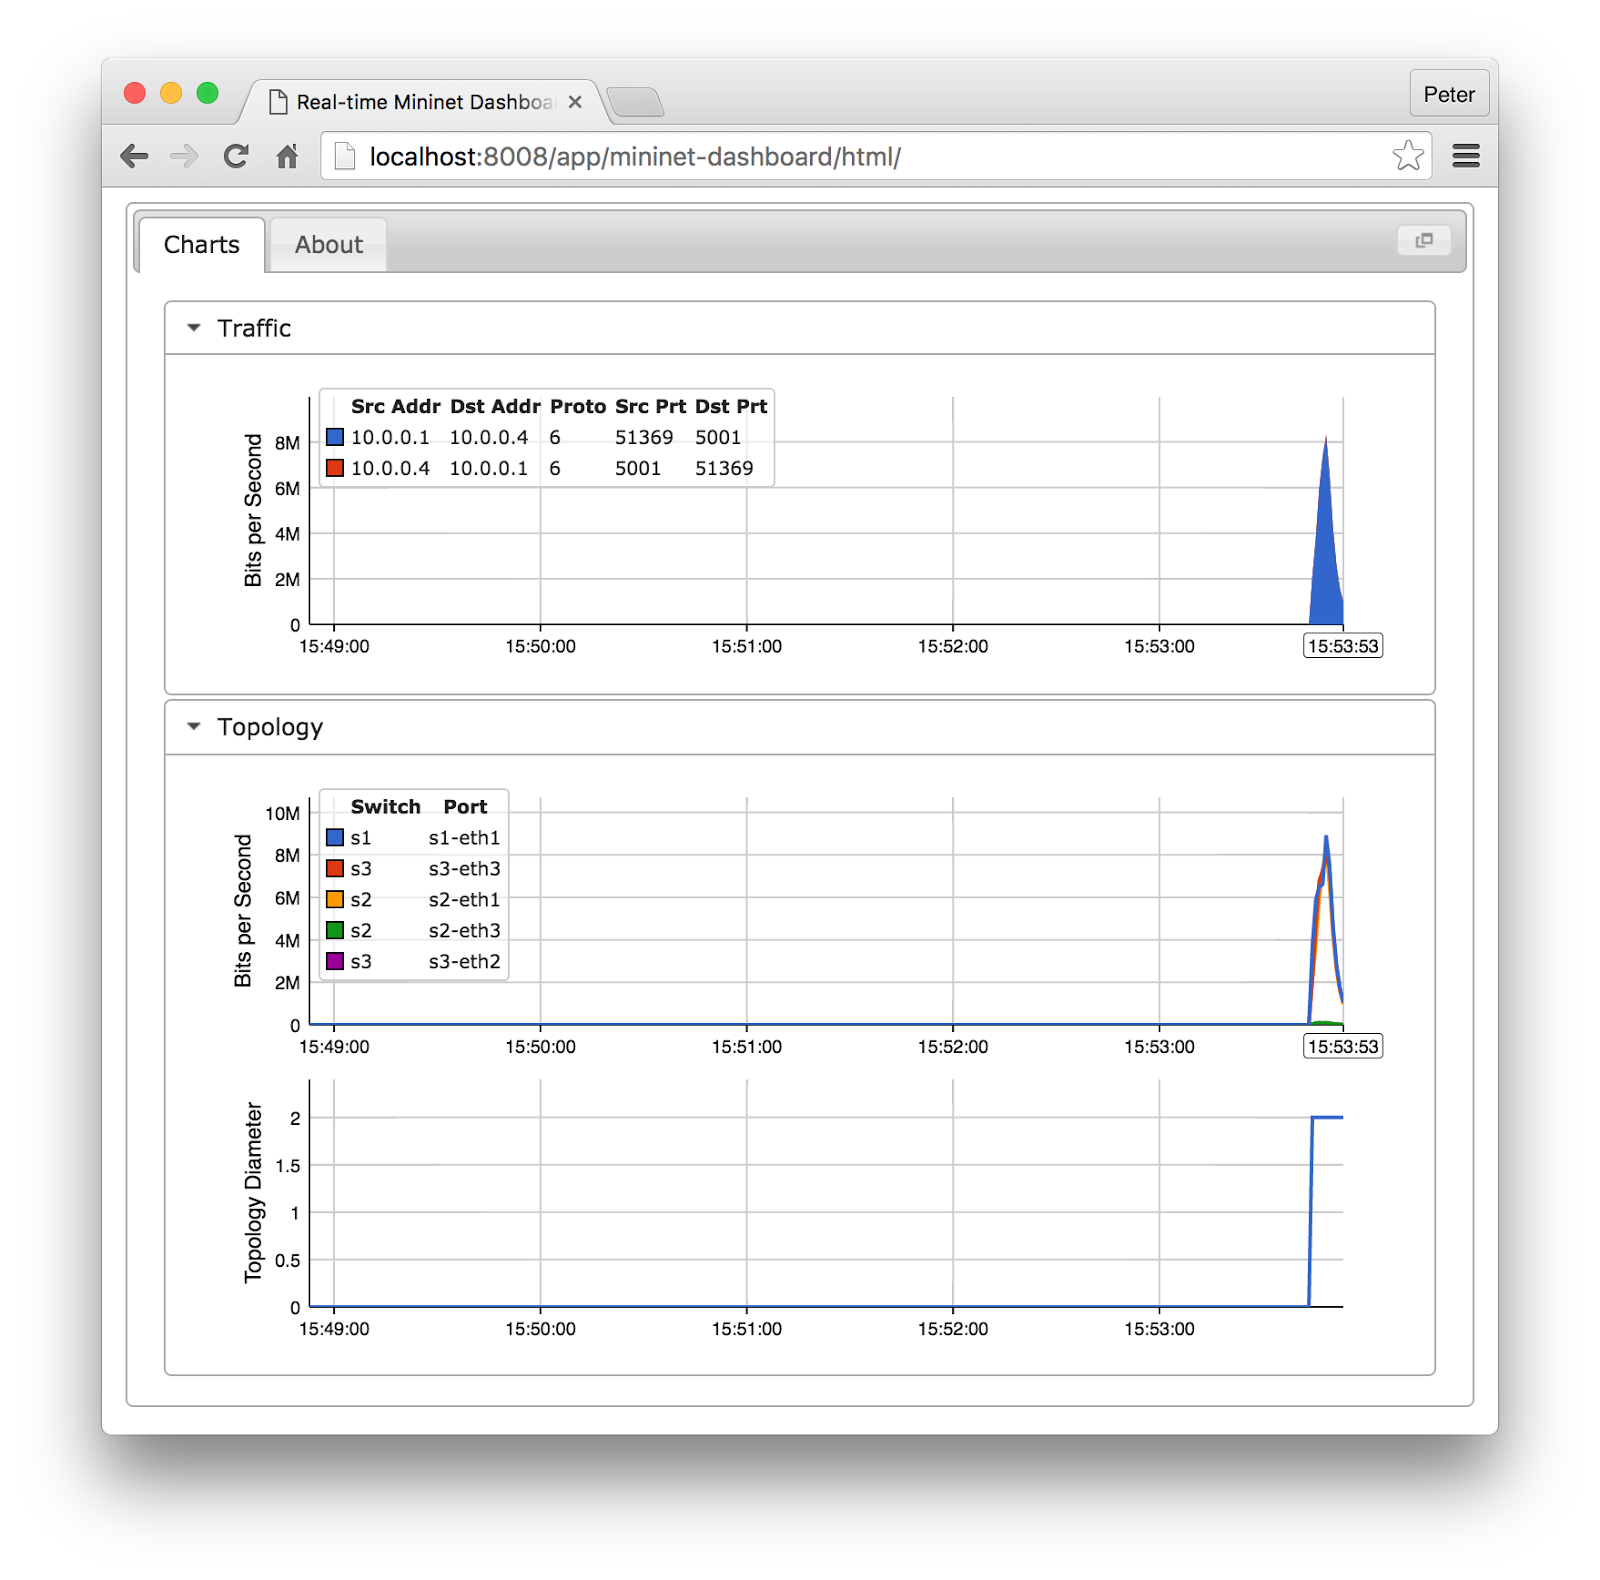
cd sflow-rtThe dashboard web interface shown in the screen shot should now be accessible. Run a test to see data in the dashboard. The following test created the results shown:
./get-app.sh sflow-rt mininet-dashboard
./start.sh
sudo mn --custom extras/sflow.py --link tc,bw=10 --topo tree,depth=2,fanout=2 --test iperfThe dashboard has three time series charts that update every second and show five minutes worth of data. From top to bottom, the charts are:
- Top Flows - Click on a peak in the chart to see the flows that were active at that time.
- Top Ports - Click on a peak in the chart to see the ingress ports that were active at that time.
- Topology Diameter - The diameter of the topology.
Mininet flow analytics

This article shows how standard sFlow instrumentation built into Mininet can be combined with sFlow-RT analytics software to provide real-time traffic visibility for Mininet networks. Augmenting Mininet with sFlow telemetry realistically emulates the instrumentation built into most vendor's switch hardware, provides visibility into Mininet experiments, and opens up new areas of research (e.g. SDN and large flows).
The following papers are a small selection of projects using sFlow-RT:
- Network-Wide Traffic Visibility in OF@TEIN SDN Testbed using sFlow
- OrchSec: An Orchestrator-Based Architecture For Enhancing Network-Security Using Network Monitoring And SDN Control Functions
- Utilizing OpenFlow and sFlow to Detect and Mitigate SYN Flooding Attack
- OpenDaylight Project Proposal "Dynamic Flow Management"
- Large Flows Detection, Marking, and Mitigation based on sFlow Standard in SDN
- An SDN-based Architecture for Network-as-a-Service
- Saving Energy in OpenFlow Computer Networks
- Implementation of Neural Switch using OpenFlow as Load Balancing Method in Data Center
Identifying bad ECMP paths
In the talk Move Fast, Unbreak Things! at the recent DevOps Networking Forum, Petr Lapukhov described how Facebook has tackled the problem of detecting packet loss in Equal Cost Multi-Path (ECMP) networks. At Facebook's scale, there are many parallel paths and actively probing all the paths generates a lot of data. The active tests generate over 1Terabits/second of measurement data per Facebook data center and a Hadoop cluster with hundreds of compute nodes is required per data center to process the data.Processing active test data can detect that packets are being lost within approximately 20 seconds, but doesn't provide the precise location where packets are dropped. A custom multi-path traceroute tool (fbtracert) is used to follow up and narrow down the location of the packet loss.
While described as measuring packet loss, the test system is really measuring path loss. For example, if there are 64 ECMP paths in a pod, then the loss of one path would result in a packet loss of approximately 1 in 64 packets in traffic flows that cross the ECMP group.
Black hole detection describes an alternative approach. Industry standard sFlow instrumentation embedded within most vendor's switch hardware provides visibility into the Continue reading
Black hole detection

The white paper discusses how Broadcom ASICs can be programmed to detect blackholes based on packet paths, i.e. packets arriving at a ToR switch from a Spine switch should never be forwarded to another Spine switch.
This article will discuss how the industry standard sFlow instrumentation (also included in Broadcom based switches) can be used to provide fabric wide detection of black holes.
sFlow to IPFIX/NetFlow
For example, the following command defines a cache that will maintain flow records for TCP flows on the network, capturing IP source and destination addresses, source and destination port numbers and the bytes transferred and sending flow records to address 10.0.0.162:
curl -H "Content-Type:application/json" -X PUT --data  '{"keys":"ipsource,ipdestination,tcpsourceport,tcpdestinationport",
"value":"bytes", "ipfixCollectors":["10.0.0.162"]}'
http://localhost:8008/flow/tcp/json
Running Wireshark's tshark command line utility on 10.0.0.162 verifies that flows are being received: # tshark -i eth0 -V udp port 4739
Running as user "root" and group "root". This could be dangerous.
Capturing on lo
Frame 1 (134 bytes on wire, 134 bytes captured)
Arrival Time: Continue reading
Berkeley Packet Filter (BPF)
Linux bridge, macvlan, ipvlan, adapters discusses how industry standard sFlow technology, widely supported by data center switch vendors, has been extended to provide network visibility into the Linux data plane. This article explores how sFlow's lightweight packet sampling mechanism has been implemented on Linux network adapters.Linux Socket Filtering aka Berkeley Packet Filter (BPF) describes the recently added prandom_u32() function that allows packets to be randomly sampled in the Linux kernel for efficient monitoring of production traffic.
Background: Enhancing Network Intrusion Detection With Integrated Sampling and Filtering, Jose M. Gonzalez and Vern Paxson, International Computer Science Institute Berkeley, discusses the motivation for adding random sampling BPF and the email thread [PATCH] filter: added BPF random opcode describes the Linux implementation and includes an interesting discussion of the motivation for the patch.The following code shows how the open source Host sFlow agent implements random 1-in-256 packet sampling as a BPF program:
ld randA JIT for packet filters discusses the Linux Just In Time (JIT) compiler for BFP programs, delivering native machine code performance for compiled filters.
mod #256
jneq #1, drop
ret #-1
drop: ret #0
Minimizing cost of visibility describes why low overhead monitoring is an Continue reading
Cisco SF250, SG250, SF350, SG350, SG350XG, and SG550XG series switches

Cisco network engineers might not be familiar with the multi-vendor sFlow technology since it is a relatively new addition to Cisco products. The article, Cisco adds sFlow support, describes some of the key features of sFlow and contrasts them to Cisco NetFlow.Configuring sFlow on the switches is straightforward. For example, The following commands configure a switch to sample packets at 1-in-1024, poll counters every 30 seconds and send sFlow to an analyzer (10.0.0.50) over UDP using the default sFlow port (6343):
sflow receiver 1 10.0.0.50For each interface:
sflow flow-sampling 1024 1A previous posting discussed the selection of sampling rates. Additional information can be found on the Cisco web site.
sflow counter-sampling 30 1

Multi-tenant sFlow

One option would be to simply replicate the sFlow datagrams and send copies to both tenants. Forwarding using sflowtool describes how sflowtool can be used to replicate and forward sFlow and sFlow-RT can be configured to forward sFlow using its REST API:
curl -H "Content-Type:application/json" \However, there are serious problems with this approach:
-X PUT --data '{"address":"10.0.0.1","port":6343}' \
http://127.0.0.1:8008/forwarding/TenantA/json
- Private information about Tenant B's traffic is leaked to Tenant A.
- Information from internal links within the network (i.e. links between s1, s2, s3 and s4) is leaked to Tenant A.
- Duplicate data from each network hop is likely to cause Tenant A to over-estimate their traffic.
Network visibility with Docker
Industry standard sFlow is well placed to give network visibility into the Docker infrastructure used to support microservices. The sFlow standard is widely supported by data center switch vendors (Cisco, Arista, Juniper, Dell, HPE, Brocade, Cumulus, etc.) providing a cost effective and scaleable method of monitoring the physical network infrastructure. In addition, Linux bridge, macvlan, ipvlan, adapters described how sFlow is also an efficient means of leveraging instrumentation built into the Linux kernel to extend visibility into Docker host networking.
The following commands build the Host sFlow binary package from sources on an Ubuntu 14.04 system:
sudo apt-get updateThis resulting hsflowd_1.29.1-1_amd64.deb package can be copied and installed on all the hosts in the Docker cluster using configuration management tools such as Puppet, Chef, Ansible, etc.
sudo apt-get install build-essential
sudo apt-get install libpcap-dev
sudo apt-get install wget
wget https://github.com/sflow/host-sflow/archive/v1.29.1.tar.gz
tar -xvzf v1.29.1.tar.gz
cd host-sflow-1.29.1
make DOCKER=yes PCAP=yes deb
This Continue reading
Lasers!

Dr. Evil is right, lasers are cool! The draft sFlow Optical Interface Structures specification exports metrics gathered from instrumentation built into Small Form-factor Pluggable (SFP) and Quad Small Form-factor Pluggable (QSFP) optics modules. This article provides some background on optical modules and discusses the value of including optical metrics in the sFlow telemetry stream exported from switches and hosts.


The bottom half of the diagram shows the management components. Power, voltage and temperature sensors are monitored and the results are written into registers in an EEPROM that are accessible via a management interface.
The proposed sFlow extension standardizes Continue reading