Comparing AI / ML activity from two production networks

This article goes beyond simulation to demonstrate the AI Metrics dashboard by comparing live traffic seen in two production AI clusters.
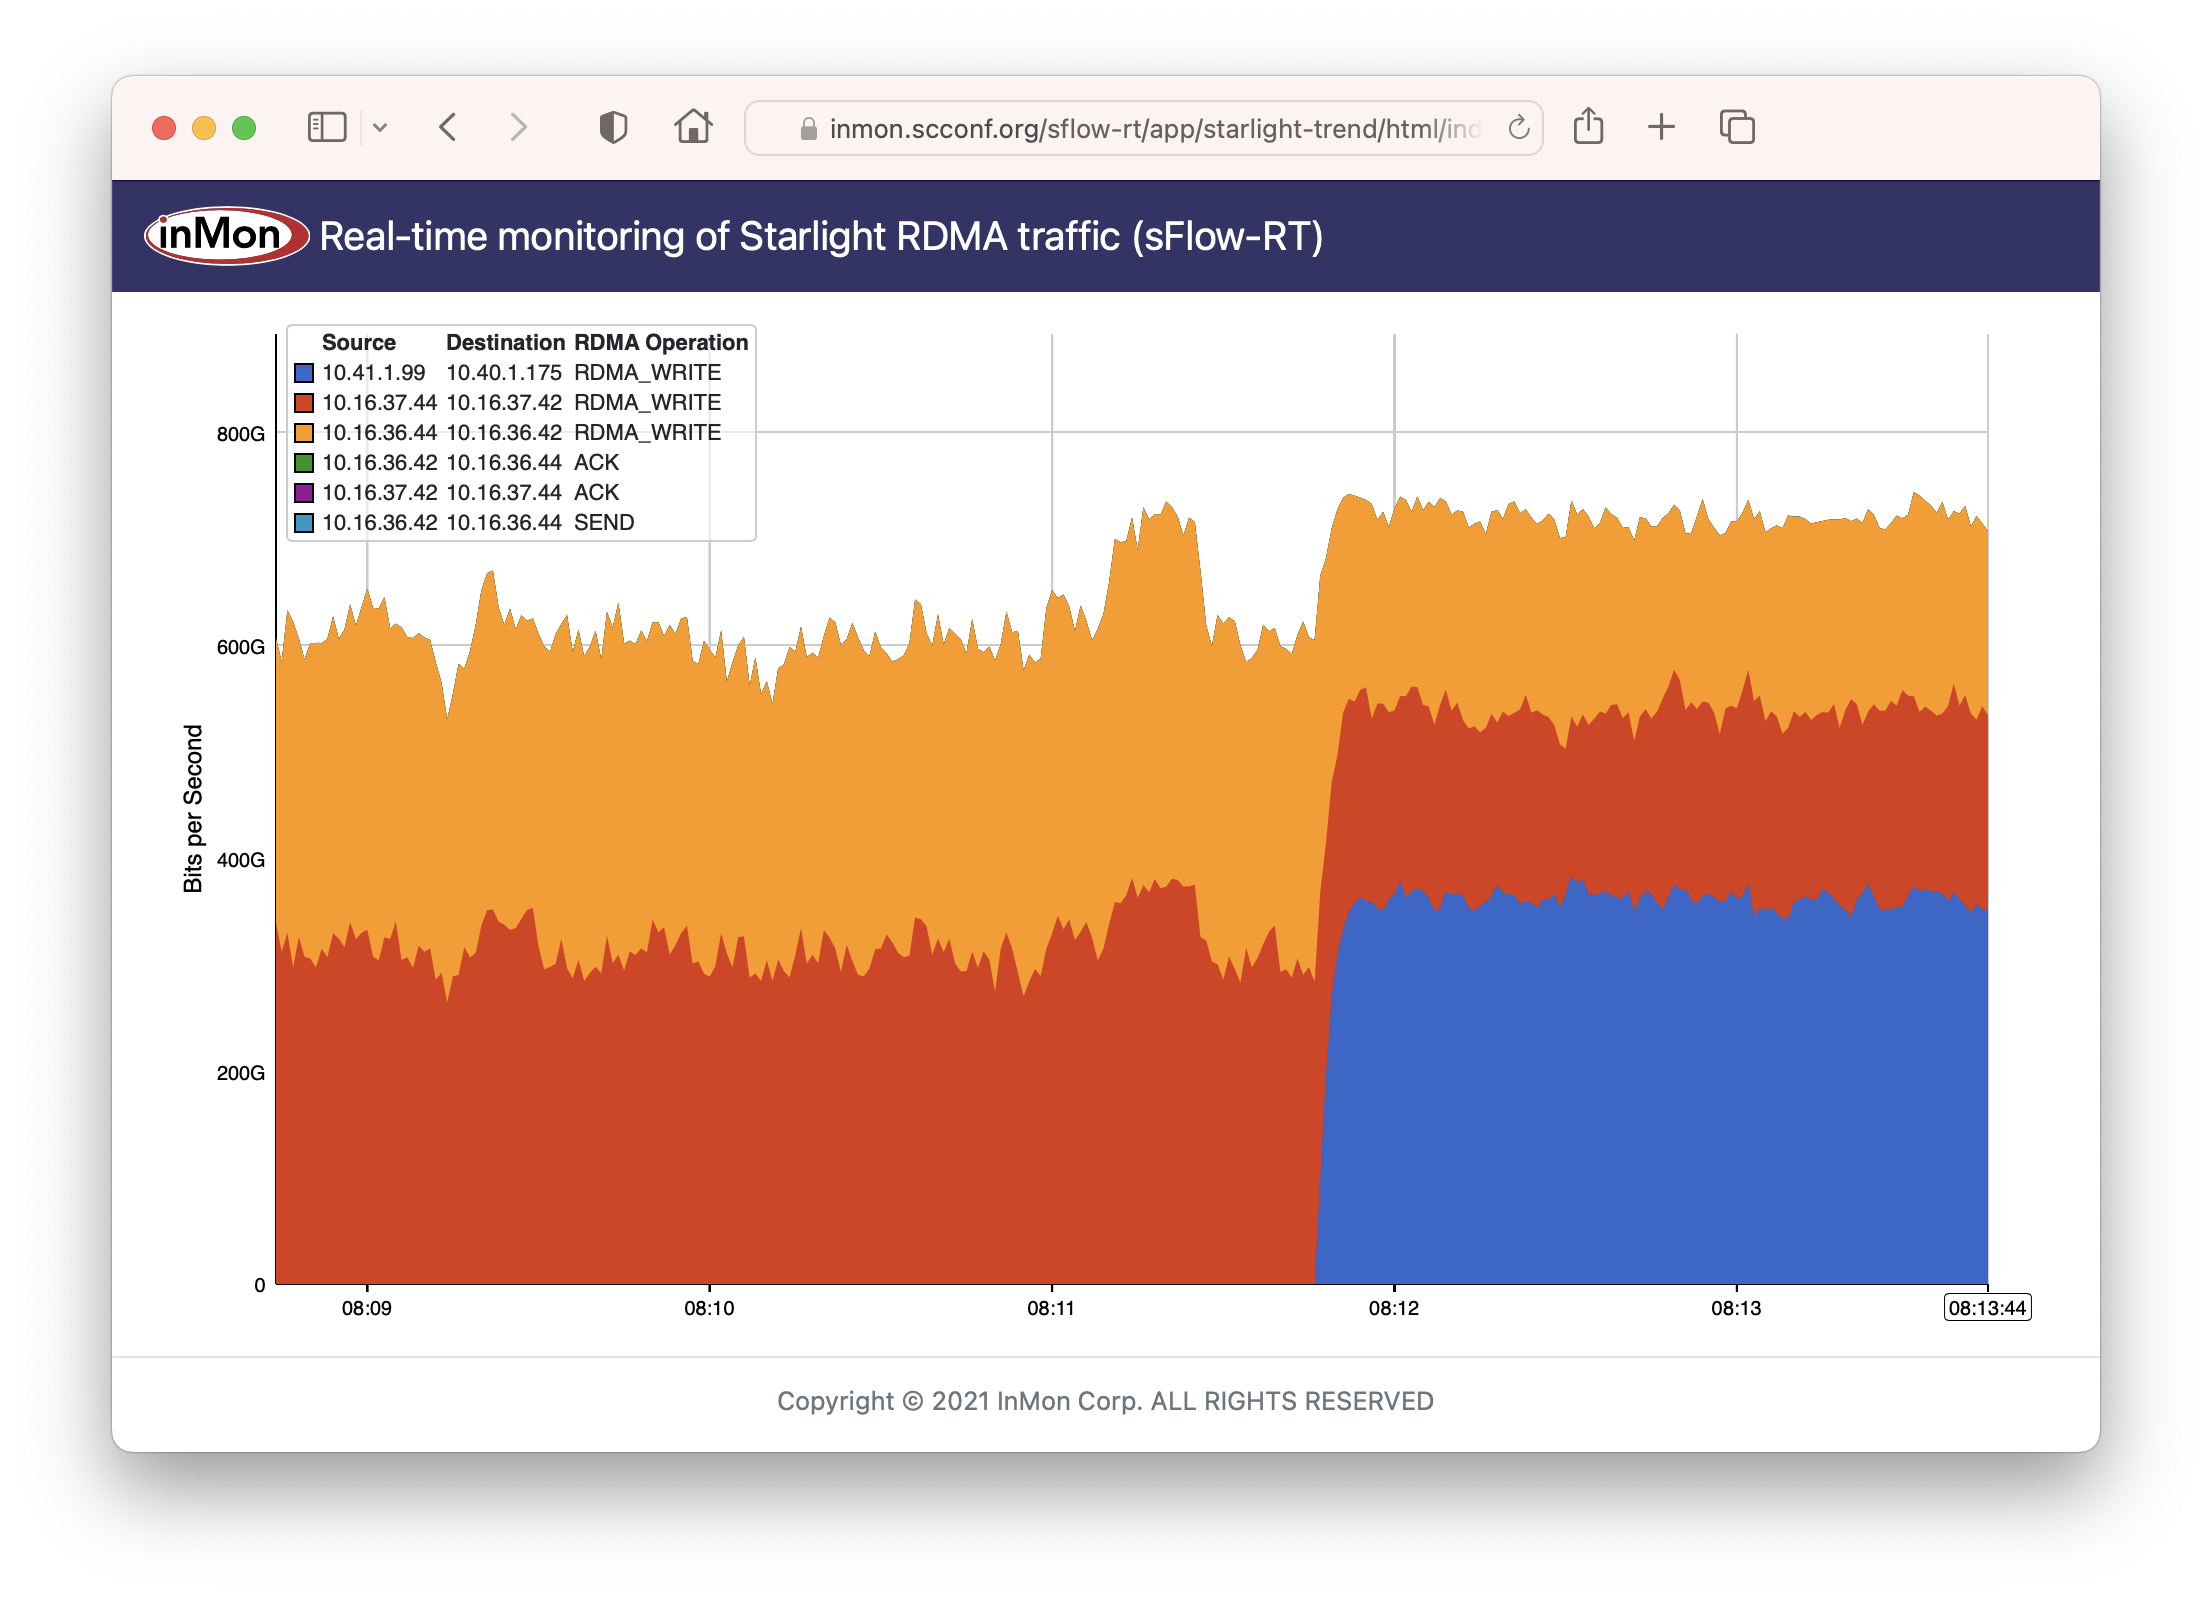
Cluster 1

Capture to pcap file using sflowtool
Replay pcap files using sflowtool describes how to capture sFlow datagrams using tcpdump and replay them in real time using sflowtool. However, using tcpdump for the capture has the downside of requiring root privileges. A recent update to sflowtool now makes it possible to use sflowtool to capture sFlow datagrams in tcpdump pcap format without the need for root access.
docker run --rm -p 6343:6343/udp sflow/sflowtool -M > sflow.pcapEither compile the latest version of sflowtool or, as shown above, use Docker to run the pre-built sflow/sflowtool image. The -M option outputs whole UDP datagrams received to standard output. In either case, type CNTRL + C to end the capture.
AI Metrics
The dashboard shown above is from a simulated network 1,000 switches, each with 48 ports access ports connected to a host. Activity occurs in a 256mS on / off cycle to emulate an AI learning run. The metrics include:
- Total Traffic Total traffic entering fabric
- Operations Total RoCEv2 operations broken out by type
- Core Link Traffic Histogram of load on fabric links
- Edge Link Traffic Histogram of load on access ports
- RDMA Operations Total RDMA operations
- RDMA Bytes Average RDMA operation size
- Credits Average number of credits in RoCEv2 acknowledgements
- Period Detected period of compute / exchange activity on fabric (in this case just over 0.5 seconds)
- Congestion Total ECN / CNP congestion messages
- Errors Total ingress / egress errors
- Discards Total ingress / egress discards
- Drop Reasons Packet drop reasons
Note: Clicking on peaks in the charts shows values at that time.
This article gives step-by-step instructions to run the AI Metrics application in a production environment and integrate Continue reading
Replay pcap files using sflowtool
It can be very useful to capture sFlow telemetry from production networks so that it can be replayed later to perform off-line analysis, or to develop or evaluate sFlow collection tools.
sudo tcpdump -i any -s 0 -w sflow.pcap udp port 6343Run the command above on the system you are using to collect sFlow data (if you aren't yet collecting sFlow, see Agents for suggested configuration settings). Type Control-C to end the capture after 5 to 10 minutes. Copy the resulting sflow.pcap file to your laptop.
docker run --rm -it -v $PWD/sflow.pcap:/sflow.pcap sflow/sflowtool \
  -r /sflow.pcap -P 1
Either compile the latest version of sflowtool or, as shown above, use Docker to run the pre-built sflow/sflowtool image. The -P (Playback) option replays the trace in real-time and displays the contents of each sFlow message. Running sflowtool using Docker provides additional examples, including converting the sFlow messages into JSON format for processing by a Python script.
docker run --rm -it -v $PWD/sflow.pcap:/sflow.pcap sflow/sflowtool \
  -r /sflow.pcap -f 192.168.4.198/6343 -P 1
The -f (forwarding) option takes an IP address and UDP port number as arguments, in this Continue reading
Topology aware flow analytics with NVIDIA NetQ

NVIDIA Cumulus Linux 5.11 for AI / ML describes how NVIDIA 400/800G Spectrum-X switches combined with the latest Cumulus Linux release deliver enhanced real-time telemetry that is particularly relevant to the AI / machine learning workloads that Spectrum-X switches are designed to handle.
This article shows how to extract Topology from an NVIDIA fabric in order to perform advanced fabric aware analytics, for example: detect flow collisions, trace flow paths, and de-duplicate traffic.
In this example, we will use NVIDIA NetQ, a highly scalable, modern network operations toolset that provides visibility, troubleshooting, and validation of your Cumulus and SONiC fabrics in real time.
netq show lldp jsonFor example, the NetQ Link Layer Discovery Protocol (LLDP) service simplifies the task of gathering neighbor data from switches in the network, and with the json option, makes the output easy to process with a Python script, for example, lldp-rt.py.
The simplest way to try sFlow-RT is to use the pre-built sflow/topology Docker image that packages sFlow-RT with additional applications that are useful for monitoring network topologies.
docker run -p 6343:6343/udp -p 8008:8008 sflow/topologyConfigure Cumulus Linux to steam sFlow telemetry to sFlow-RT on UDP port 6343 (the default for Continue reading
SC24 Over 10 Terabits per Second of WAN Traffic

The SC24 WAN Stress Test chart shows 10.3 Terabits bits per second of WAN traffic to the The International Conference for High Performance Computing, Networking, Storage, and Analysis (SC24) conference held this week in Atlanta. The conference network used in the demonstration, SCinet, is described as the most powerful and advanced network on Earth, connecting the SC community to the world.

SC24 Real-time RoCEv2 traffic visibility describes a demonstration of wide area network bulk data transmission using RDMA over Converged Ethernet (RoCEv2) flows typically seen in AI/ML data centers. In the example, 3.2Tbits/second sustained trasmissions from sources geographically distributed around the United States was demonstrated.

SC24 Dropped packet visibility demonstration shows how the sFlow data model integrates three telemetry streams: counters, packet samples, and packet drop notifications. Each type of data is useful on its own, but together they provide the comprehensive network wide observability needed to drive automation. Real-time network visibility is particularly relevant to AI / ML data center networks where congestion and dropped packets can result in serious performance degradation and in this screen capture you can see multiple 400Gbits/s RoCEv2 flows.

SC24 SCinet traffic describes the architecture of the real-time monitoring system used to Continue reading
SC24 Real-time RoCEv2 traffic visibility


SC24 SCinet traffic

The real-time dashboard shows total network traffic at The International Conference for High Performance Computing, Networking, Storage, and Analysis (SC24) conference being held this week in Atlanta. The dashboard shows that 31 Petabytes of data have been transferred already and the conference has just started.

The conference network used in the demonstration, SCinet, is described as the most powerful and advanced network on Earth, connecting the SC community to the world.

Finally, check out the SC24 Dropped packet visibility demonstration to learn about one of newest developments in sFlow monitoring and see a live demonstration.
NVIDIA Cumulus Linux 5.11 for AI / ML

NVIDIA Cumulus Linux 5.11 includes major upgrades to the sFlow agent that fully exposes the advanced instrumentation built into NVIDIA Spectrum-X silicon. The enhanced real-time telemetry is particularly relevant to the AI / machine learning workloads that Spectrum-X is designed to handle.
With Cumulus Linux 5.11, the sFlow agent is easily configured using nvue commands, see Monitoring System Statistics and Network Traffic with sFlow:
nv set system sflow dropmon hw
nv set system sflow poll-interval 20
nv set system sflow collector 192.0.2.1
nv set system sflow state enabled
nv config apply
Note: In this case, enabling dropmon ensures that every dropped packet is captured, along with ingress port and drop reason (e.g. ttl_exceeded).
The same commands should be applied to every switch in the fabric for comprehensive visibility.
SC24 Dropped packet visibility demonstration

The real-time dashboard is a joint InMon / Arista demonstration at The International Conference for High Performance Computing, Networking, Storage, and Analysis (SC24) conference being held this week in Atlanta.
The conference network used in the demonstration, SCinet, is described as the most powerful and advanced network on Earth, connecting the SC community to the world.
The sFlow Packet Drop Monitoring In High Performance Networks dashboard combines telemetry from all the Arista switches in the SCinet network to provide real-time network-wide view of performance. Each of the three charts demonstrate a different type of measurement in the sFlow telemetry stream:
- Counters: Total Traffic shows total traffic calculated from interface counters streamed from all interfaces. Counters provide a useful way of accurately reporting byte, frame, error and discard counters for each network interface. In this case, the chart rolls up data from all interfaces to trend total traffic on the network.
- Samples: Top Flows shows the top 5 largest traffic flows traversing the network. The chart is based on sFlow's random packet sampling mechanism, providing a scaleable method of determining the hosts and services responsible for the traffic reported by the counters. Visibility into top flows is essential if one Continue reading
Worldwide deployment of real-time flow analytics

Industry standard sFlow telemetry is widely supported by network equipment vendors and network management platforms. However, the advent of real-time sFlow analytics has opened up a range of new applications for sFlow. The map above shows the proportion of sFlow-RT instances running in each of the over 70 countries in which it is deployed.
The following use cases are driving current deployments:
- Augmenting observability dashboards with real-time network analytics, see Flow metrics with Prometheus and Grafana
- Monitoring Internet Exchange Points, see Internet eXchange Provider (IXP) Metrics
- Automated DDoS mitigation, see DDoS protection quickstart guide
Addressing the challenge of operating AI / ML clusters is the emerging application for sFlow visibility. High speed (400/800G) data center switches needed to handle machine learning traffic flows include sFlow agents and real-time analytics are essential to optimize the network so that expensive GPU and compute resources are fully utilized, see Leveraging open technologies to monitor packet drops in AI cluster fabrics.
If you would like to see how real-time network analytics can transform network operations, Getting Started describes how to download and configure sFlow-RT analytics software for use in your network, or how to try it out using an emulator, or pre-captured data.
Leveraging open technologies to monitor packet drops in AI cluster fabrics
In this talk from the recent OCP Global Summit, Aldrin Isaac, eBay, describes the challenge, AI clusters operate most efficiently over lossless networks for optimum job completion times which can be significantly impacted by dropped packets. Although networks can be designed to minimize packet loss by choosing the right network topology, optimizing network devices and protocols, an effective monitoring and troubleshooting network performance tool is still required. Such tool should capture packet drops, raise notifications and identify various drop reasons and pin point where the drops caused congestions. In turn, it allows the governing management application to tune configurations of relevant infrastructure components, including switches, NICs and GPU servers.
The talk shares the results and best practices of a TAM (Telemetry and Monitoring) solution being prepared for deployment at eBay. It leverages OCP’s SAI and open sFlow drop notification technologies as part of eBay’s ongoing initiatives to adopt open networking hardware and community SONiC for its data centers.
The sFlow Dropped Packet Notification Structures extension mentioned in the talk adds real-time packet drop notifications (including dropped packet header and drop reason) as part of an industry standard sFlow telemetry feed, making the data available to open source and commercial sFlow analytics Continue reading
OCP Global Summit 2024


The talk will share the results and best practices of a TAM (Telemetry and Monitoring) solution being prepared for deployment at eBay. It leverages OCP’s SAI and open sFlow drop notification technologies as part of eBay’s ongoing initiatives to adopt open networking hardware and community SONiC for its data centers.
Vector Packet Processor (VPP)

The main conclusions based on testing described in the two VPP blog posts are:
- If sFlow is not enabled on a given interface, there is no regression on other interfaces.
- If sFlow is enabled, copying packets costs 11 CPU cycles on average
- If sFlow takes a sample, it takes only marginally more CPU time to enqueue.
- No sampling gets 9.88Mpps of IPv4 and 14.3Mpps of L2XC throughput,
- 1:1000 sampling reduces to 9.77Mpps of L3 and 14.05Mpps of L2XC throughput,
- and an overly harsh 1:100 reduces to 9.69Mpps and 13.97Mpps only.
The VPP sFlow plugin provides a lightweight method of exporting real-time sFlow telemetry from a VPP based router. Including the plugin with VPP distributions has no impact on performance. Enabling the plugin provides real-time visibility that opens up additional use cases for VPPs programmable dataplane. For example, VPP is well suited to packet filtering use cases where the number of Continue reading
Emulating congestion with Containerlab

This article describes the steps needed to emulate realistic network performance problems using Containerlab. First, using the FRRouting (FRR) open source router to build the topology provides a lightweight, high performance, routing implementation that can be used to efficiently emulate large numbers of routers using the native Linux dataplane for packet forwarding. Second, the containerlab tools netem set command can be used to introduce packet loss, delay, jitter, or restrict bandwidth of ports.
The netem tool makes use of the Linux tc (traffic control) module. Unfortunately, if you are using Docker desktop, the minimal virtual machine used to run containers does not include the tc module.
multipass launch dockerInstead, use Multipass as a convenient way to create and start an Ubuntu virtual machine with Docker support on your laptop. If you are already on a Linux system with Docker installed, skip forward to the git clone step.
multipass lsList the multipass virtual machines.
Continue reading
Dropped packet metrics with Prometheus and Grafana

Flow metrics with Prometheus and Grafana describes how define flow metrics and create dashboards to trend the flow metrics over time. This article describes how the same setup can be used to define and trend metrics based on dropped packet notifications.
  - job_name: sflow-rt-drops
    metrics_path: /app/prometheus/scripts/export.js/flows/ALL/txt
    static_configs:
      - targets: ['sflow-rt:8008']
    params:
      metric: ['dropped_packets']
      key:
        - 'node:inputifindex'
        - 'ifname:inputifindex'
        - 'reason'
        - 'stack'
        - 'macsource'
        - 'macdestination'
        - 'null:vlan:untagged'
        - 'null:[or:ipsource:ip6source]:none'
        - 'null:[or:ipdestination:ip6destination]:none'
        - 'null:[or:icmptype:icmp6type:ipprotocol:ip6nexthdr]:none'
      label:
        - 'switch'
        - 'port'
        - 'reason'
        - 'stack'
        - 'macsource'
        - 'macdestination'
        - 'vlan'
        - 'src'
        - 'dst'
        - 'protocol'
      value: ['frames']
      dropped: ['true']
      maxFlows: ['20']
      minValue: ['0.001']
The Prometheus scrape configuration above is used to Continue reading
Dropped packet notifications with Arista Networks

Visibility into dropped packets is essential for Artificial Intelligence/Machine Learning (AI/ML) workloads, where a single dropped packet can stall large scale computational tasks, idling millions of dollars worth of GPU/CPU resources, and delaying the completion of business critical workloads. Enabling real-time sFlow telemetry provides the observability into traffic flows and packet drops needed to effectively manage these networks.
The availability of the Arista EOS 4.31.4M maintenance release brings sFlow dropped packet monitoring (previously demonstrated using the 4.30.1F feature release - see SC23 Dropped packet visibility demonstration) to production networks, see EOS Life Cycle Policysflow sampling 50000 sflow polling-interval 20 sflow vrf mgmt destination 203.0.113.100 sflow vrf mgmt source-interface Management0 sflow runThe above Arista EOS commands enable sFlow counter polling and packet sampling on all ports, sending the sFlow telemetry to the sFlow analyzer at 203.0.113.100
flow tracking mirror-on-drop
  sample limit 100 pps
  !
  tracker SFLOW
    exporter SFLOW
      format sflow
      collector sflow
      local interface Management0
  no shutdown
The above commands add sFlow Dropped Packet Notification Structures to the sFlow telemetry feed using Broadcom Mirror on Drop (MoD) instrumentation. Broadcom implements mirror-on-drop in Jericho 2, Trident 3, and Tomahawk 3, Continue reading
VyOS 1.4 LTS released
 |
| Protectli Vault - 4 Port |
The VyOS 1.4.0 (Sagitta) LTS release announcement is exciting news! VyOS is an open source router operating system based on Linux that can be installed on commodity PC hardware - for optimal performance at least 1GB RAM and 4GB of storage space is recommended.
The new 1.4 LTS release includes a significantly enhanced implementation of industry standard sFlow telemetry based on the open source Host sFlow agent.
set system sflow interface eth0
set system sflow interface eth1
set system sflow interface eth2
set system sflow interface eth3
set system sflow polling 30
set system sflow sampling-rate 1000
set system sflow drop-monitor-limit 50
set system sflow server 192.0.2.100
Enter the commands above to enable sFlow monitoring on interfaces eth0, eth1, eth2, and eth3. Interface counters will be exported every 30 seconds, packets will be sampled with probability 1/1000, and up to 50 packet headers (and drop reasons) per second will collected from packets dropped by the router. The sFlow telemetry stream will be sent to an sFlow collector at 192.0.2.100.
Running Docker on the sFlow collector makes it easy to run a variety of Continue reading
Raspberry Pi 5 network emulation with Containerlab


docker run hello-worldRun the hello-world container to verify that Docker in properly installed and running before proceeding.
git clone https://github.com/sflow-rt/containerlab.gitDownload the sflow-rt/containerlab project from GitHub.
cd containerlab
./run-clab
Start Containerlab.
containerlab deploy -t clos5.ymlStart the 5 stage leaf and spine topology shown at the top of this page. The initial launch may take a couple of minutes as the container images are downloaded for the first time. Once the images are downloaded, the topology deploys in around 10 seconds.
./topo.py clab-clos5Push the topology to the sFlow-RT analytics software.

Raspberry Pi 5 real-time network analytics
 |
| CanaKit Raspberry Pi 5 Starter Kit - Aluminum |


ssh [email protected]Use ssh to log into Raspberry Pi (having installled the micro SD card).
sudo apt-get update && sudo apt-get -y upgradeUpdate packages and OS to latest version.
curl Continue reading