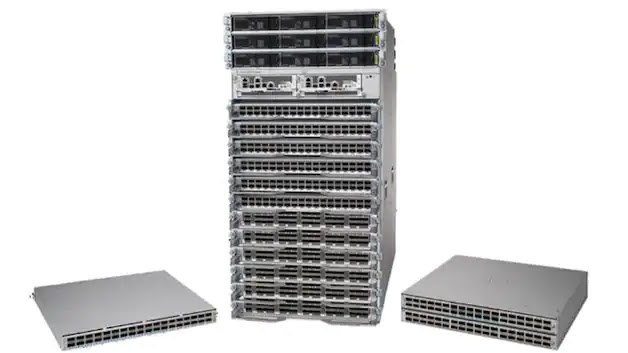
Cisco ASR 9000 Series Routers
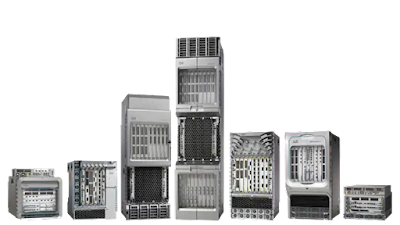
Cisco already supports industry standard sFlow telemetry across a range of products and the recent IOS-XR Release 7.5.1 extends support to Cisco ASR 9000 Series Routers.
Note: The ASR 9000 series routers also support Cisco Netflow. Rapidly detecting large flows, sFlow vs. NetFlow/IPFIX describes why you should choose sFlow if you are interested in real-time monitoring and control applications.
The following commands configure an ASR 9000 series router to sample packets at 1-in-20,000 and stream telemetry to an sFlow analyzer (192.127.0.1) on UDP port 6343.
flow exporter-map SF-EXP-MAP-1
 version sflow v5
 !
 packet-length 1468
 transport udp 6343
 source GigabitEthernet0/0/0/1
 destination 192.127.0.1
 dfbit set
!
Configure the sFlow analyzer address in an exporter-map.
flow monitor-map SF-MON-MAP
 record sflow
 sflow options
  extended-router
  extended-gateway
  if-counters polling-interval 300
  input ifindex physical
  output ifindex physical
 !
 exporter SF-EXP-MAP-1
!
Configure sFlow options in a monitor-map.
sampler-map SF-SAMP-MAP
 random 1 out-of 20000
!
Define the sampling rate in a sampler-map.
interface GigabitEthernet0/0/0/3
 flow datalinkframesection monitor-map SF-MON-MAP sampler SF-SAMP-MAP ingress
Enable sFlow on each interface for complete visibilty into network traffic.
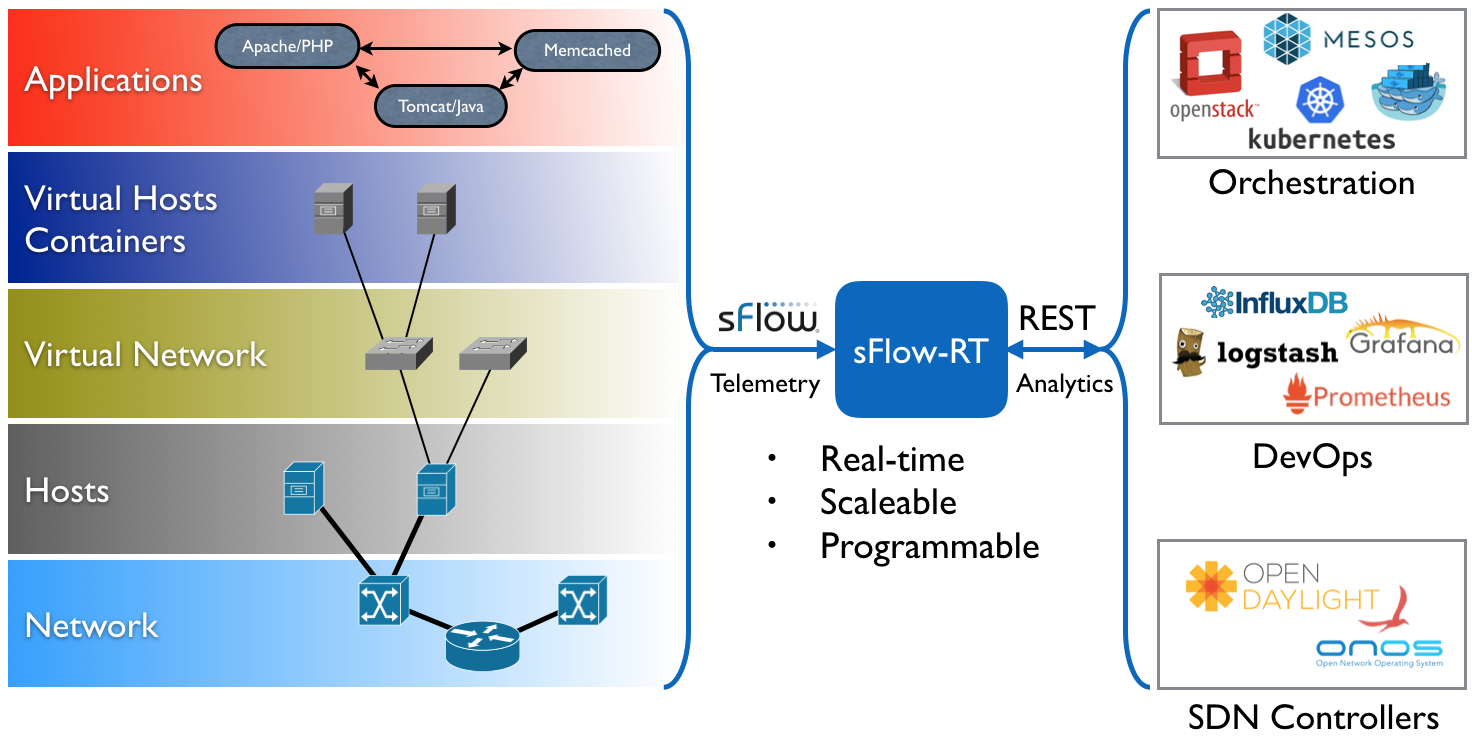
The diagram shows the general architecture of an sFlow monitoring deployment. All the switches stream sFlow telemetry to a central sFlow analyzer for network Continue reading
Real-time Kubernetes cluster monitoring example


The Sunburst Process chart provides an up to the second view of the cluster-wide share of CPU resources used by each namespace.

The Sunburst DNS chart shows a real-time view of network activity generated by each namespace. The chart is produced by looking up DNS names for network addresses observed in packet flows using the Kubernetes DNS service. The domain names contain information about the namespace, service, and node generating the packets. Most traffic is exchanges between nodes within the cluster (identified as local). The external (not local) traffic is also shown by DNS name.

The Sunburst Protocols chart shows the different network protocols being used to communicate between nodes in the cluster. The chart shows the IP over IP tunnel traffic used for network virtualization.

Clicking on a segment in the Sunburst Protocols chart allows the selected traffic to be examined in detail using the Flow Browser. In this example, Continue reading
Sunburst

docker run -p 8008:8008 -p 6343:6343/udp sflow/prometheusThe pre-built sflow/prometheus Docker image packages sFlow-RT with the applications for exploring real-time sFlow analytics. Run the command above, configure network devices to send sFlow to the application on UDP port 6343 (the default sFlow port) and connect with a web browser to port 8008 to access the user interface.
The chart at the top of this article demonstrates the visibility that sFlow can provide into nested protocol stacks that result from network virtualization. For example, the most deeply nested set of protocols shown in the chart is:
- eth: Ethernet
- q: IEEE 802.1Q VLAN
- trill: Transparent Interconnection of Lots of Links (TRILL)
- eth: Ethernet
- q: IEEE 802.1Q VLAN
- ip: Internet Protocol (IP) version 4
- udp: User Datagram Protocol (UDP)
- vxlan: Virtual eXtensible Local Area Network (VXLAN)
- eth: Ethernet
- ip Internet Protocol (IP) version 4
- esp IPsec Encapsulating Continue reading
InfluxDB Cloud

InfluxDB Cloud is a cloud hosted version of InfluxDB. The free tier makes it easy to try out the service and has enough capability to satisfy simple use cases. In this article we will explore how metrics based on sFlow streaming telemetry can be pushed into InfluxDB Cloud.
The diagram shows the elements of the solution. Agents in host and network devices are configured to stream sFlow telemetry to an sFlow-RT real-time analytics engine instance. The Telegraf Agent queries sFlow-RT's REST API for metrics and pushes them to InfluxDB Cloud.
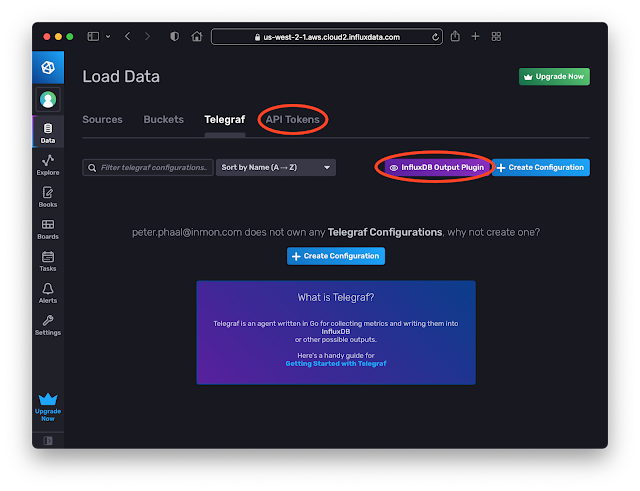 Create an InfluxDB Cloud account. Click the Data tab. Click on the Telegraf option and the InfluxDB Output Plugin button to get the URL to post data. Click the API Tokens option and generate a token.
docker run -p 8008:8008 -p 6343:6343/udp --name sflow-rt -d sflow/prometheus
Use Docker to run the pre-built sflow/prometheus image which packages sFlow-RT with the sflow-rt/prometheus application. Configure sFlow agents to stream data to this instance.

[agent]
  interval = "15s"
  round_interval = true
  metric_batch_size = 5000
  metric_buffer_limit = 10000
  collection_jitter = "0s"
  flush_interval = "10s"
  flush_jitter = "0s"
  precision = "1s"
  hostname = ""
  omit_hostname = true

[[outputs.influxdb_v2]]
  urls = ["INFLUXDB_CLOUD_URL"]
  token =  Continue reading
Telegraf sFlow input plugin

The Telegraf agent is bundled with an SFlow Input Plugin for importing sFlow telemetry into the InfluxDB time series database. However, the plugin has major caveats that severely limit the value that can be derived from sFlow telemetry.
Currently only Flow Samples of Ethernet / IPv4 & IPv4 TCP & UDP headers are turned into metrics. Counters and other header samples are ignored.
Series Cardinality Warning
This plugin may produce a high number of series which, when not controlled for, will cause high load on your database.
InfluxDB 2.0 released describes how to use sFlow-RT to convert sFlow telemetry into useful InfluxDB metrics.

Using sFlow-RT overcomes the limitations of the Telegraf sFlow Input Plugin, making it possible to fully realize the value of sFlow monitoring:
- Counters are a major component of sFlow, efficiently streaming detailed network counters that would otherwise need to be polled via SNMP. Counter telemetry is ingested by sFlow-RT and used to compute an extensive set of Metrics that can be imported into InfluxDB.
- Flow Samples are fully decoded by sFlow-RT, yielding visibility that extends beyond the basic Ethernet / IPv4 / TCP / UDP header metrics supported by the Telegraf plugin to include ARP, ICMP, Continue reading
Grafana Cloud
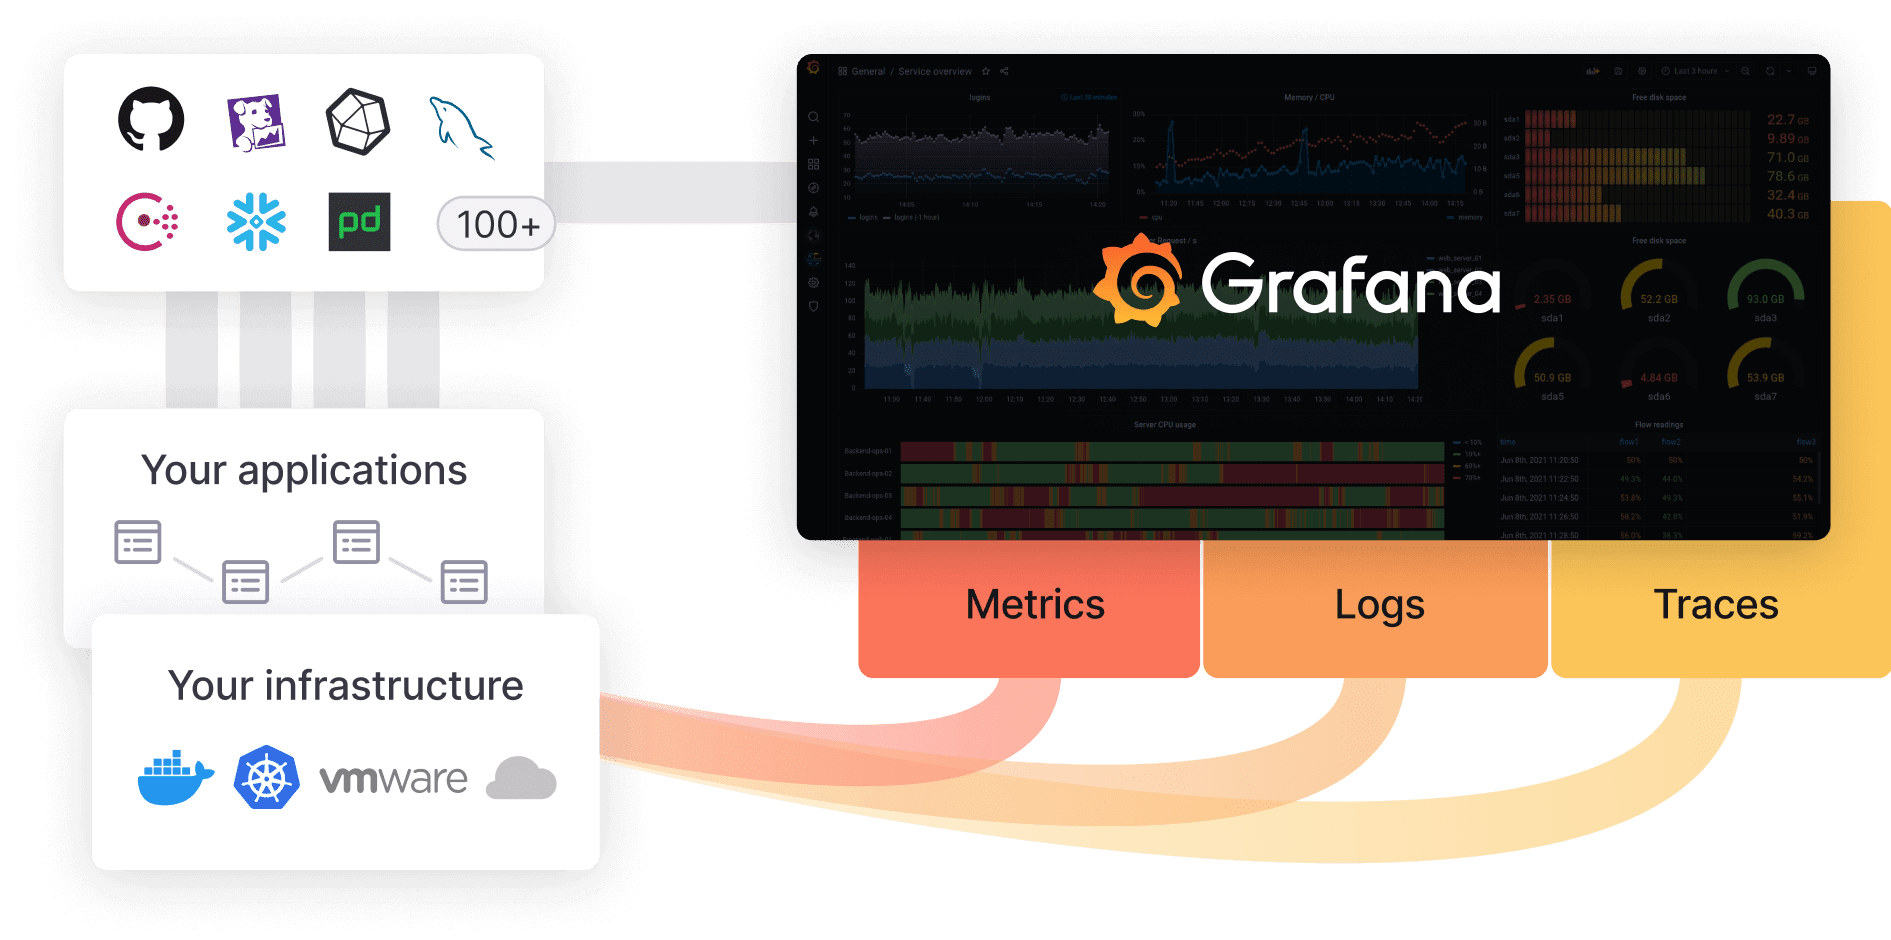
Grafana Cloud is a cloud hosted version of Grafana, Prometheus, and Loki. The free tier makes it easy to try out the service and has enough capability to satisfy simple use cases. In this article we will explore how metrics based on sFlow streaming telemetry can be pushed into Grafana Cloud.

docker run -p 8008:8008 -p 6343:6343/udp --name sflow-rt -d sflow/prometheusUse Docker to run the pre-built sflow/prometheus image which packages sFlow-RT with the sflow-rt/prometheus application. Configure sFlow agents to stream data to this instance.
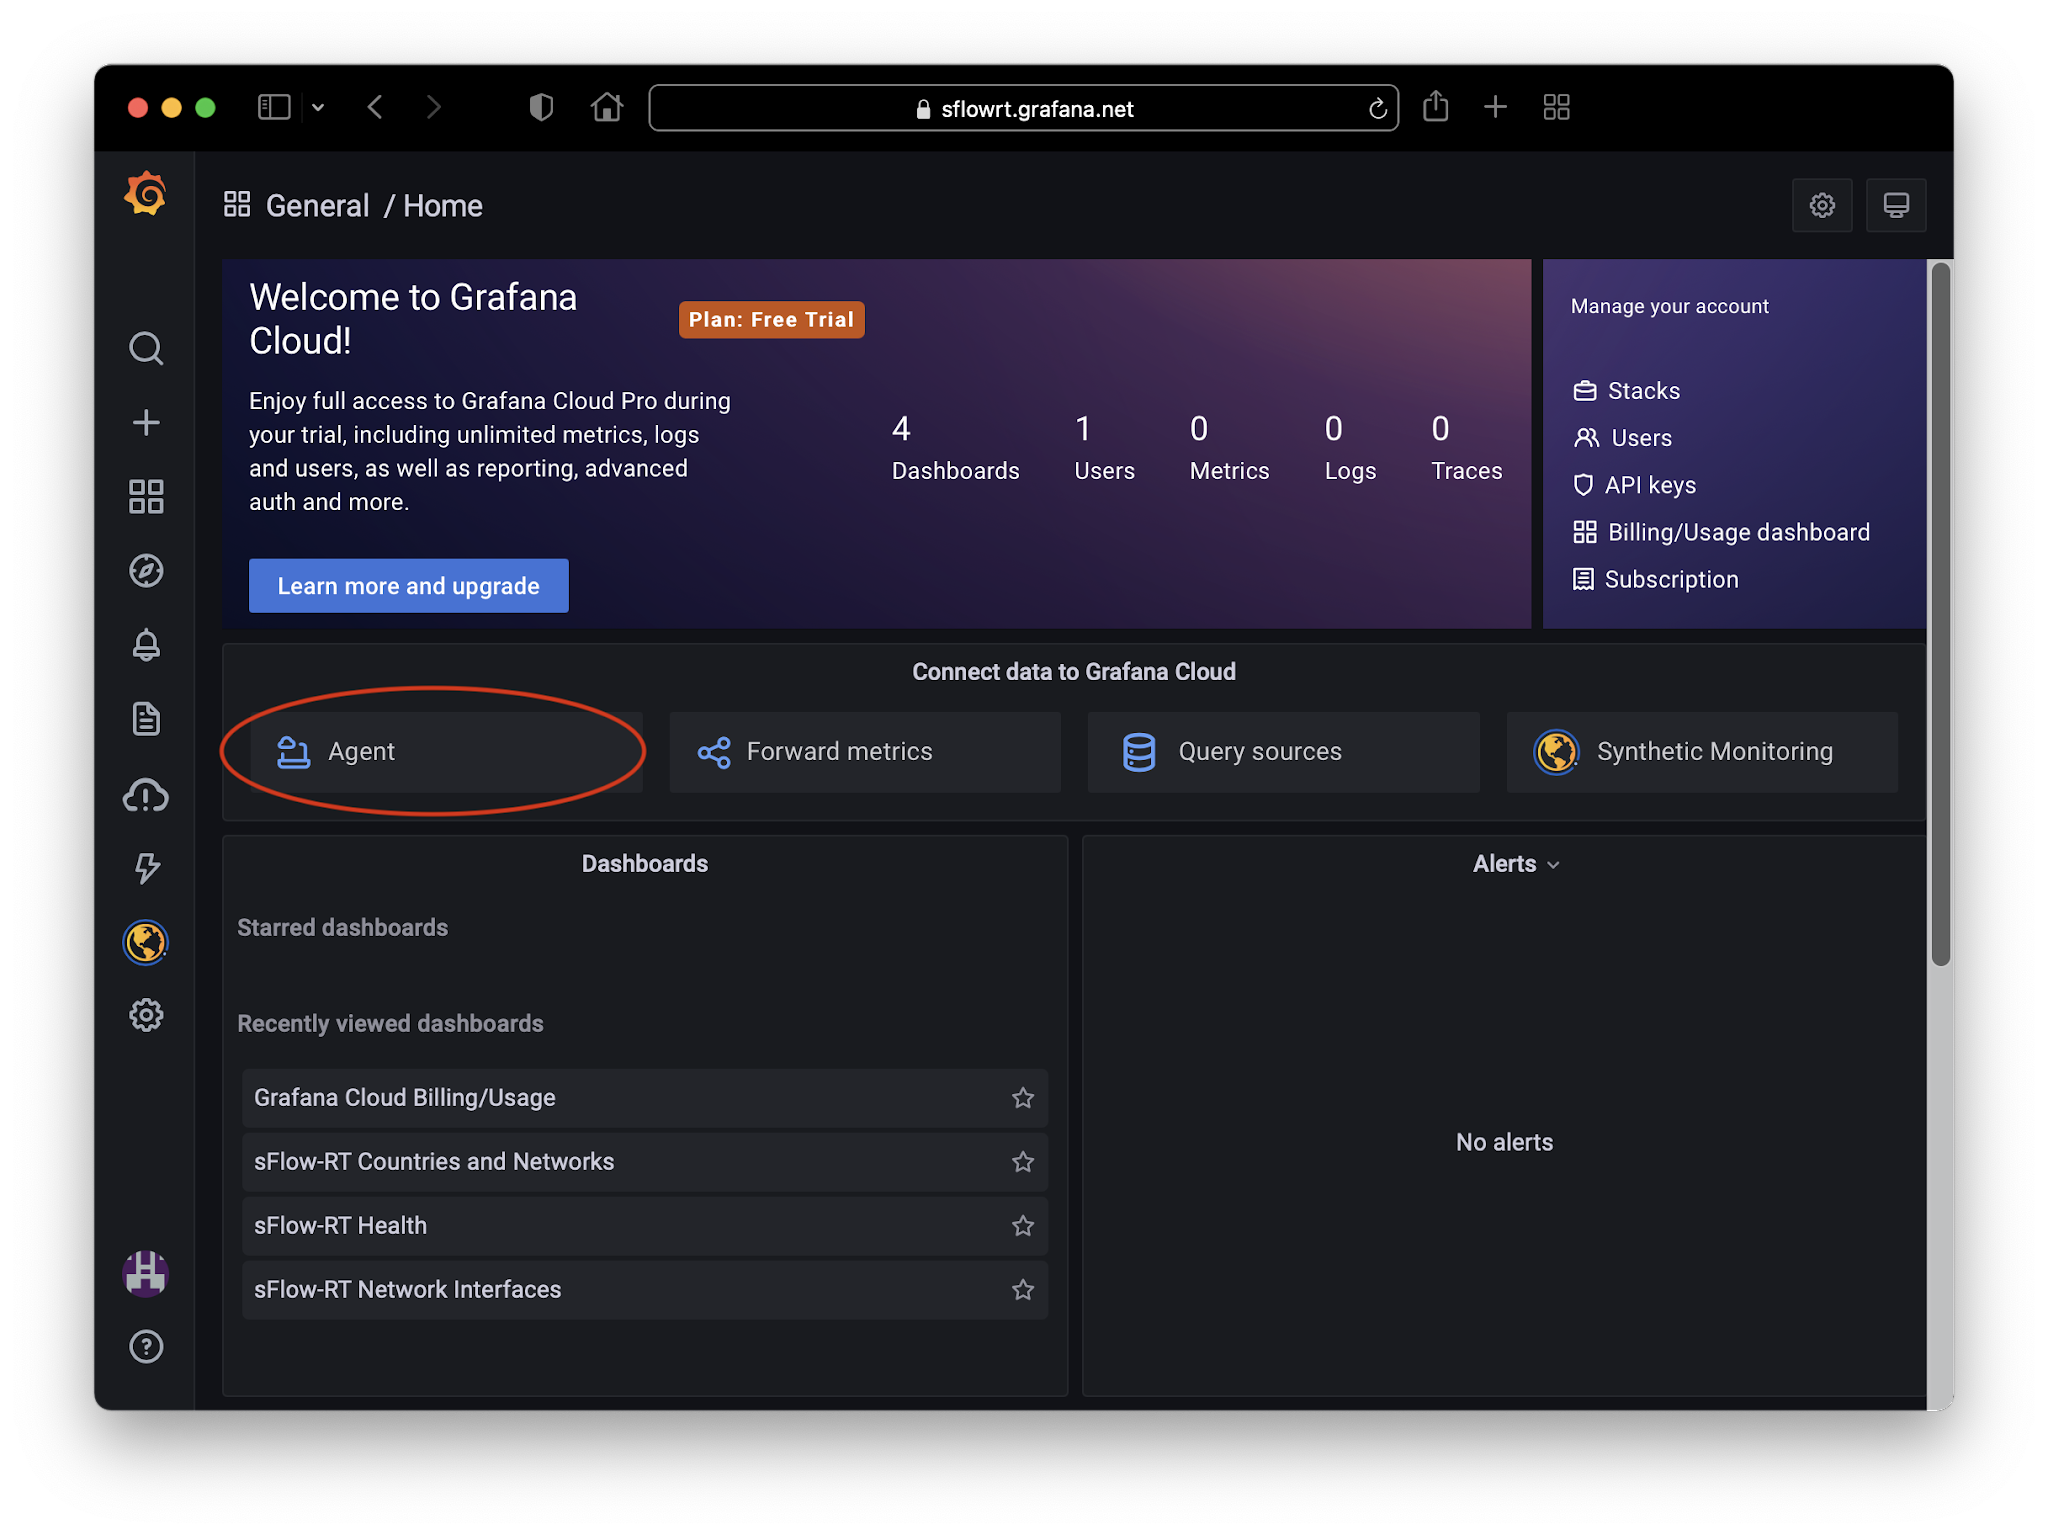
Create a Grafana Cloud account. Click on the Agent button on the home page to get the configuration settings for the Grafana Agent.
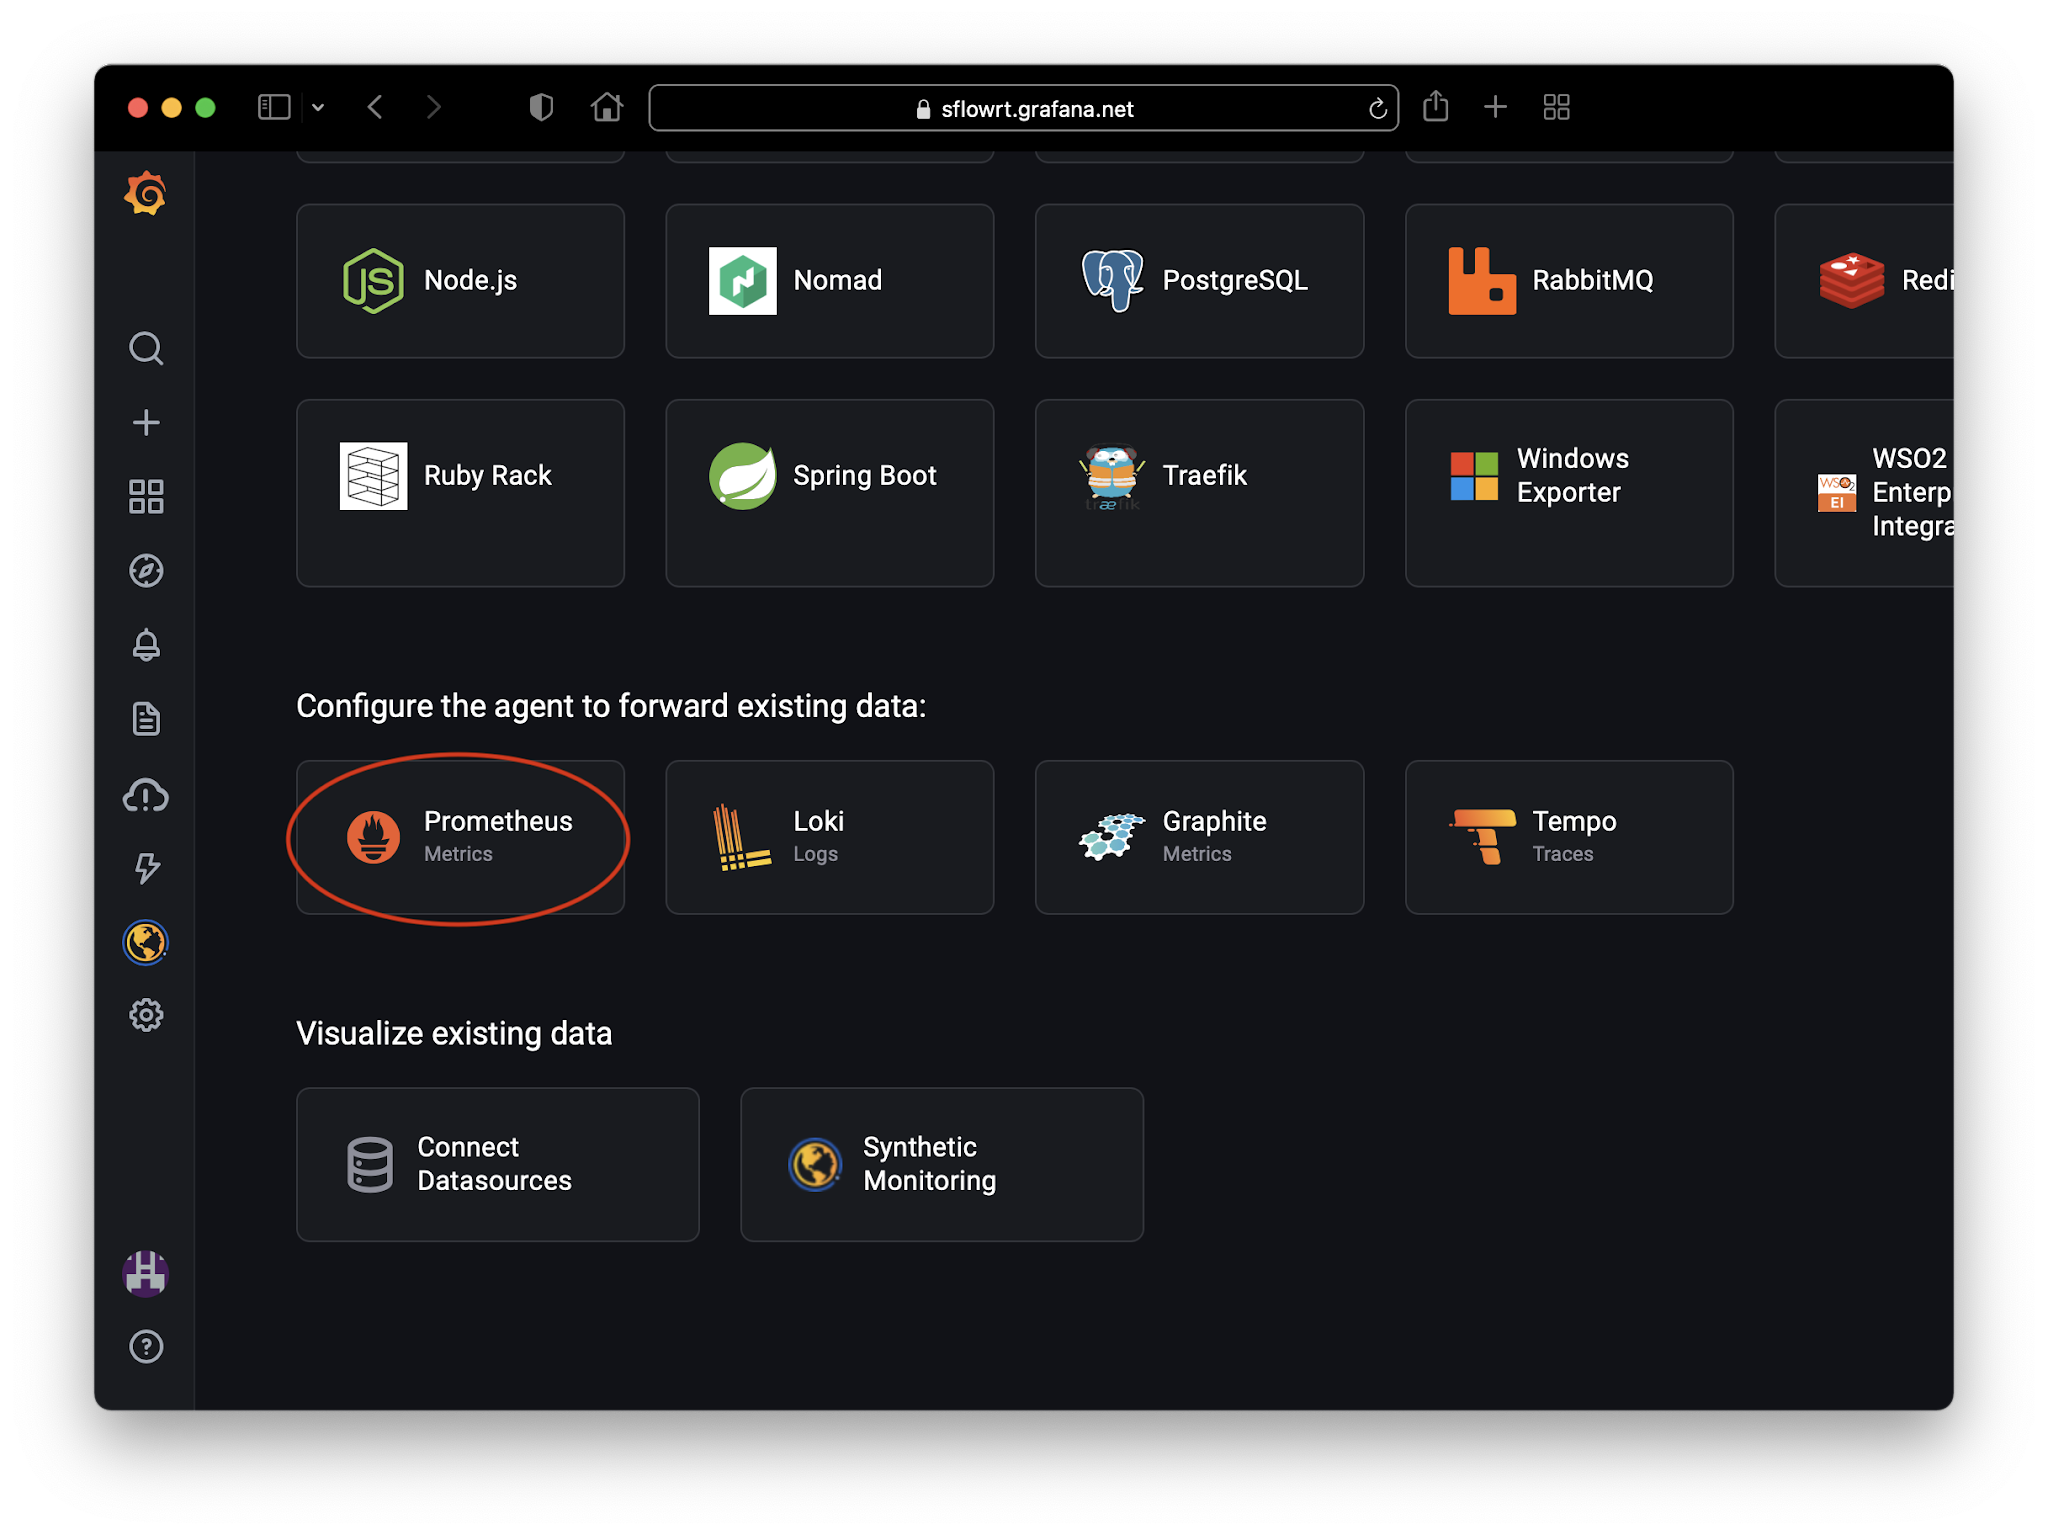
Click on the Prometheus button to get the configuration to forward metrics from the Grafana Agent.

server:
   Continue reading
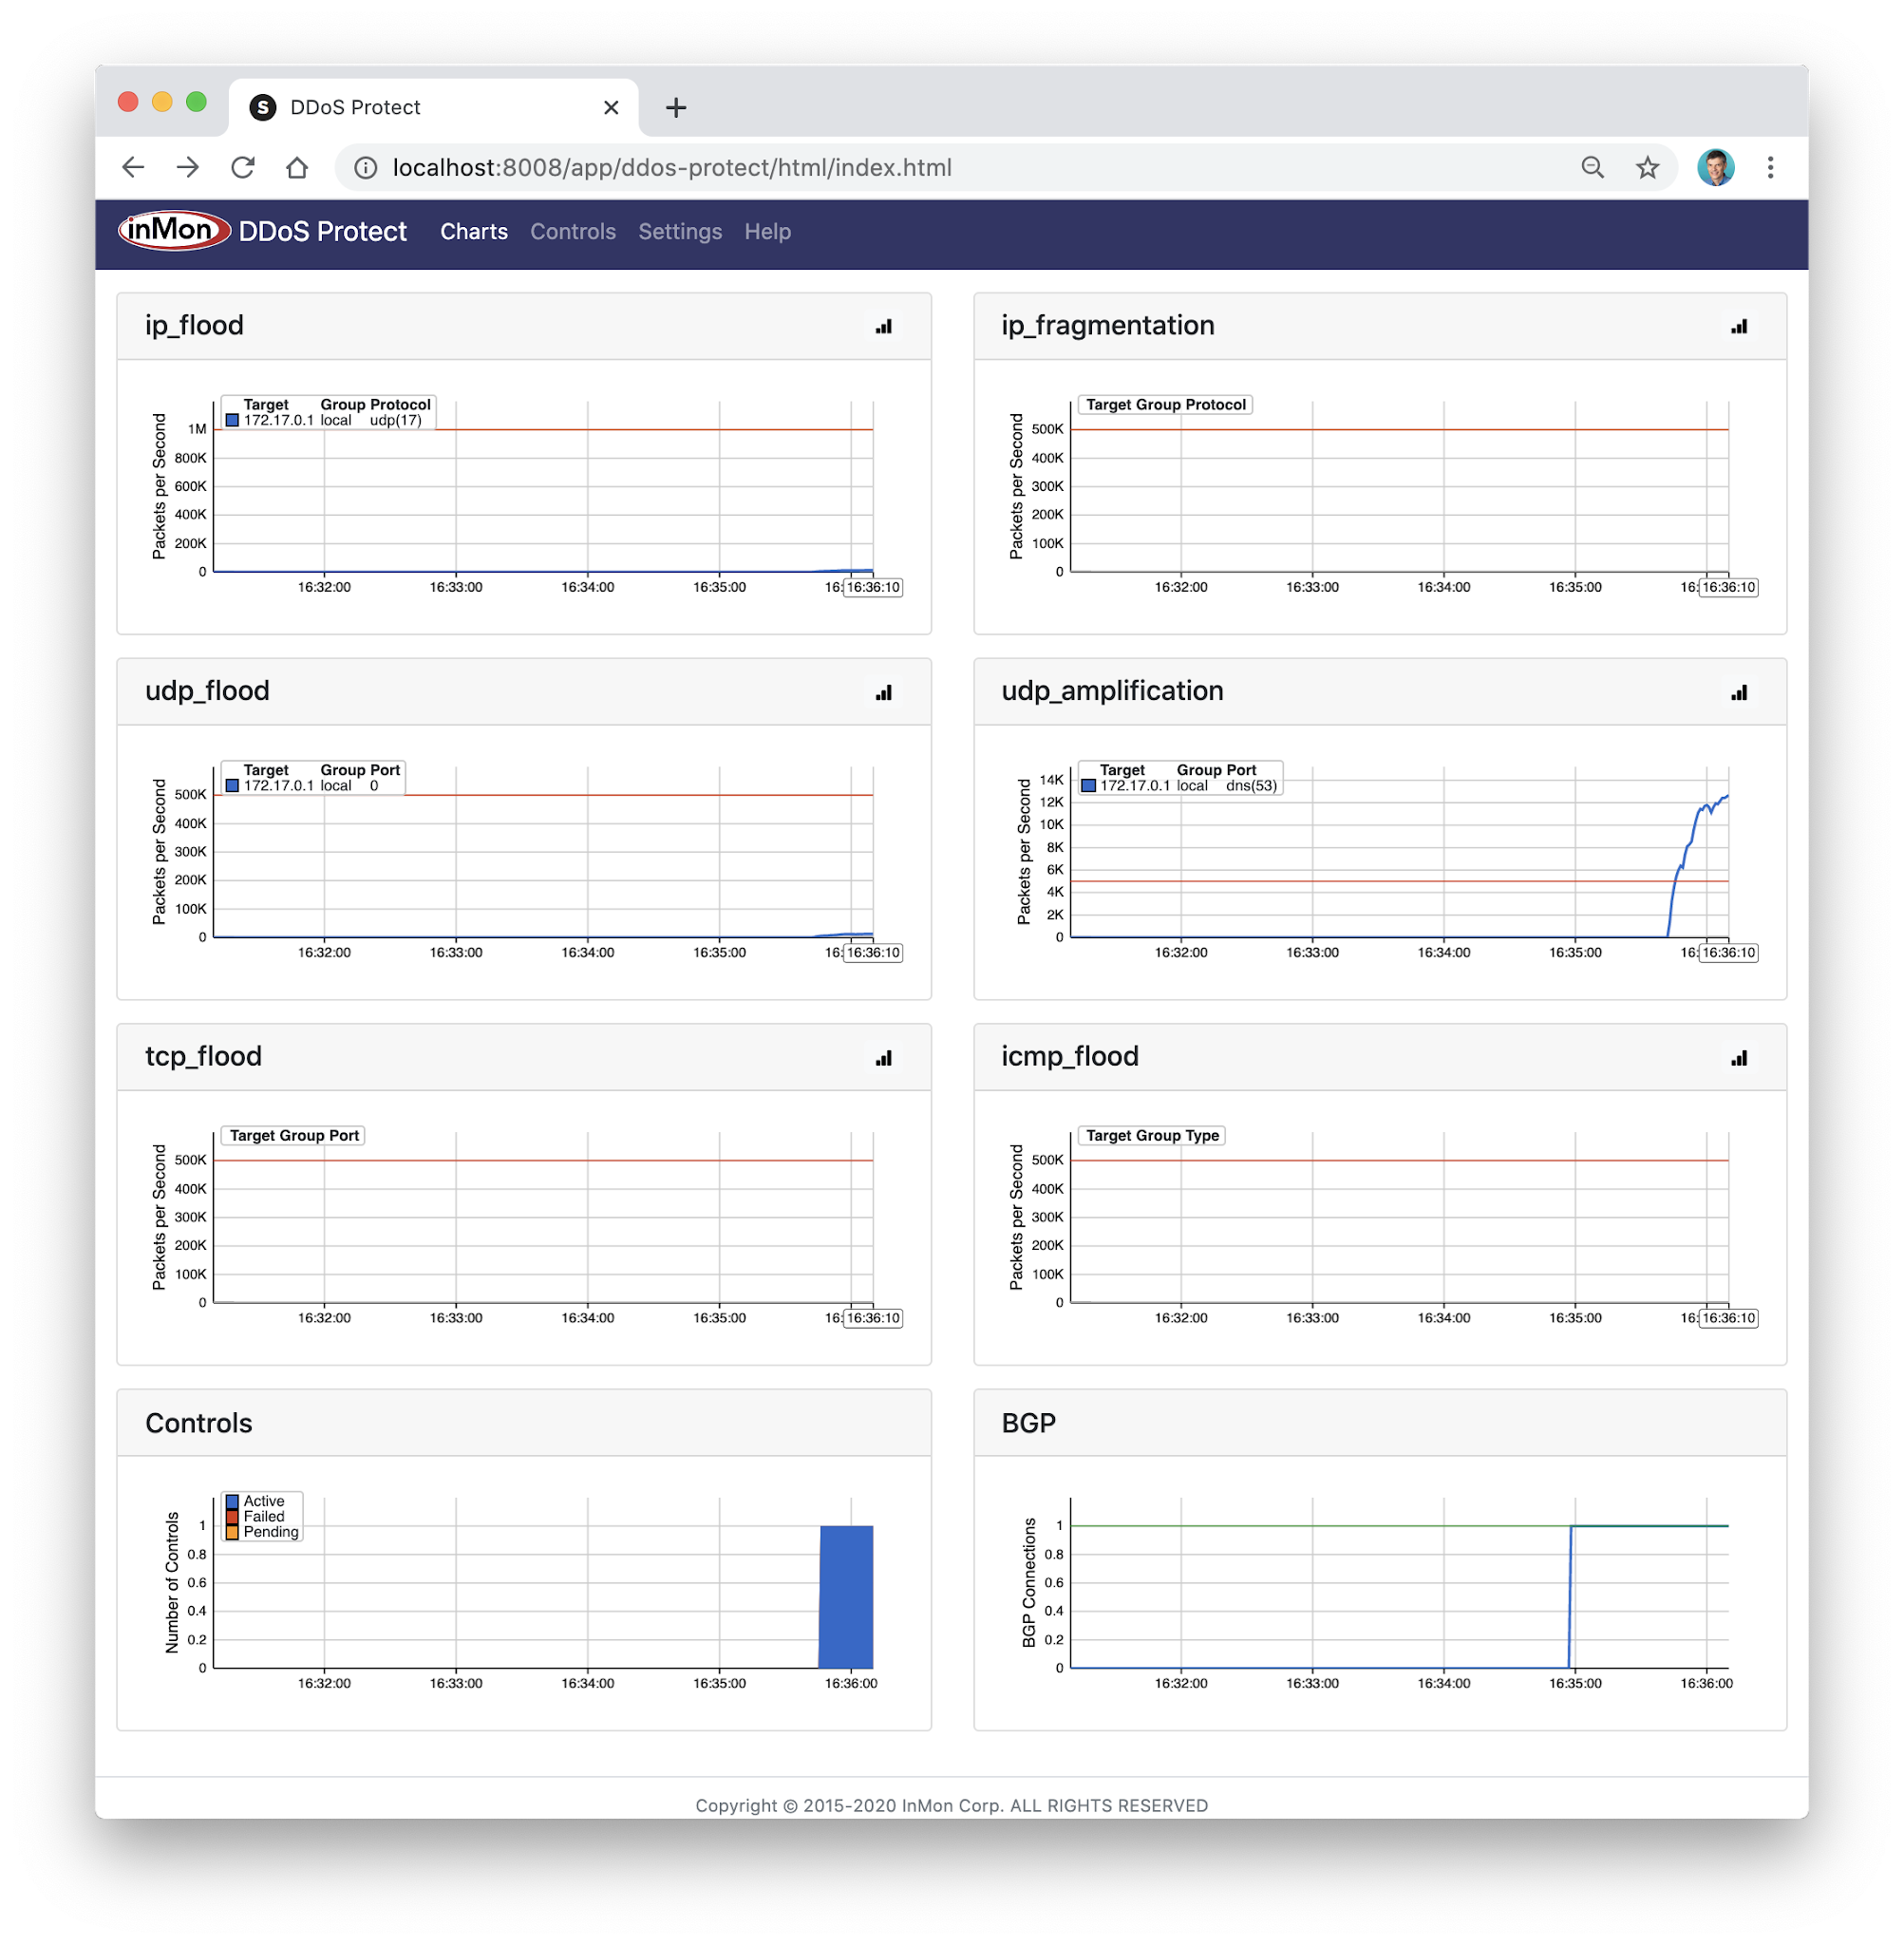
DDoS protection quickstart guide

This document pulls together links to a number of articles that describe how you can quickly try out DDoS Protect and get it running in your environment:
- Docker DDoS testbed describes how Docker Desktop can be used to try out DDoS Protect on your laptop using simulated DDoS attacks.
- FRR builds on the Docker testbed by including the open source FRRouting engine.
- Real-time DDoS mitigation using BGP RTBH and FlowSpec describes how configure DDoS Protect to work with Arista / EOS routers
- DDoS Mitigation with Juniper, sFlow, and BGP Flowspec describes how to configure DDoS Protect to work with Juniper / Junos routers.
- DDoS Mitigation with Cisco, sFlow, and BGP Flowspec describes how to configure DDoS Protect to work with Cisco / IOS XR routers.
- DDoS protection of local address space describes how to configure DDoS Protect to automatically classify address space.
- Pushing BGP Flowspec rules to multiple routers describes how to configure DDoS protect to send migitgation rules to mulitple Continue reading
Containernet
Containernet is a fork of the Mininet network emulator that uses Docker containers as hosts in emulated network topologies.
Multipass describes how build a Mininet testbed that provides real-time traffic visbility using sFlow-RT. This article adapts the testbed for Containernet.
multipass launch --name=containernet bionic
multipass exec containernet -- sudo apt update
multipass exec containernet -- sudo apt -y install ansible git aptitude default-jre
multipass exec containernet -- git clone https://github.com/containernet/containernet.git
multipass exec containernet -- sudo ansible-playbook -i "localhost," -c local containernet/ansible/install.yml
multipass exec containernet -- sudo /bin/sh -c "cd containernet; make develop"
multipass exec containernet -- wget https://inmon.com/products/sFlow-RT/sflow-rt.tar.gz
multipass exec containernet -- tar -xzf sflow-rt.tar.gz
multipass exec containernet -- ./sflow-rt/get-app.sh sflow-rt mininet-dashboard
Run the above commands in a terminal to create the Containernet virtual machine.
multipass list
List the virtual machines
Name                    State             IPv4             Image
primary                 Stopped           --               Ubuntu 20.04 LTS
containernet            Running           192.168.64.12    Ubuntu 18.04 LTS
                                          172.17.0.1
Find the IP address of the mininet virtual machine we just created (192.168.64.12).
multipass exec containernet -- ./sflow-rt/start.sh
Start sFlow-RT. Use a web browser to connect to the VM and Continue reading
Netdev 0x15


Network wide visibility with Linux networking and sFlow describes the Linux switchdev driver used to integrate network hardware with Linux. The talk focuses on network telemetry, showing how standard Linux APIs are used to configure hardware instrumentation and stream telemetry using the industry standard sFlow protocol for data center wide visibility.

Switchdev in the wild describes Yandex's experience of deploying Linux switchdev based switches in production at scale. The diagram from the talk shows the three layer leaf and spine network architecture used in their data centers. Yandex operates multiple data centers, each containing up to 100,000 servers.

Switchdev Offload Workshop provides updates about the latest developments in the switchdev community.

FRR Workshop discusses the latest development in the FRRouting project, the open source routing software that is now a defacto standard on Linux network operating systems.
Nokia Service Router Linux
Nokia Service Router Linux (SR-Linux) is an open source network operating system running on Nokia's merchant silicon based data center switches.
The following commands configure SR-Linux to sample packets at 1-in-10000, poll counters every 20 seconds and stream standard sFlow telemetry to an analyzer (192.168.10.20) using the default sFlow port 6343:
system {
    sflow {
        admin-state enable
        sample-rate 10000
        collector 1 {
            collector-address 192.168.10.20
            network-instance default
            source-address 192.168.1.1
            port 6343
        }
    }
}
For each interface:
interface ethernet-1/1 {
    admin-state enable
    sflow {
        admin-state enable
    }
}
Enable sFlow on all switches and ports in the data center fabric for comprehensive visibility.
docker run --name sflow-rt -p 8008:8008 -p 6343:6343/udp -d sflow/prometheusA simple way to get started is to run the Docker sflow/prometheus image on the sFlow analyzer host (192.168.10.20 in the example config) to run sFlow-RT with useful applications to explore the telemetry. Access the web interface at http://192.168.10.20:8008.
DDoS mitigation using a Linux switch
Linux as a network operating system describes the benefits of using standard Linux as a network operating system for hardware switches. A key benefit is that the behavior of the physical network can be efficiently emulated using standard Linux virtual machines and/or containers.
In this article, CONTAINERlab will be used to create a simple testbed that can be used to develop a real-time DDoS mitigation controller. This solution is highly scaleable. Each hardware switch can monitor and filter terabits per second of traffic and a single controller instance can monitor and control hundreds of switches.
Create test network
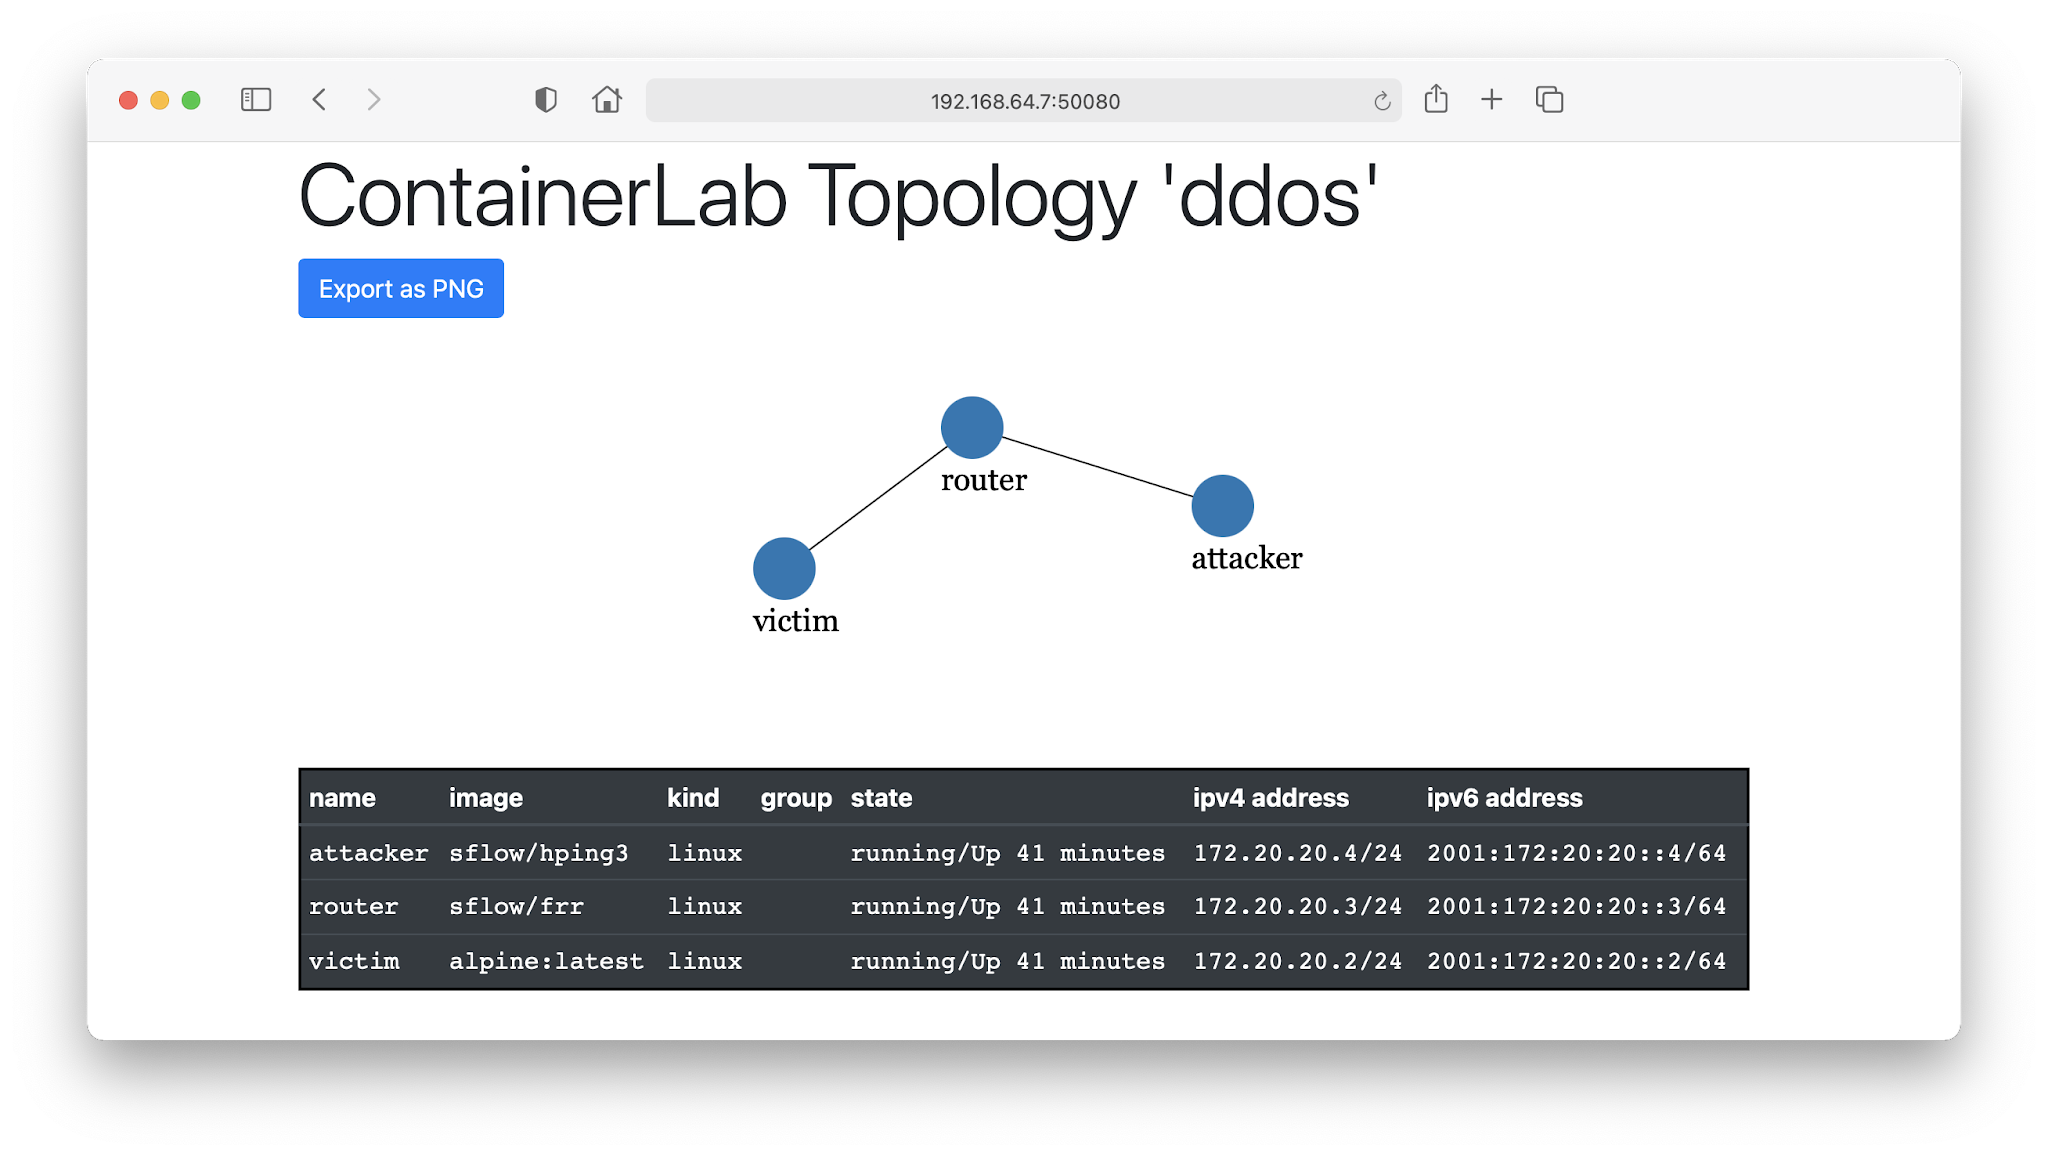
The following ddos.yml file specifies the testbed topology (shown in the screen shot at the top of this article):
name: ddos
topology:
  nodes:
    router:
      kind: linux
      image: sflow/frr
    attacker:
      kind: linux
      image: sflow/hping3
    victim:
      kind: linux
      image: alpine:latest
  links:
    - endpoints: ["router:swp1","attacker:eth1"]
    - endpoints: ["router:swp2","victim:eth1"]
Run the following command to run the emulation:
sudo containerlab deploy ddos.yml
Configure interfaces on router:
interface swp1
 ip address 192.168.1.1/24
!
interface swp2
 ip address 192.168.2.1/24
!
Configure attacker interface:
ip addr add 192.168.1.2/24 dev eth1
ip route add 192.168.2.0/24 via 192.168.1. Continue reading
Linux as a network operating system

NVIDIA Linux Switch enables any standard Linux distribution to be used as the operating system on the NVIDIA Spectrum™ switches. Unlike network operating systems that are Linux based, where you are limited to a specific version of Linux and control of the hardware is restricted to vendor specific software modules, Linux Switch allows you to install an unmodified version of your favorite Linux distribution along with familiar Linux monitoring and orchestration tools.
The key to giving Linux control of the switch hardware is the switchdev module - a standard part of recent Linux kernels. Linux switchdev is an in-kernel driver model for switch devices which offload the forwarding (data) plane from the kernel. Integrating switch ASIC drivers in the Linux kernel makes switch ports appear as additional Linux network interfaces that can be configured and managed using standard Linux tools.
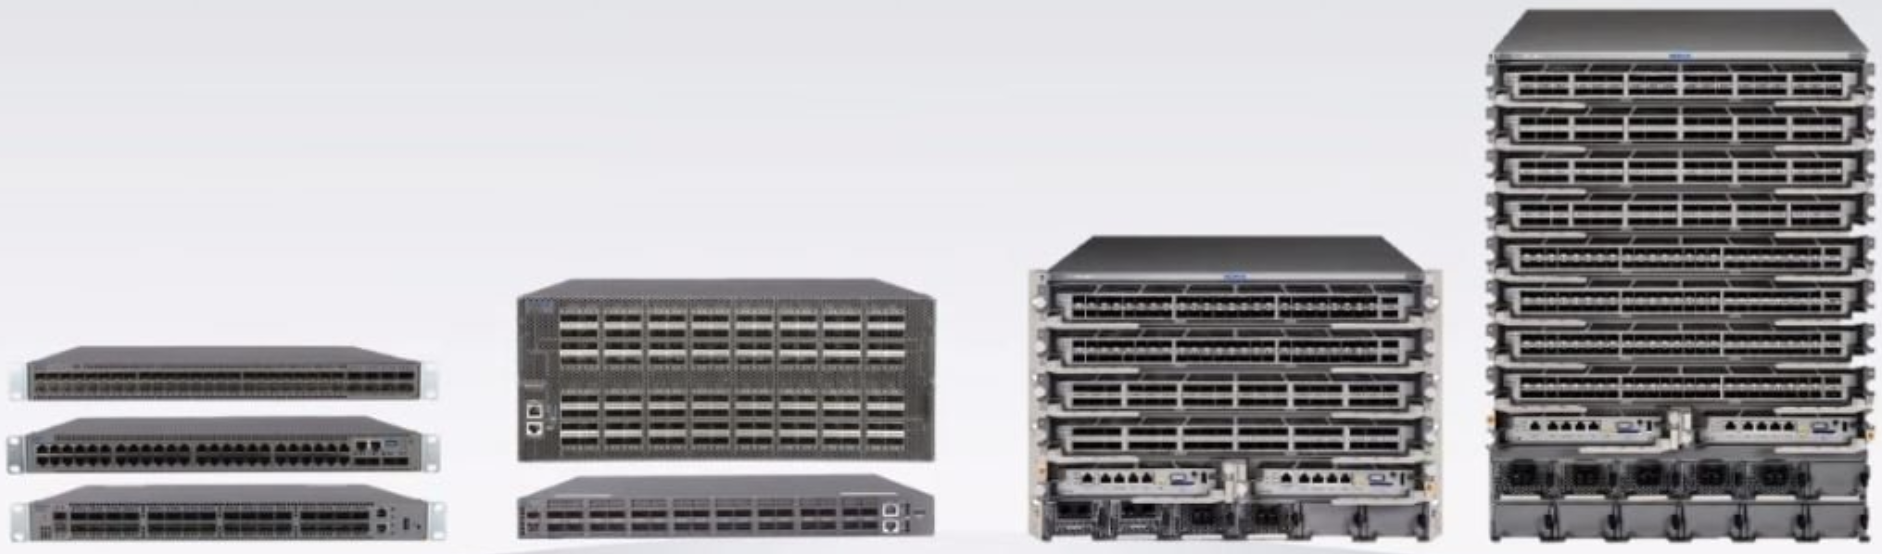
The mlxsw wiki provides instructions for installing Linux using ONIE or PXE boot on Mellanox switch hardware, for example, on NVIDIA® Spectrum®-3 based SN4000 series switches, providing 1G - 400G port speeds to handle scale-out data center applications.
Major benefits of using standard Linux as the switch operating system include:
- no licensing fees, feature restrictions, or license management Continue reading
Cisco 8000 Series routers
Cisco 8000 Series routers are "400G optimized platforms that scale from 10.8 Tbps to 260 Tbps." The routers are built around Cisco Silicon One™ ASICs. The Silicon One ASIC includes the instrumentation needed to support industry standard sFlow real-time streaming telemetry.
Note: The Cisco 8000 Series routers also support Cisco Netflow. Rapidly detecting large flows, sFlow vs. NetFlow/IPFIX describes why you should choose sFlow if you are interested in real-time monitoring and control applications.
The following commands configure a Cisco 8000 series router to sample packets at 1-in-20,000 and stream telemetry to an sFlow analyzer (192.127.0.1) on UDP port 6343.
flow exporter-map SF-EXP-MAP-1
 version sflow v5
 !
 packet-length 1468
 transport udp 6343
 source GigabitEthernet0/0/0/1
 destination 192.127.0.1
 dfbit set
!
Configure the sFlow analyzer address in an exporter-map.
flow monitor-map SF-MON-MAP
 record sflow
 sflow options
  extended-router
  extended-gateway
  if-counters polling-interval 300
  input ifindex physical
  output ifindex physical
 !
 exporter SF-EXP-MAP-1
!
Configure sFlow options in a monitor-map.
sampler-map SF-SAMP-MAP
 random 1 out-of 20000
!
Define the sampling rate in a sampler-map.
interface GigabitEthernet0/0/0/3
 flow datalinkframesection monitor-map SF-MON-MAP sampler SF-SAMP-MAP ingress
Enable sFlow on each interface for complete visibilty into network traffic.
The above configuration instructions are for IOS-XR. Continue reading
CONTAINERlab

CONTAINERlab is a Docker orchestration tool for creating virtual network topologies. This article describes how to build and monitor the leaf and spine topology shown above.
Note: Docker testbed describes a simple testbed for experimenting with sFlow analytics using Docker Desktop, but it doesn't have the ability to construct complex topologies.
multipass launch --cpus 2 --mem 4G --name containerlab
multipass shell containerlab
The above commands use the multipass command line tool to create an Ubuntu virtual machine and open shell access.
sudo apt update
sudo apt -y install docker.io
bash -c "$(curl -sL https://get-clab.srlinux.dev)"
Type the above commands into the shell to install CONTAINERlab.
Note: Multipass describes how to build a Mininet network emulator to experiment with software defined networking.
name: test
topology:
  nodes:
    leaf1:
      kind: linux
      image: sflow/frr
    leaf2:
      kind: linux
      image: sflow/frr
    spine1:
      kind: linux
      image: sflow/frr
    spine2:
      kind: linux
      image: sflow/frr
    h1:
      kind: linux
      image: alpine:latest
    h2:
      kind: linux
      image: alpine:latest
  links:
    - endpoints: ["leaf1:eth1","spine1:eth1"]
    - endpoints: ["leaf1:eth2","spine2:eth1"]
    - endpoints: ["leaf2:eth1","spine1:eth2"]
    - endpoints: ["leaf2:eth2","spine2:eth2"]
    - endpoints: ["h1:eth1","leaf1:eth3"]
    - endpoints: ["h2:eth1","leaf2:eth3"]
The test.yml file shown above specifies the topology. In this case we are using FRRouting (FRR) containers for the leaf Continue reading
In-band Network Telemetry (INT)

The recent addition of in-band streaming telemetry (INT) measurements to the sFlow industry standard simplifies deployment by addressing the operational challenges of in-band monitoring.

The diagram shows the basic elements of In-band Network Telemetry (INT) in which the ingress switch is programmed to insert a header containing measurements to packets entering the network. Each switch in the path is programmed to append additional measurements to the packet header. The egress switch is programmed to remove the header so that the packet can be delivered to its destination. The egress switch is responsible for processing the measurements or sending them on to analytics software.
There are currently two competing specifications for in-band telemetry:
Common telemetry attributes from both standards include:
- node id
- ingress port
- egress port
- transit delay (egress timestamp - ingress timestamp)
- queue depth
Visibility into network forwarding performance is very useful, however, there are practical issues that should be considered with the in-band telemetry approach for collecting the measurements:
- Transporting measurement headers is complex with different encapsulations for each transport protocol: Geneve, VxLAN, GRE, UDP, TCP etc.
- Addition of headers increases the size of packets and risks causing Continue reading
Transit delay and queueing
The recently finalized sFlow Transit Delay Structures extension provides visibility into the performance of packet forwarding in a switch or router using the industry standard sFlow protocol.
The diagram provides a logical representation of packet forwarding. A packet is received at an Ingress Port, the packet header is examined and a forwarding decision is made to add the packet to one of the queues associated with an Egress Port, finally the packet is removed from the queue and sent out the Egress Port to be received by the next device in the chain.
The time between sending and receiving a packet is the packet's transit delay. The transit delay is affected by the time it takes to make the forwarding decision and the time the packet spends in the queue. Identifying the specific queue selected and the number of bytes already in the queue fills out the set of performance metrics for the forwarding decision. The sFlow Transit Delay Structures extension adds these performance metrics to the metadata associated with each packet sample.
The following output from sflowtool shows that data contained in a packet sample:
startSample ----------------------
sampleType_tag 0:1
sampleType FLOWSAMPLE
sampleSequenceNo 91159
sourceId 0:2216
meanSkipCount  Continue reading
InfluxDB 2.0 released
InfluxData advances possibilities of time series data with general availability of InfluxDB 2.0 announced the production release of InfluxDB 2.0. This article demonstrates how to import sFlow data into InfluxDB 2.0 using sFlow-RT in order to provide visibility into network traffic.
Real-time network and system metrics as a service describes how to use Docker Desktop to replay previously captured sFlow data. Follow the instructions in the article to start an instance of sFlow-RT.
Create a directory for InfluxDB to use to store data and configuration settings:
mkdir dataNow start InfluxDB using the pre-built influxdb image:
docker run --rm --name=influxdb -p 8086:8086 \
-v  $PWD/data:/var/lib/influxdb2 influxdb:alpine \
--nats-max-payload-bytes=10000000
Note: sFlow-RT is collecting metrics for all the sFlow agents embedded in switches, routers, and servers. The default value of nats-max-payload-bytes (1048576) may be too small to hold all the metrics returned when sFlow-RT is queried. The error, nats: maximum payload exceeded, in InfluxDB logs indicates that the limit needs to be increased. In this example, the value has been increased to 10000000.
Now access the InfluxDB web interface at http://localhost:8086/

- sflow-analyzer
URL: http://host.docker.internal:8008/prometheus/analyzer/txt - sflow-metrics
Continue reading
DDoS Mitigation with Juniper, sFlow, and BGP Flowspec

This article discusses how to deploy the DDoS Protect application in a Juniper Networks environment. Juniper has a long history of supporting BGP Flowspec on their routing platforms and Juniper has added support for sFlow to their entire product range, see sFlow available on Juniper MX series routers.
First, Junos doesn't provide a way to connect to the non-standard BGP port (1179) that sFlow-RT uses by default. Allowing sFlow-RT to open the standard BGP port (179) requires that the service be given additional Linux capabilities.
docker run --rm --net=host --sysctl net.ipv4.ip_unprivileged_port_start=0 \
sflow/ddos-protect -Dbgp.port=179
The above command launches the prebuilt sflow/ddos-protect Docker image. Alternatively, if sFlow-RT has been installed as a deb / rpm package, then the required permissions can be added to the service.
sudo systemctl edit sflow-rt.serviceType the above command to edit the Continue reading
Topology
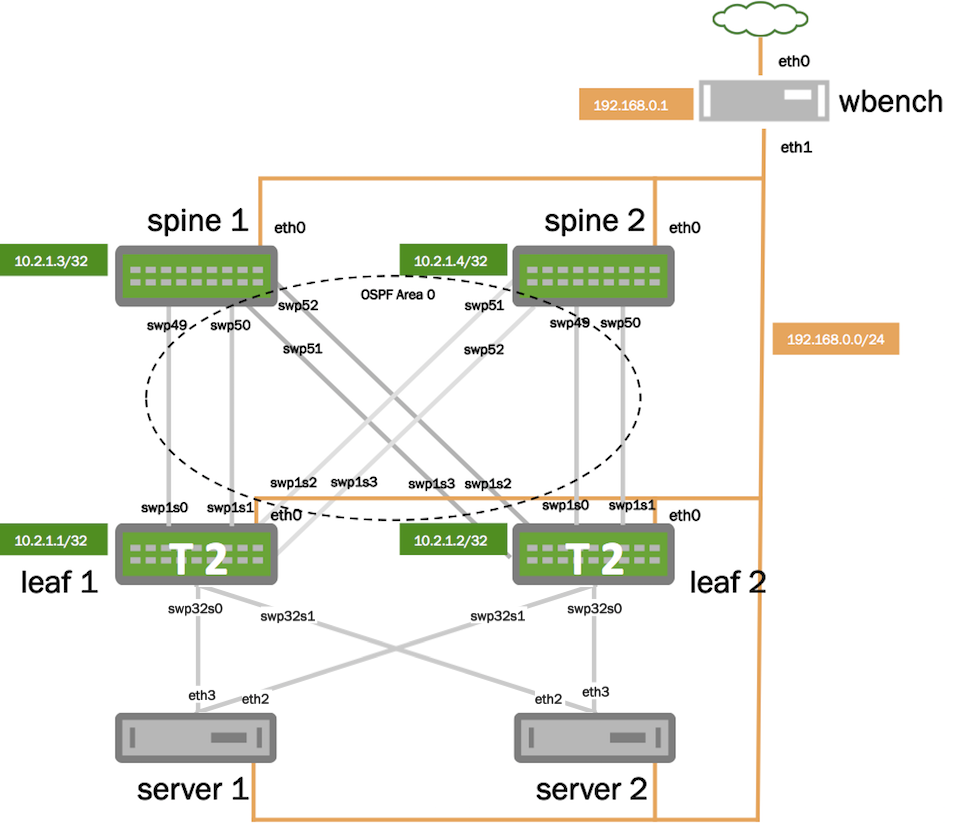
Real-time network and system metrics as a service describes how to use data captured from the network shown above to explore the functionality of sFlow-RT real-time analytics software. This article builds on the previous article to show how knowledge of network topology can be used to enhance analytics, see Topology for documentation.
First, follow the instructions in the previous example and start an instance of sFlow-RT using the captured sFlow.
curl -O https://raw.githubusercontent.com/sflow-rt/fabric-view/master/demo/topology.jsonThen, download the topology file for the example.
curl -X PUT -H "Content-Type: application/json" -d @topology.json \Install the topology using the sFlow-RT REST API.
http://localhost:8008/topology/json
curl http://localhost:8008/topology/jsonRetrieve the topology.
{
 "version": 0,
 "links": {
  "L1": {
   "node2": "spine1",
   "node1": "leaf1",
   "port1": "swp1s0",
   "port2": "swp49"
  },
  "L2": {
   "node2": "spine1",
   "node1": "leaf1",
   "port1": "swp1s1",
   "port2": "swp50"
  },
  "L3": {
   "node2": "spine2",
   "node1": "leaf1",
   "port1": "swp1s2",
   "port2": "swp51"
  },
  "L4": {
   "node2": "spine2",
   "node1": "leaf1",
   "port1": "swp1s3",
   "port2": "swp52"
  },
  "L5": {
   "node2": "spine2",
   "node1": "leaf2",
   "port1": "swp1s0",
   "port2": "swp49"
  },
  "L6": {
   "node2": "spine2",
   "node1": "leaf2",
   "port1": "swp1s1",
   "port2": "swp50"
  },
  "L7": {
   "node2": "spine1",
   "node1": "leaf2",
   "port1": "swp1s2",
   "port2": "swp51"
  },
  "L8": {
   "node2": "spine1",
   "node1": "leaf2",
   "port1": "swp1s3",
   "port2":  Continue reading
FRR
This article uses the Docker DDoS testbed to explore FRRouting's BGP Flowspec capability. Follow the steps in the Docker DDoS testbed article, but instead of running ExaBGP, run the following command to start the pre-built sflow/frr image:
docker run --rm -d --privileged --name frr sflow/frrRun the following command to show the router configuration:
docker exec frr vtysh -c "show running-config"The results will be displayed:
Building configuration...

Current configuration:
!
frr version 7.5_git
frr defaults traditional
hostname ed9e435c6f3d
no ipv6 forwarding
log stdout
!
router bgp 65000
 bgp router-id 0.0.0.1
 neighbor 192.168.65.2 remote-as 65001
 neighbor 192.168.65.2 port 1179
 neighbor 192.168.65.2 ebgp-multihop 255
 neighbor 192.168.65.2 timers connect 10
 !
 address-family ipv4 unicast
  neighbor 192.168.65.2 route-map ALLOW-ALL in
  neighbor 192.168.65.2 route-map ALLOW-ALL out
 exit-address-family
 !
 address-family ipv4 flowspec
  neighbor 192.168.65.2 activate
  neighbor 192.168.65.2 route-map ALLOW-ALL in
  neighbor 192.168.65.2 route-map ALLOW-ALL out
 exit-address-family
 !
 address-family ipv6 unicast
  neighbor 192.168.65. Continue reading