Author Archives: Peter
Author Archives: Peter

IPVlan will require routes to be distributed to each endpoint. The driver only builds the Ipvlan L3 mode port and attaches the container to the interface. Route distribution throughout a cluster is beyond the initial implementation of this single host scoped driver. In L3 mode, the Docker host is very similar to a router starting new networks in the container. They are on networks that the upstream network will not know about without route distribution.Cumulus Networks has been working to simplify routing in the ECMP leaf and spine networks and the white paper Routing on the Host: An Introduction shows how the routing configuration used on Cumulus Linux can be extended to the hosts.


A future article will examine how the Host sFlow agent can be used to efficiently stream measurements from large numbers of inexpensive Rasberry Pi devices ($5 for model Zero) to the sFlow-RT collector to monitor and control the "Internet of Things" (IoT).The following instructions show how to install sFlow-RT on Raspbian Jesse (the Debian Linux based Raspberry Pi operating system).
wget http://www.inmon.com/products/sFlow-RT/sflow-rt_2.0-1092.debWe are ignoring the dependency on openjdk and will use the default Raspbian Java 1.8 version Continue reading
sudo dpkg -i --ignore-depends=openjdk-7-jre-headless sflow-rt_2.0-1092.deb

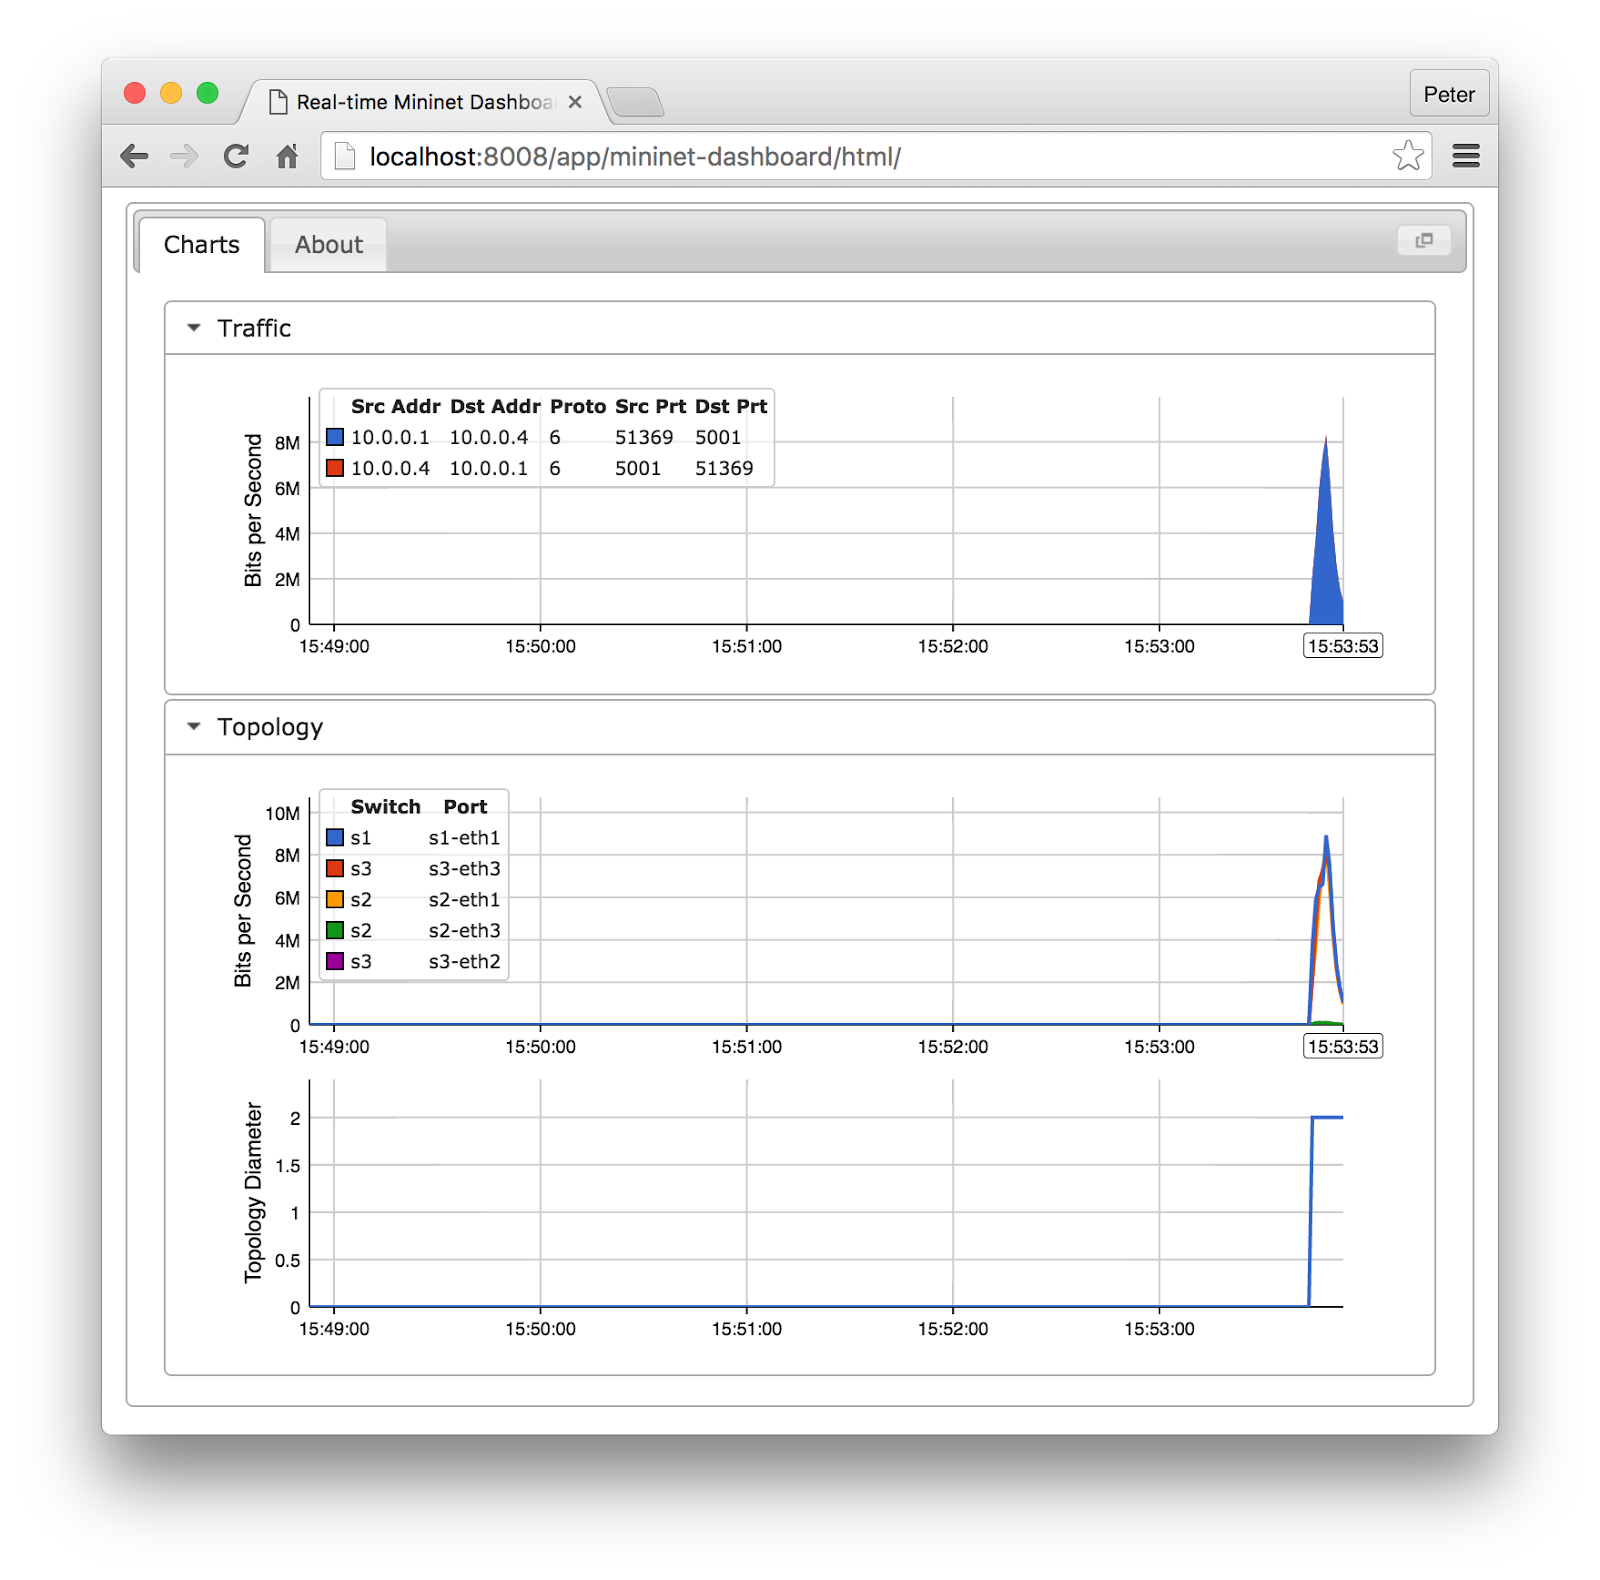
cd sflow-rtThe dashboard web interface shown in the screen shot should now be accessible. Run a test to see data in the dashboard. The following test created the results shown:
./get-app.sh sflow-rt mininet-dashboard
./start.sh
sudo mn --custom extras/sflow.py --link tc,bw=10 --topo tree,depth=2,fanout=2 --test iperfThe dashboard has three time series charts that update every second and show five minutes worth of data. From top to bottom, the charts are:


curl -H "Content-Type:application/json" -X PUT --data  '{"keys":"ipsource,ipdestination,tcpsourceport,tcpdestinationport",
"value":"bytes", "ipfixCollectors":["10.0.0.162"]}'
http://localhost:8008/flow/tcp/json
Running Wireshark's tshark command line utility on 10.0.0.162 verifies that flows are being received: # tshark -i eth0 -V udp port 4739
Running as user "root" and group "root". This could be dangerous.
Capturing on lo
Frame 1 (134 bytes on wire, 134 bytes captured)
Arrival Time: Continue reading
Background: Enhancing Network Intrusion Detection With Integrated Sampling and Filtering, Jose M. Gonzalez and Vern Paxson, International Computer Science Institute Berkeley, discusses the motivation for adding random sampling BPF and the email thread [PATCH] filter: added BPF random opcode describes the Linux implementation and includes an interesting discussion of the motivation for the patch.The following code shows how the open source Host sFlow agent implements random 1-in-256 packet sampling as a BPF program:
ld randA JIT for packet filters discusses the Linux Just In Time (JIT) compiler for BFP programs, delivering native machine code performance for compiled filters.
mod #256
jneq #1, drop
ret #-1
drop: ret #0

Cisco network engineers might not be familiar with the multi-vendor sFlow technology since it is a relatively new addition to Cisco products. The article, Cisco adds sFlow support, describes some of the key features of sFlow and contrasts them to Cisco NetFlow.Configuring sFlow on the switches is straightforward. For example, The following commands configure a switch to sample packets at 1-in-1024, poll counters every 30 seconds and send sFlow to an analyzer (10.0.0.50) over UDP using the default sFlow port (6343):
sflow receiver 1 10.0.0.50For each interface:
sflow flow-sampling 1024 1A previous posting discussed the selection of sampling rates. Additional information can be found on the Cisco web site.
sflow counter-sampling 30 1


curl -H "Content-Type:application/json" \However, there are serious problems with this approach:
-X PUT --data '{"address":"10.0.0.1","port":6343}' \
http://127.0.0.1:8008/forwarding/TenantA/json
sudo apt-get updateThis resulting hsflowd_1.29.1-1_amd64.deb package can be copied and installed on all the hosts in the Docker cluster using configuration management tools such as Puppet, Chef, Ansible, etc.
sudo apt-get install build-essential
sudo apt-get install libpcap-dev
sudo apt-get install wget
wget https://github.com/sflow/host-sflow/archive/v1.29.1.tar.gz
tar -xvzf v1.29.1.tar.gz
cd host-sflow-1.29.1
make DOCKER=yes PCAP=yes deb


An analogous observation that readers may be familiar with is the importance of minimizing costs when investing in order to maximize returns - see Vanguard Principle 3: Minimize costSuppose that a 100 server pool is being monitored and visibility will allow the orchestration system to realize a 10% improvement by better workload scheduling and placement - increasing the pool's capacity by 10% without the need to add an additional 10 servers and saving the associated CAPEX/OPEX costs.

mkdir sflow-rtAdd the following contents to Dockerfile:
cd sflow-rt
vi Dockerfile
FROM centos:centos6Build the project:
RUN yum install -y java-1.7.0-openjdk
RUN rpm -i http://www.inmon.com/products/sFlow-RT/sflow-rt-2.0-1072.noarch.rpm
EXPOSE 8008 6343/udp
CMD /etc/init.d/sflow-rt start && tail -f /dev/null
docker build -t sflow-rt .Run the service:
docker run -p 8008:8008 -p 6343:6343/udp -d sflow-rtAccess the API at http://docker_host:8008/ to verify that the service is running.