Author Archives: Peter
Author Archives: Peter
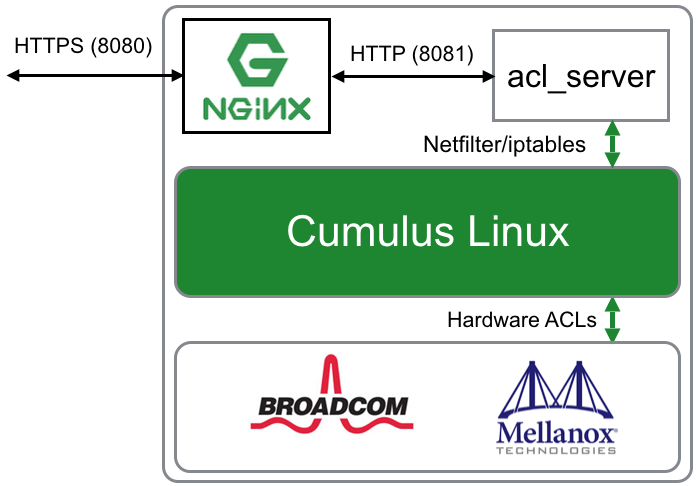
curl -X PUT -H 'Content-Type:application/json' --data '["[iptables]","-A FORWARD --in-interface swp+ -d 10.10.100.10 -p udp --sport 53 -j DROP"]' -k -u 'cumulus:CumulusLinux!' https://10.0.0.52:8080/acl/ddos1ACLs are sent as a JSON encoded array of strings. Each string will be written as a line in a file stored under /etc/cumulus/acl/policy.d/ - See Cumulus Linux: Netfilter - ACLs. For example, the rule above will be written to the file 50rest-ddos1.rules with the following Continue reading
#!/bin/shEdit the cvp-api-topology.py script to Continue reading
# Install Fabric View on CloudVision Portal (CVP)
VER=`wget -qO - http://inmon.com/products/sFlow-RT/latest.txt`
wget http://www.inmon.com/products/sFlow-RT/sflow-rt-$VER.noarch.rpm
rpm --nodeps -ivh sflow-rt-$VER.noarch.rpm
/usr/local/sflow-rt/get-app.sh sflow-rt fabric-view
ln -s /cvpi/jdk/bin/java /usr/bin/java
sed -i '/^# http.hostname=/s/^# //' /usr/local/sflow-rt/conf.d/sflow-rt.conf
echo "http.html.redirect=./app/fabric-view/html/" >> /usr/local/sflow-rt/conf.d/sflow-rt.conf
cat <<EOT > /etc/nginx/conf.d/locations/sflow-rt.https.conf
location /sflow-rt/ {
auth_request /aeris/auth;
proxy_buffering off;
proxy_set_header X-Forwarded-For \$proxy_add_x_forwarded_for;
proxy_set_header X-Forwarded-Prefix /sflow-rt/;
proxy_set_header Host \$host;
proxy_pass http://localhost:8008/;
proxy_redirect ~^http://[^/]+(/.+)\$ /sflow-rt\$1;
}
EOT
systemctl restart nginx.service
firewall-cmd --zone public --add-port=6343/udp --permanent
firewall-cmd --reload
systemctl enable sflow-rt.service
systemctl start sflow-rt.service
wget http://www.inmon.com/products/sFlow-RT/cvp-eapi-topology.py
chmod +x cvp-eapi-topology.py
echo "configure and run cvp-eapi-topology.py"

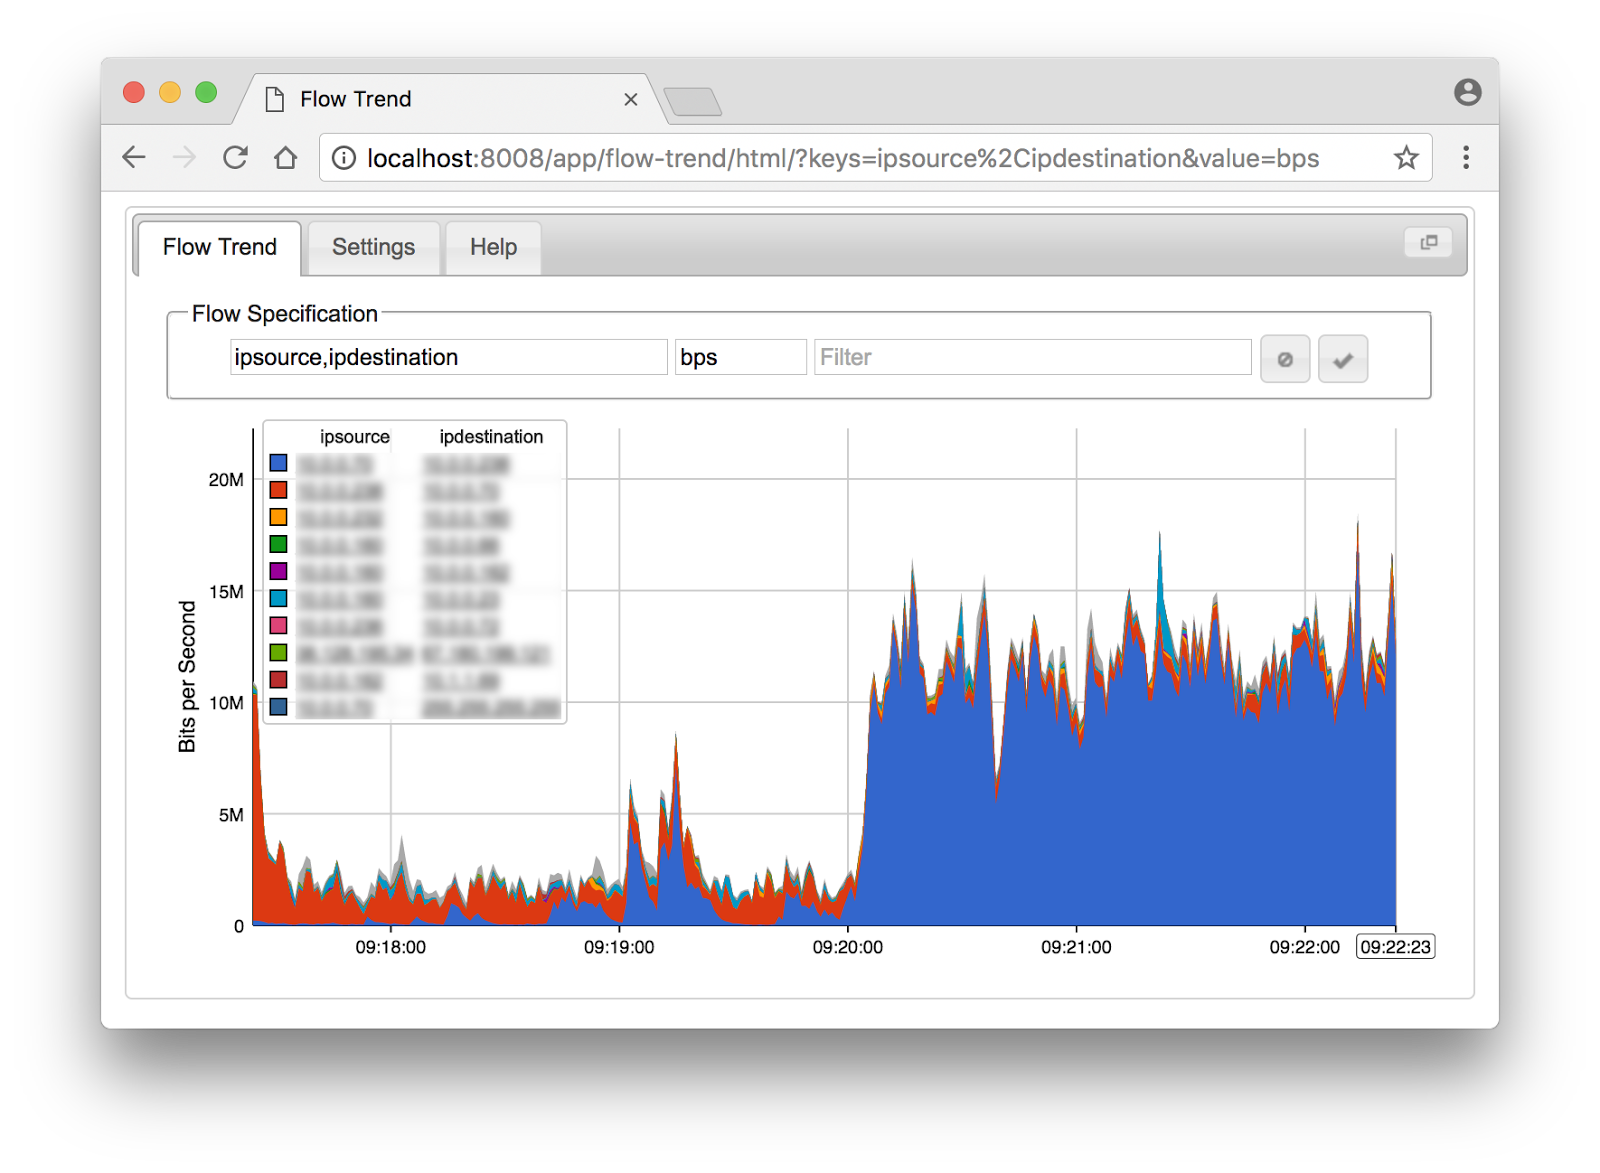
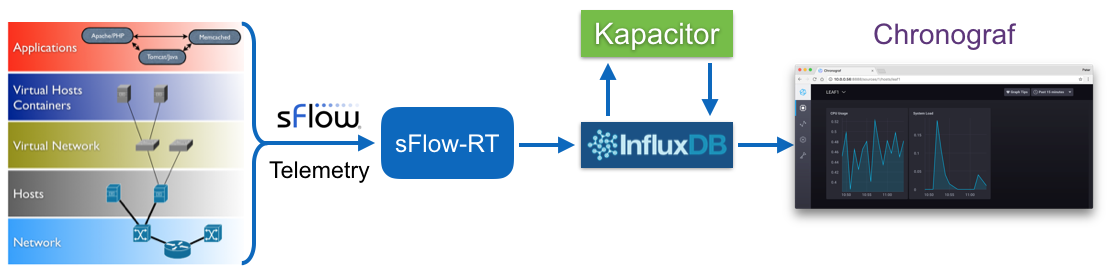
docker run -p 6343:6343/udp -p 8008:8008 sflow/flow-trendThe simplest way to run the software is using the docker. Configure network devices to send standard sFlow telemetry to Flow Trend. Access the web user interface on port 8008.


docker run -p 6343:6343/udp -p 8008:8008 sflow/vizceralThe Docker image also contains demo data based on Netflix's public cloud infrastructure:
docker run -e "RTPROP=-Dviz.demo=yes" -p 8008:8008 sflow/vizceral


var user = "cumulus";
var password = "CumulusLinux!";
var thresh = 10000;
var block_minutes = 1;

setFlow('udp_target',{keys:'ipdestination,udpsourceport',value:'frames'});

setThreshold('attack',{metric:'udp_target', value:thresh, byFlow:true, timeout:10});

function restCmds(agent,cmds) {
  for(var i = 0; i < cmds.length; i++) {
    let msg = {cmd:cmds[i]};
    http("https://"+agent+":8080/nclu/v1/rpc",
         "post","application/json",JSON.stringify(msg),user,password);
  }
}

var controls = {};
var id = 0;
setEventHandler(function(evt) {
  var key = evt.agent + ',' + evt.flowKey;
  if(controls[key]) return;

  var ifname = metric(evt.agent,evt.dataSource+".ifname")[0].metricValue;
  if(!ifname) return;

  var now = (new Date()).getTime();
  var name = 'ddos'+id++;
  var [ip,port] = evt.flowKey.split(',');
  var cmds = [
    'add acl ipv4 '+name+' drop udp source-ip any source-port '+port+' dest-ip '+ip+' dest-port any',
     Continue reading

Introduce psample, a general way for kernel modules to sample packets, without being tied to any specific subsystem. This netlink channel can be used by tc, iptables, etc. and allow to standardize packet sampling in the kernel commitThe psample netlink channel delivers sampled packet headers along with associated metadata from the Linux kernel to user space. The psample fields map directly into sFlow Version 5 sampled_header export structures:
| netlink psample | sFlow | Description |
|---|---|---|
| PSAMPLE_ATTR_IIFINDEX | input | Interface packet was received on. |
| PSAMPLE_ATTR_OIFINDEX | output | Interface packet was sent on. |
| PSAMPLE_ATTR_SAMPLE_GROUP | data source | The location within network device that generated packet sample. |
| PSAMPLE_ATTR_GROUP_SEQ | drops | Number of times that the sFlow agent detected that a packet marked to be sampled was dropped due to lack of resources. Agent calculates drops by tracking discontinuities in PSAMPLE_ATTR_GROUP_SEQ |
| PSAMPLE_ATTR_SAMPLE_RATE | sampling_rate | The Sampling Rate specifies the ratio of packets observed at the Data Source to the samples generated. For example a sampling rate of 100 specifies that, on Continue reading |
function runCmds(proto, agent, usr, pwd, cmds) {
  var req = {
    jsonrpc:'2.0',id:'sflowrt',method:'runCmds',
    params:{version:1,cmds:cmds,format:'json'}
  };
  var url = (proto || 'http')+'://'+agent+'/command-api';
  var resp = http(url,'post','application/json',JSON.stringify(req),usr,pwd);
  if(!resp) throw "no response";
  resp = JSON.parse(resp);
  if(resp.error) throw resp.error.message;
  return resp.result;
}
The following test.js script demonstrates the eAPI functionality with a basic show request: include('eapi.js');
var result = runCmds('http','10.0.0.90','admin','arista',['show hostname']);
logInfo(JSON.stringify(result));Starting sFlow-RT: env "RTPROP=-Dscript.file=test.js" ./start.shRunning the script generates the following output:
2017-07-10T14:00:06-0700 Continue reading


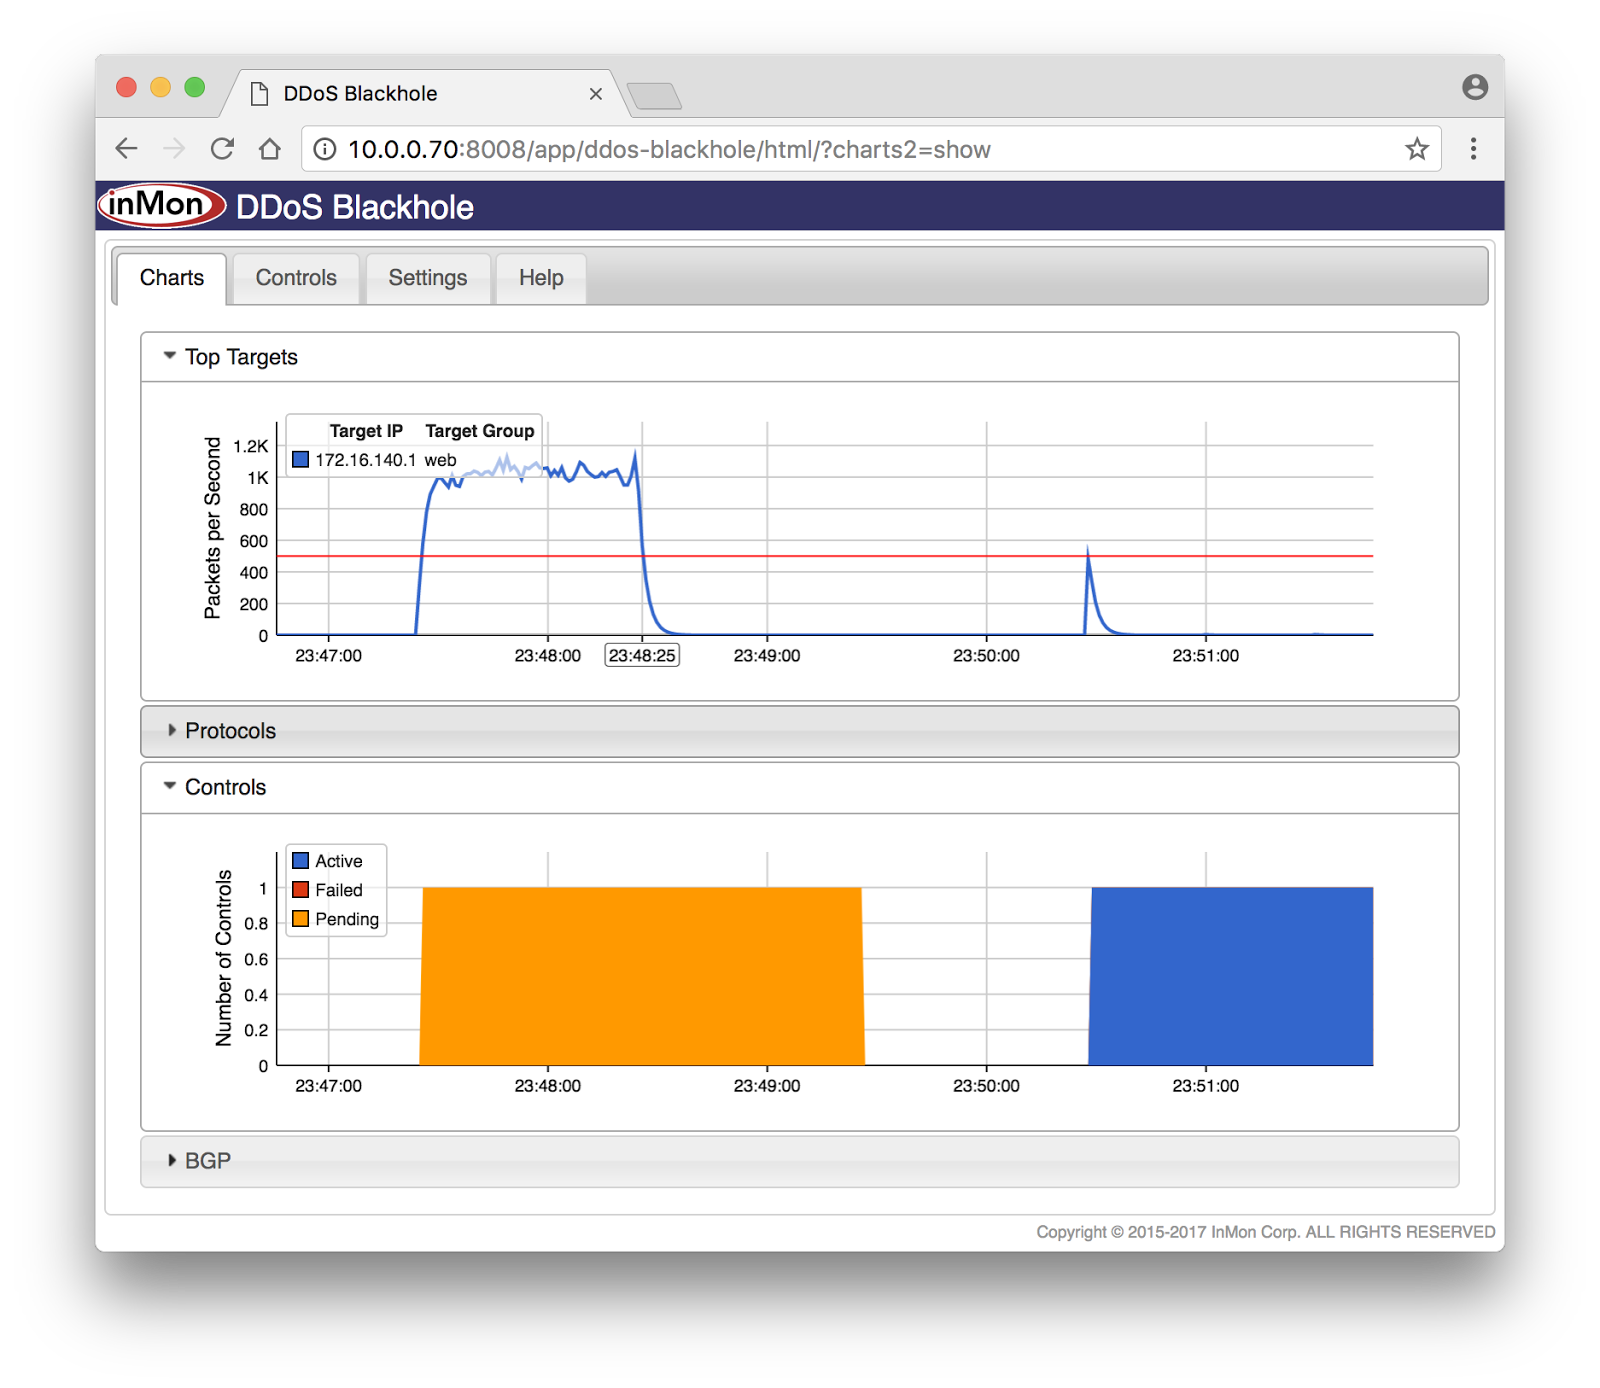
var router = '10.0.0.141';
var id = '10.0.0.70';
var as = 65141;
var thresh = 1000;
var block_minutes = 1;

setFlow('udp_target',{keys:'ipdestination,udpsourceport',value:'frames'});

setThreshold('attack',{metric:'udp_target', value:thresh, byFlow:true});

bgpAddNeighbor(router,as,id,{flowspec:true});

var  Continue reading
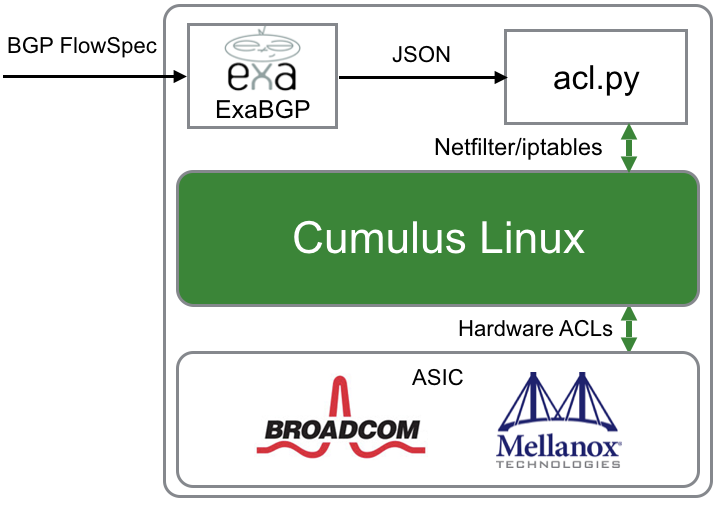
curl -L https://github.com/Exa-Networks/exabgp/archive/4.0.0.tar.gz | tar zxNow define the handler, acl.py, that will convert BGP FlowSpec updates into standard Linux netfilter/iptables entries used by Cumulus Linux to specify hardware ACLs (see Netfilter - ACLs):
#!/usr/bin/python

import json
import re
from os import listdir,remove
from os.path import isfile
from  Continue reading

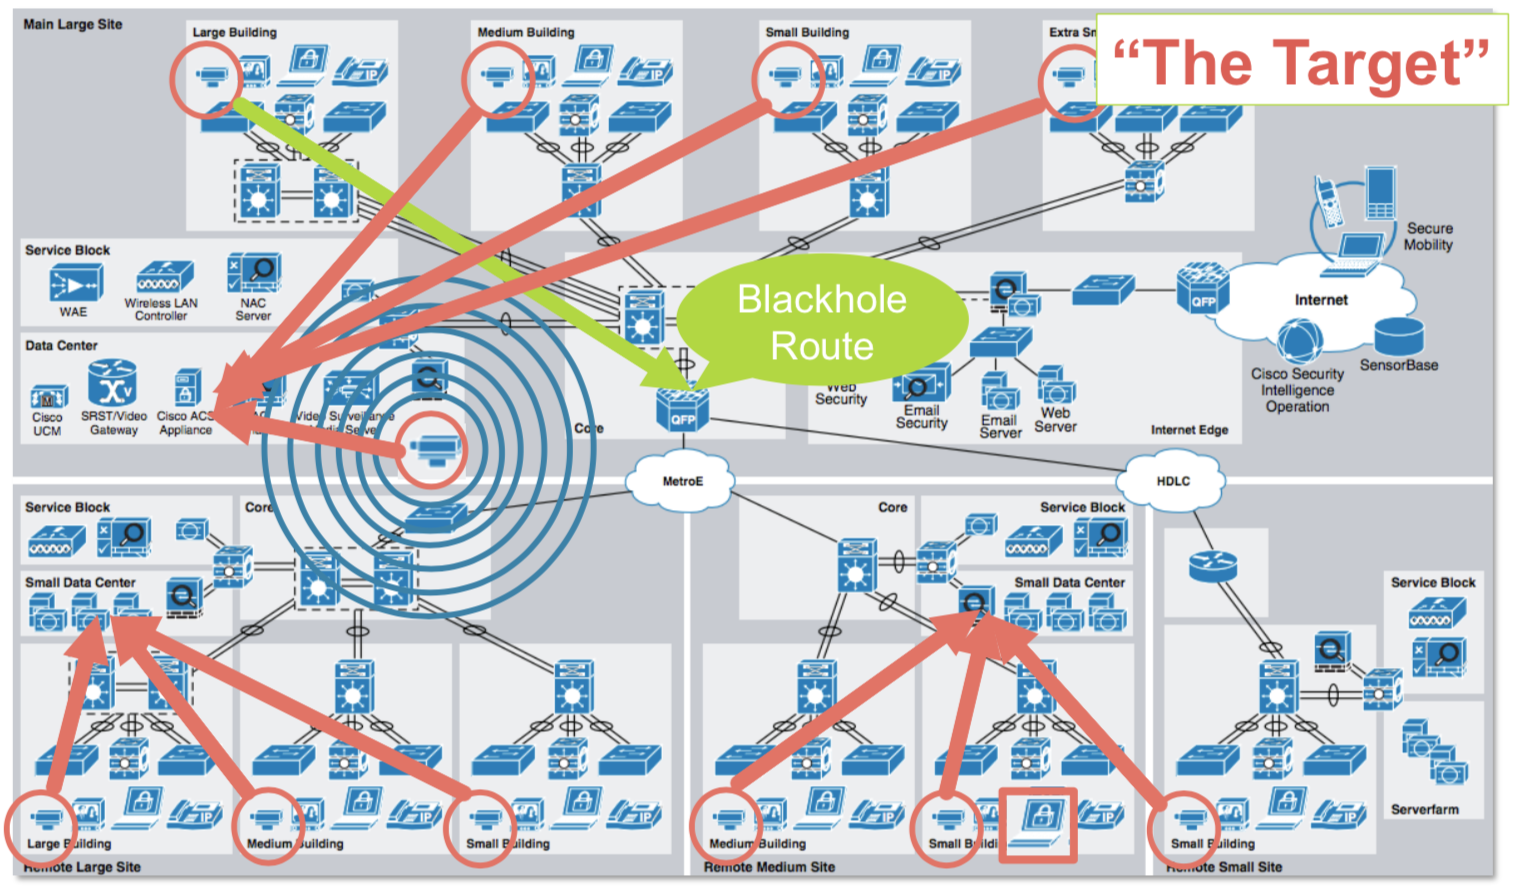
router bgp 65140The ce-router peers with the upstream service provider router ( Continue reading
bgp router-id 0.0.0.140
neighbor 10.0.0.70 remote-as 65140
neighbor 10.0.0.70 port 1179
neighbor 172.16.141.2 remote-as 65141
!
address-family ipv4 unicast
neighbor 10.0.0.70 allowas-in
neighbor 10.0.0.70 route-map blackhole-in in
exit-address-family
!
ip community-list standard blackhole permit 65535:666
!
route-map blackhole-in permit 20
match community blackhole
match ip address prefix-len 32
set ip next-hop 192.0.2.1

startDatagram =================================
datagramSourceIP 172.17.0.1
datagramSize 704
unixSecondsUTC 1490843418
datagramVersion 5
agentSubId 100000
agent 10.0.0.90
packetSequenceNo 714
sysUpTime 0
samplesInPacket 1
startSample ----------------------
sampleType_tag 0:2
sampleType COUNTERSSAMPLE
sampleSequenceNo 714
sourceId 2:1
counterBlock_tag 0:2001
counterBlock_tag 0:2010
udpInDatagrams 1459
udpNoPorts 16
udpInErrors 0
udpOutDatagrams 4765
udpRcvbufErrors 0
udpSndbufErrors 0
udpInCsumErrors 0
counterBlock_tag 0:2009
tcpRtoAlgorithm 1
tcpRtoMin 200
tcpRtoMax 120000
tcpMaxConn 4294967295
tcpActiveOpens 102
 Continue reading
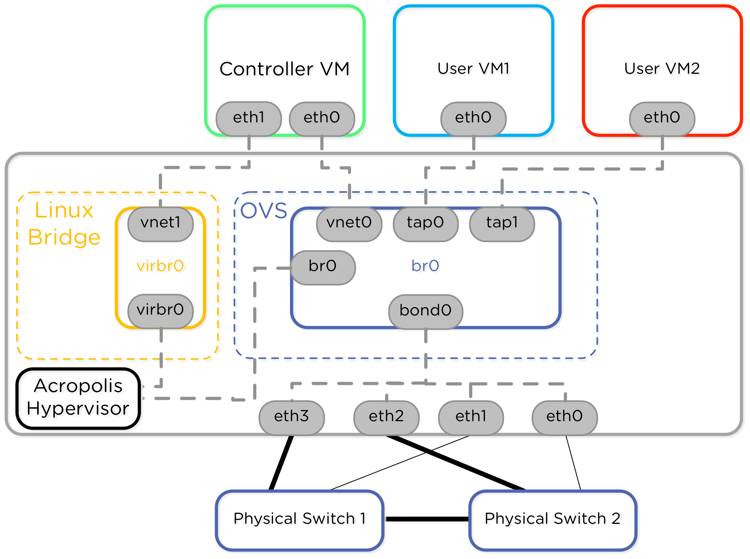
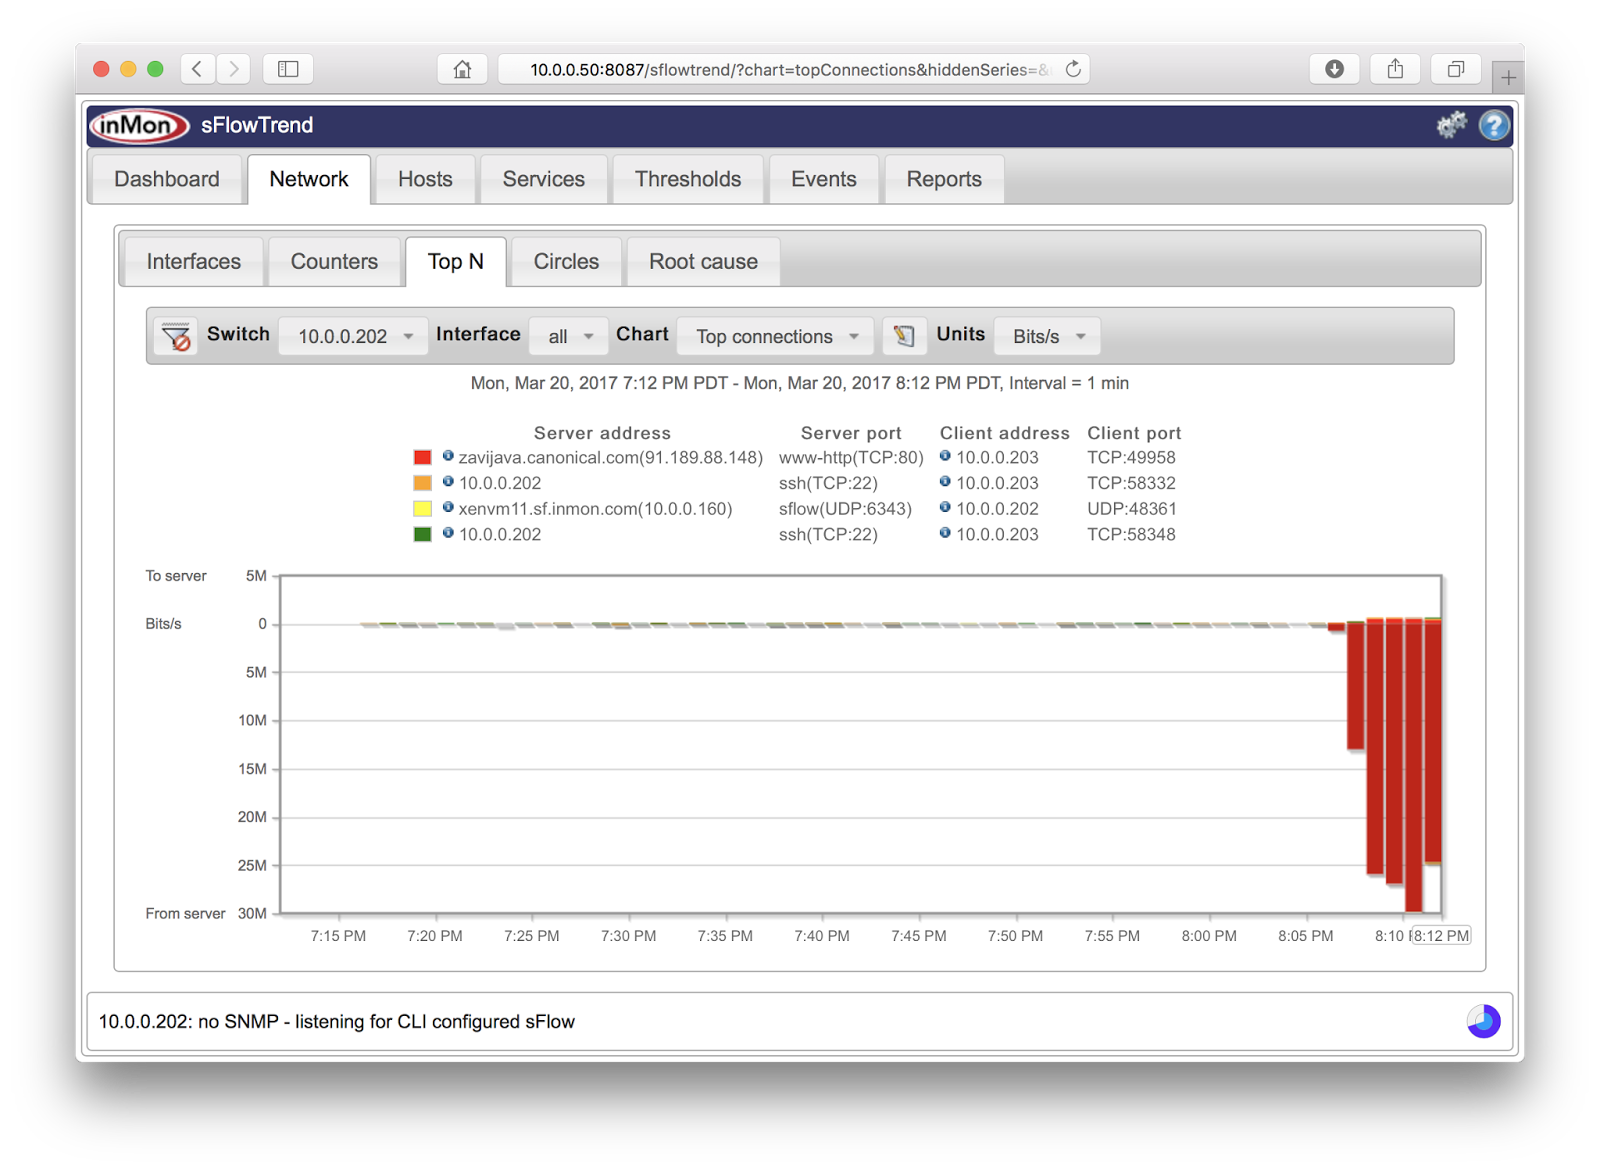
This article is based on a single hardware node running Nutanix Community Edition (CE), built following the instruction in Part I: How to setup a three-node NUC Nutanix CE cluster. If you don't have hardware readily available, the article, 6 Nested Virtualization Resources To Get You Started With Community Edition, describes how to run Nutanix CE as a virtual machine.The sFlow standard is widely supported by network equipment vendors, which combined with sFlow from each Nutanix appliance, delivers end to end visibility in the Nutanix cluster. The following screen captures from the free sFlowTrend tool are representative examples of the data available from the Nutanix appliance.

docker run -p 6343:6343/udp -p 8008:8008 -d sflow/top-flowsAccess the web interface at http://localhost:8008/ and enter the following Flow Specification to monitor QUICK flows:
dns:ipsource,dns:ipdestination,quicpackettypeNote: Real-time domain name lookups describes how sFlow-RT incorporates DNS (Domain Name Service) requests in its real-time analytics pipeline so that traffic flows can be identified by domain name.

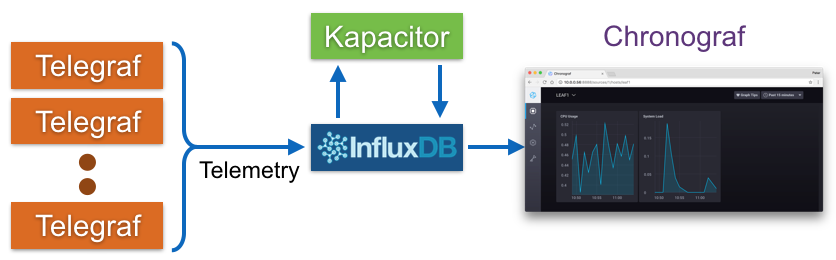
var influxdb = "http://10.0.0.56:8086/write?db=telegraf";

function sendToInfluxDB(msg) {
  if(!msg || !msg.length) return;

  var req = {
    url:influxdb,
    operation:'POST',
    headers:{"Content-Type":"text/plain"},
    body:msg.join('\n')
  };
  req.error = function(e) {
    logWarning('InfluxDB POST failed, error=' + e);
  }
  try { httpAsync(req); }
  catch(e) {
    logWarning('bad request ' + req.url + ' ' + e);
  }
}

var metric_names = [
   Continue reading