Author Archives: Peter
Author Archives: Peter


# tcpdump -ni eth0 tcpThe host TCP/IP stack continuously measured round trip time and estimates available bandwidth for each active connection as part of its normal operation. The tcpdump output shown above highlights timestamp information that is exchanged in TCP packets to provide the accurate round trip time measurements needed for reliable high speed data transfer.
11:29:28.949783 IP 10.0.0.162.ssh > 10.0.0.70.56174: Flags [P.], seq 1424968:1425312, ack 1081, win 218, options [nop,nop,TS val 2823262261 ecr 2337599335], length 344
11:29:28.950393 IP 10.0.0.70.56174 > 10.0.0.162.ssh: Flags [.], ack 1425312, win 4085, options [nop,nop,TS val 2337599335 ecr 2823262261], length 0
docker run -e "RTPROP=-Ddns.servers=10.0.0.1" \The following Python script dnspair.py uses the sFlow-RT REST API to define a flow and log the resulting flow records:
-p 8008:8008 -p 6343:6343/udp -d sflow/sflow-rt
#!/usr/bin/env pythonRunning the script generates the following output:
import requests
import json
flow = {'keys':'dns:ipsource,dns:ipdestination',
'value':'bytes','activeTimeout':10,'log':True}
requests.put('http://localhost:8008/flow/dnspair/json',data=json.dumps(flow))
flowurl = 'http://localhost:8008/flows/json?name=dnspair&maxFlows=10&timeout=60'
flowID = -1
while 1 == 1:
r = requests.get(flowurl + "&flowID=" + str(flowID))
if r.status_code != 200: break
flows = r.json()
if len(flows) == 0: continue
flowID = flows[0]["flowID"]
flows.reverse()
for f in flows:
print json.dumps(f,indent=1)
$ ./dnspair.py
{
 "value": 233370.92322668363,
 "end": 1476234478177,
 "name": "dnspair",
 "flowID":  Continue reading

docker service create --replicas 2 -p 80:80 --name apache httpd:2.4Next, the following script tests the agility of monitoring systems by constantly changing the number of replicas in the service:
#!/bin/bashThe above test is easy to set up and is a quick way to stress test monitoring systems and reveal accuracy and performance problems when they are confronted with container workloads.
while true
do
docker service scale apache=$(( ( RANDOM % 20 ) + 1 ))
sleep 30
done
docker service create --replicas 2 -p 80:80 --name apache httpd:2.4And the following command raises the number of containers in the service pool from 2 to 4:
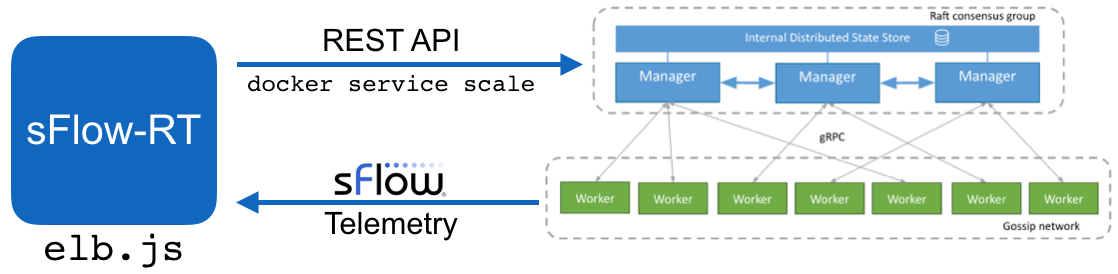
docker service scale apache=4Asynchronous Docker metrics describes how sFlow telemetry provides the real-time visibility required for elastic load balancing. The diagram shows how streaming telemetry allows the sFlow-RT controller to determine the load on the service pool so that it can use the Docker service API to automatically increase or decrease the size of the pool as demand changes. Elastic load balancing of the service pools ensures consistent service levels by adding additional resources if demand increases. In addition, efficiency is improved by releasing resources Continue reading


-A FORWARD --in-interface swp+ -s 20.0.0.2 -d 20. Continue reading


http://localhost:8008/metric/ALL/sum:http_method_get,sum:http_method_post/jsonMore interesting is that the sFlow telemetry stream also includes randomly sampled HTTP request records with the following attributes:
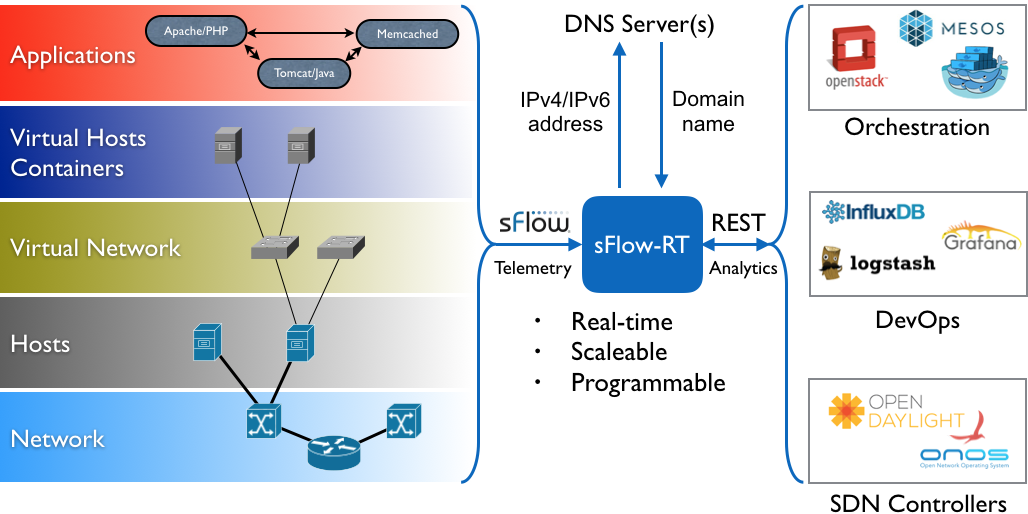
docker run -p 8008:8008 -p 6343:6343/udp -d sflow/sflow-rtConfigure standard sFlow Agents to stream telemetry to the analyzer and retrieve analytics using the REST API on port 8008.
docker run -e "RTMEM=2G" -p 8008:8008 -p 6343:6343/udp -d sflow/sflow-rtSet System Property to enable country lookups when Defining Flows:
docker run -e "RTPROP=-Dgeo.country=resources/config/GeoIP.dat" -p 8008:8008 -p 6343:6343/udp -d sflow/sflow-rtRun sFlow-RT Application. Drop the -d option while developing an application to see output of logging commands and use control-c to stop the container.
docker run -v /Users/pp/my-app:/sflow-rt/app/my-app -p 8008:8008 -p 6343:6343/udp -d sflow/sflow-rtA simple Dockerfile can be used to generate a new image that includes the application:
FROM sflow/sflow-rt:latestSimilarly, Continue reading
COPY /Users/pp/my-app /sflow-rt/app

sudo sh -c 'echo "deb http://ftp.us.debian.org/debian jessie main contrib" > \Next, install Host sFlow, Java, and Bird:
/etc/apt/sources.list.d/deb.list'
sudo apt-get updateInstall sFlow-RT (the latest version is available at sFlow-RT.com):
sudo apt-get install hsflowd
sudo apt-get install unzip
sudo apt-get install default-jre-headless
sudo apt-get install bird
wget http://www.inmon.com/products/sFlow-RT/sflow-rt_2.0-1116.debIncrease the default virtual memory limit for sflowrt (needs to be greater than 1/3 amount of RAM on system to start Java virtual machine, see Giant Bug: Cannot run java with a virtual mem limit (ulimit -v)):
sudo dpkg -i sflow-rt_2.0-1116.deb
sudo sh -c 'echo "sflowrt soft as 2000000" > \Note: Maximum Java heap memory has a default of 1G and is controlled by settings in /usr/local/sflow-rt/conf.d/sflow-rt.jvm file.
/etc/security/limits.d/99-sflowrt.conf'
sudo sh -c "/usr/local/sflow-rt/get-app. Continue reading


$ cat /etc/issueThe following commands build the latest Continue reading
Amazon Linux AMI release 2016.03

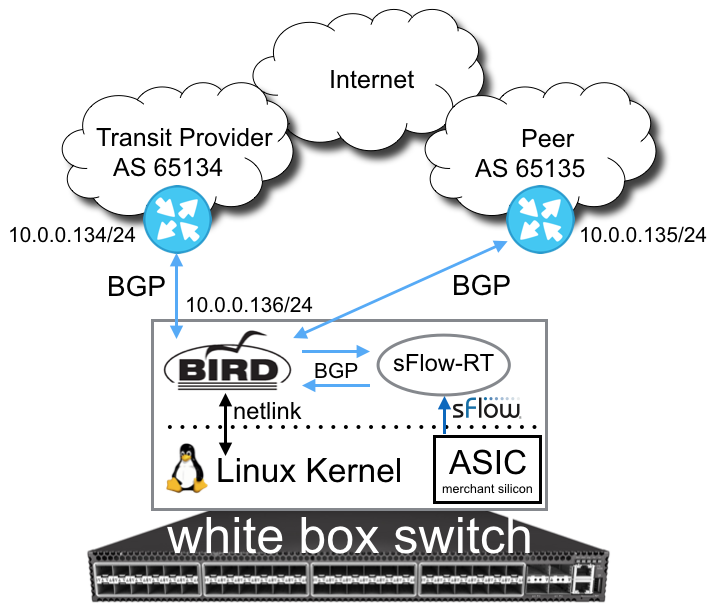
var reflectorIP = '10.0.0.254';The following sFlow-RT System Properties load the configuration file and enable BGP:
var myAS = '65162';
var myID = '10.0.0.162';
var sFlowAgentIP = '10.0.0.253';
// allow BGP connection from reflectorIP
bgpAddNeighbor(reflectorIP,myAS,myID);
// direct sFlow from sFlowAgentIP to reflectorIP routing table
// calculate a 60 second moving average byte rate for each route
bgpAddSource(sFlowAgentIP,reflectorIP,60,'bytes');
Continue reading
switch(config)# sflow collector 10.0.0.50A previous posting discussed the selection of sampling rates. Additional information can be found in the OpenSwitch sFlow User Guide.
switch(config)# sflow sampling 4096
switch(config)# sflow polling 20
switch(config)# sflow enable
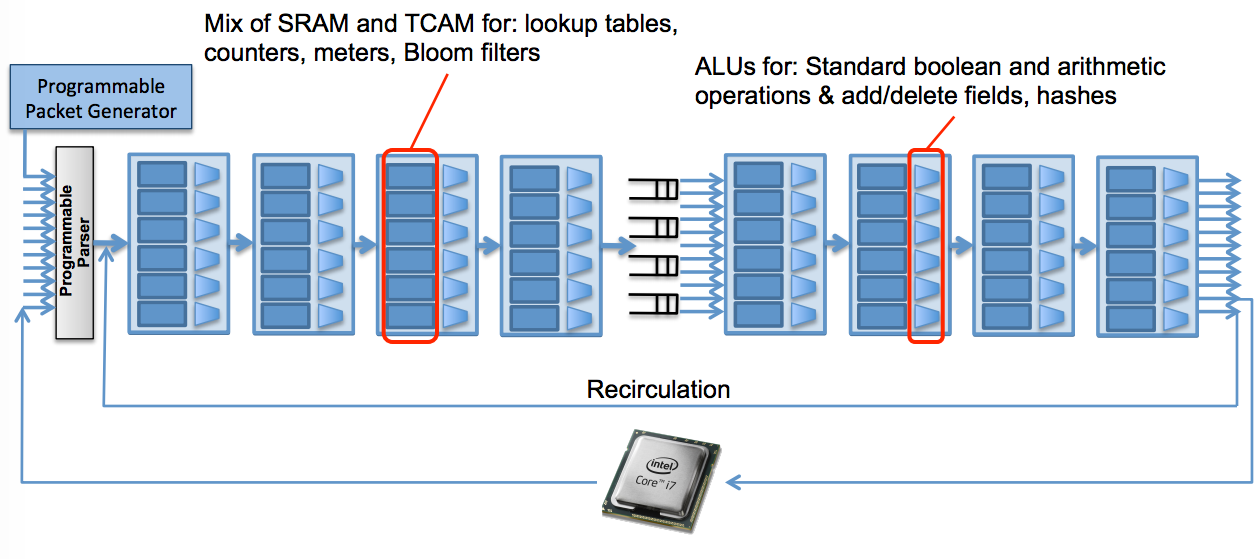
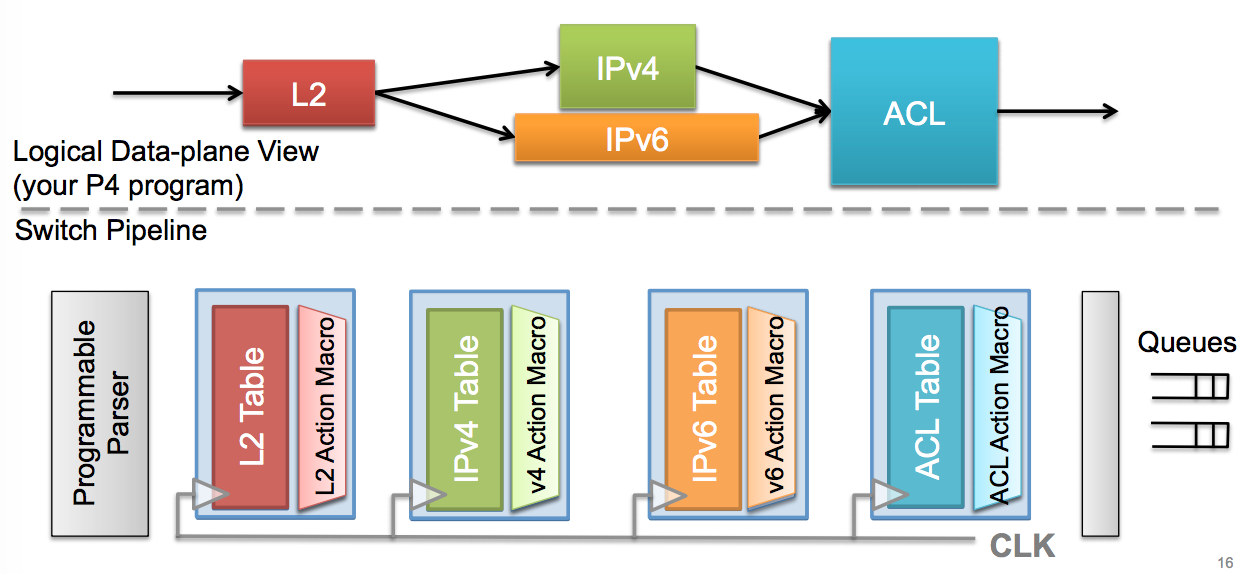
table sflow_ing_take_sample {
    /* take_sample > MAX_VAL_31 and valid sflow_session_id => take the sample */
    reads {
        ingress_metadata.sflow_take_sample : ternary;
        sflow_metadata.sflow_session_id : exact;
    }
    actions {
        nop;
        sflow_ing_pkt_to_cpu;
    }
}
Network visibility is one of the major use cases for P4 based switches. Improving Network Monitoring and Management with Programmable Data Planes describes how P4 can be used to collect information about latency and queueing in the switch forwarding pipeline.
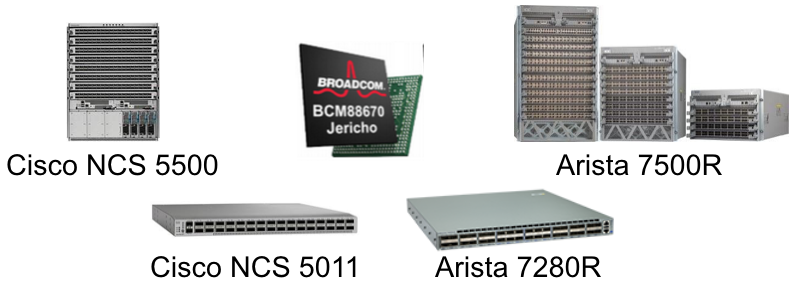
An edge router is a very pricey box indeed, often costing anywhere from $100,000 to $200,000 per 100 Gb/sec port, depending on features in the router and not including optical cables that are also terribly expensive. Moreover, these routers might only be able to cram 80 ports into a half rack or full rack of space. The 7500R universal spine and 7280R universal leaf switches cost on the order of $3,000 per 100 Gb/sec port, and they are considerably denser and less expensive. - Leaving Fixed Function Switches Behind For Universal LeafsBroadcom Jericho ASICs are currently available in Arista 7500R/7280R routers and in Cisco NCS 5000 series routers. Expect further disruption Continue reading