TCPDump Quick Reference
TCPDump is a tool for sniffing packets on a network. This is not a comprehensive tutorial, only a quick reference source. Consult the man pages and/or documentation for indepth explanation of commands. Capturing Traffic All Traffic for an interface -i <interface-name> specifies an...Another Service Provider Picks VeloCloud for SD-WAN
 The company will initially market the service to its existing customers.
Latest Fedora Project OS Tips its Hat to Container Upgrades
 The containerized Kubernetes option supports running of different orchestration versions.
SK Telecom Creates its Own In-House NFV MANO
 The operator got fed up with separate NFV management for different equipment.
Getting started with Cloudflare Apps
We recently launched our new Cloudflare Apps platform, and love to see the community it is building. In an effort to help people who run web services such as websites, APIs and more, we would like to help make your web services faster, safer and more reliable using our new Apps Platform by leveraging our 115 points of presence around the world. (Skip ahead to the fun part if you already know how Cloudflare Apps works)
How Cloudflare apps work
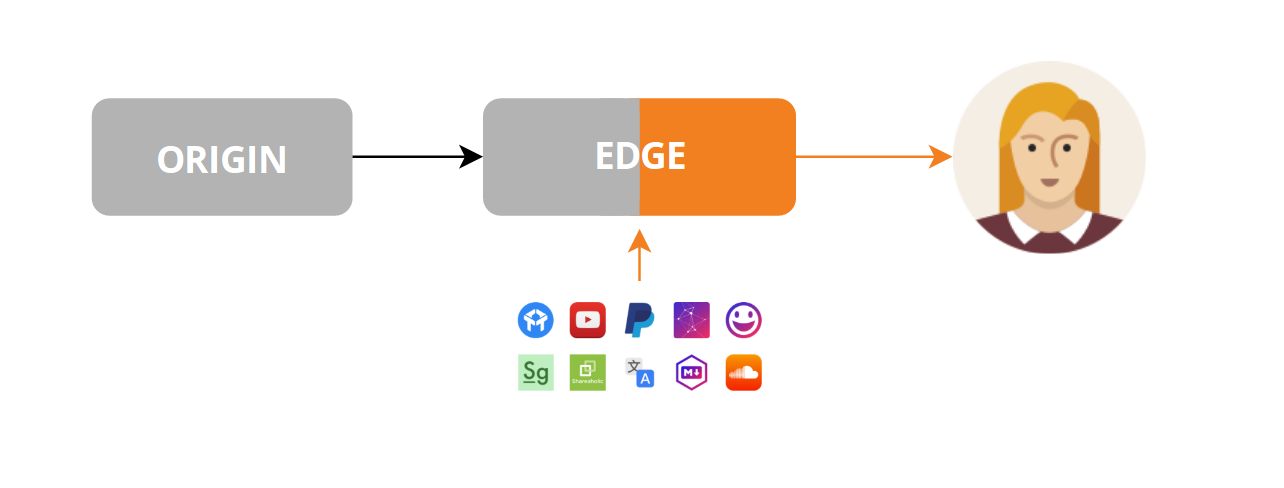
Here is a quick diagram of how Cloudflare apps work:

The “Origin” is the server that is providing your services, such as your website or API. The “Edge” represents a point of presence that is closest to your visitors. Cloudflare uses a routing method known as Anycast to ensure the end user, pictured on the far right, is routed through the best network path to our points of presence closest to them around the world.
Historically, to make changes or additions to your site at the edge changes to a site, you needed to be a Cloudflare employee. Now with apps, anyone can quickly make changes to the pages rendered to their users via Javascript and CSS. Today, you Continue reading
Edgewise Brings Zero-Trust Security to the Data Center and Cloud
 Investors include Carbon Black and Threat Stack CEOs.
Google Container Engine Gains Kubernetes 1.7 Updates
 Google claims it's the first to embed Kubernetes 1.7 updates.
SAP Adds Smarts to Leonardo and the IoT Network Edge
 "For some, a millisecond of a delay can screw up a lot," says IDC analyst.
On the ‘web: Is it really simpler?
The post On the ‘web: Is it really simpler? appeared first on rule 11 reader.
Datanauts 092: Microsoft MCSA Lab Creation With Chef
Learn how to use Chef to automate the creation of MCSA labs for Microsoft certifications. Our guest on the Datanauts is Brett Johnson. The post Datanauts 092: Microsoft MCSA Lab Creation With Chef appeared first on Packet Pushers.Viptela Updates SD-WAN Fabric to Enhance Cloud Usage
 OnRamp uses that same connectivity as Viptela's SD-WAN to access the cloud from the branch.
IBM’s Cognitive Platform ‘Augments Human Intelligence’
 IBM says the Watson-powered product goes beyond just automation.
Building an Enterprise-grade SD-WAN
 There are several advanced features that make up an enterprise-grade SD-WAN, including load balancing, optimization, and real-time visibility.
Arista eAPI
The sFlow and eAPI features of EOS (Extensible Operating System) are standard across the full range of Arista Networks switches. This article demonstrates how the real-time visibility provided by sFlow telemetry can be combined with the programmatic control of eAPI to automatically adapt the network to changing traffic conditions.In the diagram, the sFlow-RT analytics engine receives streaming sFlow telemetry, provides real-time network-wide visibility, and automatically applies controls using eAPI to optimize forwarding, block denial of service attacks, or capture suspicious traffic.
Arista eAPI 101 describes the JSON RPC interface for programmatic control of Arista switches. The following eapi.js script shows how eAPI requests can be made using sFlow-RT's JavaScript API:
function runCmds(proto, agent, usr, pwd, cmds) {
  var req = {
    jsonrpc:'2.0',id:'sflowrt',method:'runCmds',
    params:{version:1,cmds:cmds,format:'json'}
  };
  var url = (proto || 'http')+'://'+agent+'/command-api';
  var resp = http(url,'post','application/json',JSON.stringify(req),usr,pwd);
  if(!resp) throw "no response";
  resp = JSON.parse(resp);
  if(resp.error) throw resp.error.message;
  return resp.result;
}
The following test.js script demonstrates the eAPI functionality with a basic show request: include('eapi.js');
var result = runCmds('http','10.0.0.90','admin','arista',['show hostname']);
logInfo(JSON.stringify(result));Starting sFlow-RT: env "RTPROP=-Dscript.file=test.js" ./start.shRunning the script generates the following output:
2017-07-10T14:00:06-0700 Continue reading
