Cloudflare partners with Microsoft to protect joint customers with a Global Zero Trust Network
As a company, we are constantly asking ourselves what we can do to provide more value to our customers, including integrated solutions with our partners. Joint customers benefit from our integrations below with Azure Active Directory by:
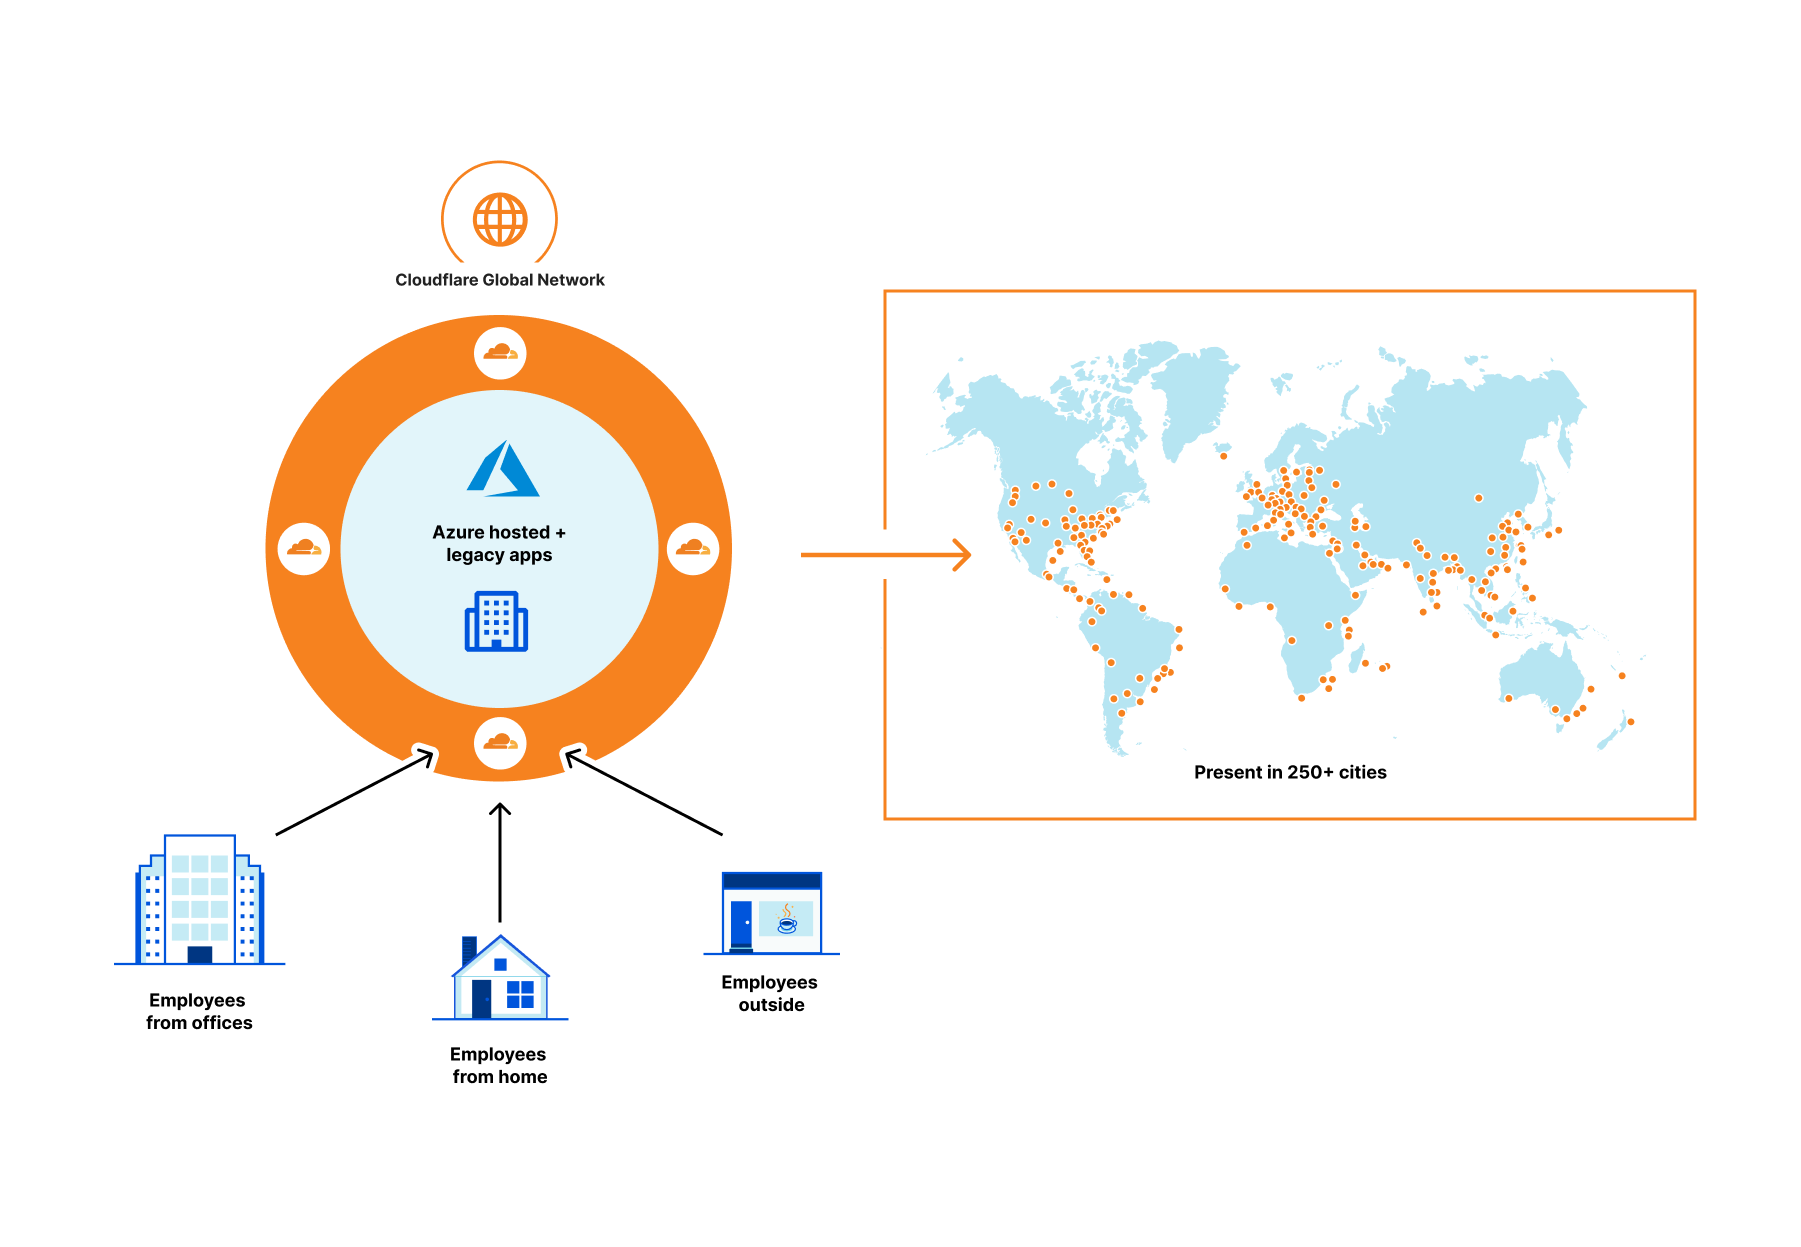
First, centralized identity and access management via Azure Active Directory which provides single sign-on, multifactor authentication, and access via conditional authentication.
Second, policy oriented access to specific applications using Cloudflare Access—a VPN replacement service.
Third, an additional layer of security for internal applications by connecting them to Cloudflare global network and not having to open them up to the whole Internet.
Let’s step back a bit.
Why Zero Trust?
Companies of all sizes are faced with an accelerating digital transformation of their IT stack and an increasingly distributed workforce, changing the definition of the security perimeter. We are moving away from the castle and moat model to the whole Internet, requiring security checks for every user accessing every resource. As a result, all companies, especially those whose use of Azure’s broad cloud portfolio is increasing, are adopting Zero Trust architectures as an essential part of their cloud and SaaS journey.
Cloudflare Access provides secure access to Azure hosted applications and Continue reading
A bridge to Zero Trust

Cloudflare One enables customers to build their corporate networks on a faster, more secure Internet by connecting any source or destination and configuring routing, security, and performance policies from a single control plane. Today, we’re excited to announce another piece of the puzzle to help organizations on their journey from traditional network architecture to Zero Trust: the ability to route traffic from user devices with our lightweight roaming agent (WARP) installed to any network connected with our Magic IP-layer tunnels (Anycast GRE, IPsec, or CNI). From there, users can upgrade to Zero Trust over time, providing an easy path from traditional castle and moat to next-generation architecture.
The future of corporate networks
Customers we talk to describe three distinct phases of architecture for their corporate networks that mirror the shifts we’ve seen with storage and compute, just with a 10 to 20 year delay. Traditional networks (“Generation 1”) existed within the walls of a datacenter or headquarters, with business applications hosted on company-owned servers and access granted via private LAN or WAN through perimeter security appliances. As applications shifted to the cloud and users left the office, companies have adopted “Generation 2” technologies like SD-WAN Continue reading
Managing Clouds – Cloudflare CASB and our not so secret plan for what’s next

Last month we introduced Cloudflare’s new API–driven Cloud Access Security Broker (CASB) via the acquisition of Vectrix. As a quick recap, Cloudflare’s CASB helps IT and security teams detect security issues in and across their SaaS applications. We look at both data and users in SaaS apps to alert teams to issues ranging from unauthorized user access and file exposure to misconfigurations and shadow IT.
I’m excited to share two updates since we announced the introduction of CASB functionality to Cloudflare Zero Trust. First, we’ve heard from Cloudflare customers who cannot wait to deploy the CASB and want to use it in more depth. Today, we’re outlining what we’re building next, based on that feedback, to give you a preview of what you can expect. Second, we’re opening the sign-up for our beta, and I’m going to walk through what will be available to new users as they are invited from the waitlist.
What’s next in Cloudflare CASB?
The vision for Cloudflare’s API–driven CASB is to provide IT and security owners an easy-to-use, one-stop shop to protect the security of their data and users across their fleet of SaaS tools. Our goal is to make sure any IT or security Continue reading
Video: Kubernetes Networking Model
After describing the Kubernetes architecture in the introductory part of the excellent Kubernetes Networking Deep Dive webinar, Stuart Charlton focused on what matters most to networking engineers: Kubernetes networking model.
Parts of Kubernetes Networking Deep Dive webinar (including this video) are available with Free ipSpace.net Subscription.
Capturing Bird Photos
Continuing from the previous post which I have set up to install a bird feeder, I have mentioned that I would install a camera based on the https://mynaturewatch.net/daylight-camera-instructions project and I did install it, this took some really good photos and would like to share some of them.
Few points:
- The battery that I used is a 10000mAh power-bank and it lasted for 2-3 days
- The box that I used is a baby food box and I nailed them to the boundary wooden poles from inside.
- This Bird Feeder is not the one I 3d Printed, this is an old bird feeder that someone gave it to me


Glad to see these pics, many more to come with Idea to install and make it sustain through solar power
-Rakesh
Defense in depth with Calico Cloud
Last month, we announced the launch of our active cloud-native application runtime security. Calico Cloud’s active runtime security helps security teams secure their containerized workloads with a holistic approach to threat detection, prevention, and mitigation.
As security teams look to secure these workloads, it’s also critical that they employ a defense-in-depth strategy. Calico Cloud’s active runtime security can detect, prevent, and mitigate threats across the entire cyber kill chain for containerized workloads.
What is the cyber kill chain?
The cyber kill chain is a framework used to track the steps a threat actor might take as they attempt to execute a cyber attack on your organization. The cyber kill chain was originally developed by Lockheed Martin to adapt the military concept that details the structure of an attack for cybersecurity threats. Today, this framework is used by security teams from a wide range of organizations to understand and respond to cybersecurity threats.
The Lockheed Martin cyber kill chain consists of seven stages:
- Reconnaissance: An attacker assesses potential targets and tactics for an attack
- Weaponization: An attacker prepares the attack by obtaining or setting up the appropriate infrastructure
- Delivery: An attacker launches their attack
- Exploitation: An attacker gains access to their Continue reading
Evolving Machine Learning to stop mobile bots

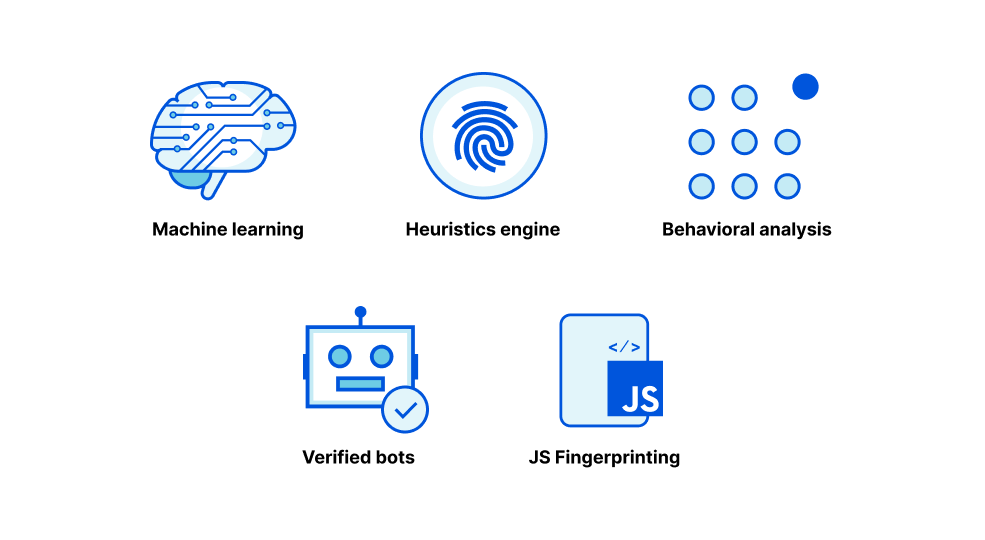
When we launched Bot Management three years ago, we started with the first version of our ML detection model. We used common bot user agents to train our model to identify bad bots. This model, ML1, was able to detect whether a request is a bot or a human request purely by using the request’s attributes. After this, we introduced a set of heuristics that we could use to quickly and confidently filter out the lowest hanging fruit of unwanted traffic. We have multiple heuristic types and hundreds of specific rules based on certain attributes of the request, many of which are very hard to spoof. But machine learning is a very important part of our bot management toolset.
We started with a static model because we were starting from scratch, and we were able to experiment quickly with aggregated HTTP analytics metadata. After we launched the model, we quickly gathered feedback from early bot management customers to identify where we performed well but also how we could improve. We saw attackers getting smart, and so we generated a new set of model features. Our heuristics were able to accurately identify various types of bad bots giving us much better Continue reading
New Return-To-Office Policies
The following post originally appeared in Human Infrastructure, a weekly newsletter from the Packet Pushers. You can sign up and see every back issue here. Earlier this year, Google spent a billion dollars on office space in London. As the company orders employees back to its campuses, it’s also restarting amenities “such as cafes, restaurants, […]
The post New Return-To-Office Policies appeared first on Packet Pushers.
Congratulations Cloudflare 2021 Partner Award Winners

We’re thrilled to announce the winners of our annual Channel and Alliance Partner Awards for 2021. Throughout a year of continued global disruptions, Cloudflare’s partners kept innovating, expanding their solutions and services capabilities, and accelerated their growth with us and our platform. It is important that we recognize and award the partners of ours who stood out in staying laser-focused on delivering outstanding business outcomes for customers.

With the ongoing shift in 2021 to remote, flexible work forces and the evolving cyber threat landscape, more than ever organizations across every industry and the public sector were looking to Cloudflare, and to work hand in hand with partners who can deliver a modern, Zero Trust approach to security. Seeing this consistent need, we are continuing to build and support new levels of partner-led growth in the year ahead such as with a new partner services program for SASE and Zero Trust which we launched at the start of 2022.
Please join us in congratulating the impressive achievements of our partner award winners over this past year! They enable the further delivery of Internet security, performance, and reliability for organizations of all sizes and types — and we are thrilled to be Continue reading
Protect all network traffic with Cloudflare

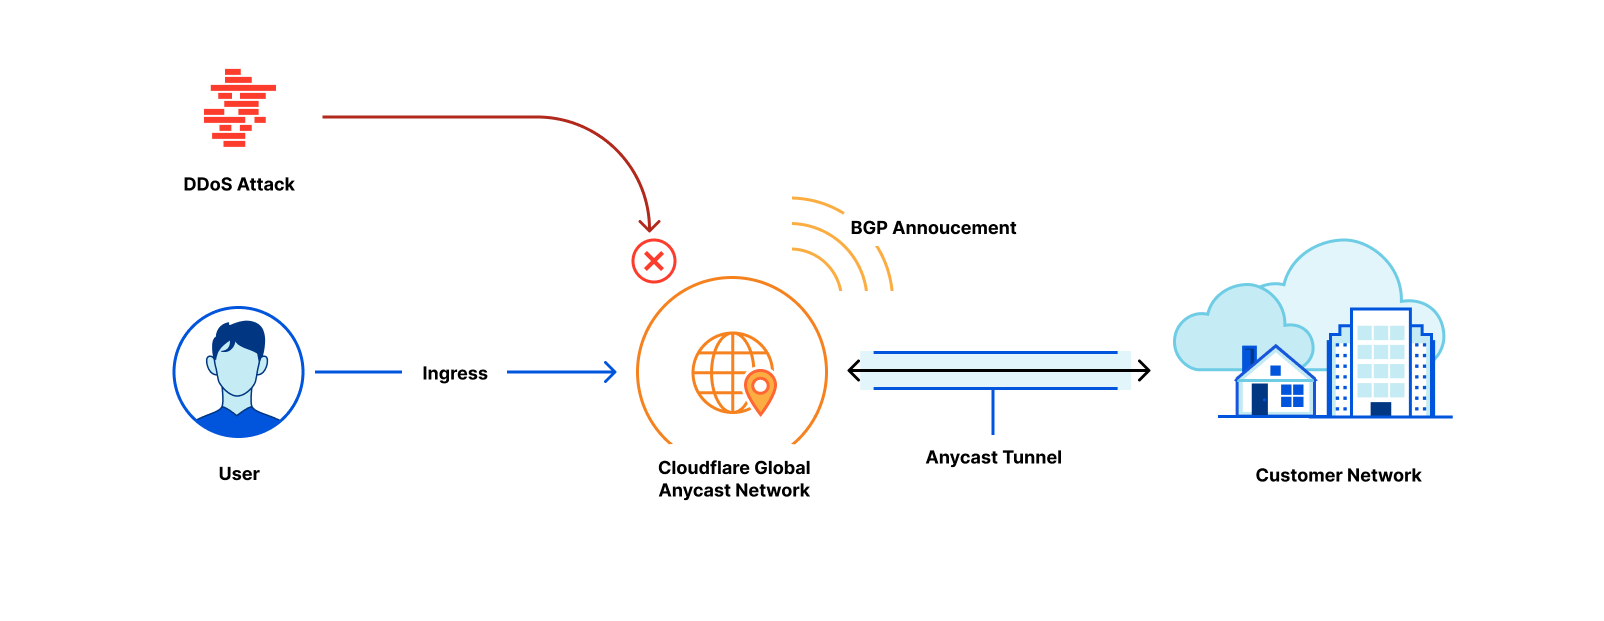
Magic Transit protects customers' entire networks—any port/protocol—from DDoS attacks and provides built-in performance and reliability. Today, we’re excited to extend the capabilities of Magic Transit to customers with any size network, from home networks to offices to large cloud properties, by offering Cloudflare-maintained and Magic Transit-protected IP space as a service.
What is Magic Transit?
Magic Transit extends the power of Cloudflare’s global network to customers, absorbing all traffic destined for your network at the location closest to its source. Once traffic lands at the closest Cloudflare location, it flows through a stack of security protections including industry-leading DDoS mitigation and cloud firewall. Detailed Network Analytics, alerts, and reporting give you deep visibility into all your traffic and attack patterns. Clean traffic is forwarded to your network using Anycast GRE or IPsec tunnels or Cloudflare Network Interconnect. Magic Transit includes load balancing and automatic failover across tunnels to steer traffic across the healthiest path possible, from everywhere in the world.
The “Magic” Continue reading
Clientless Web Isolation is now generally available

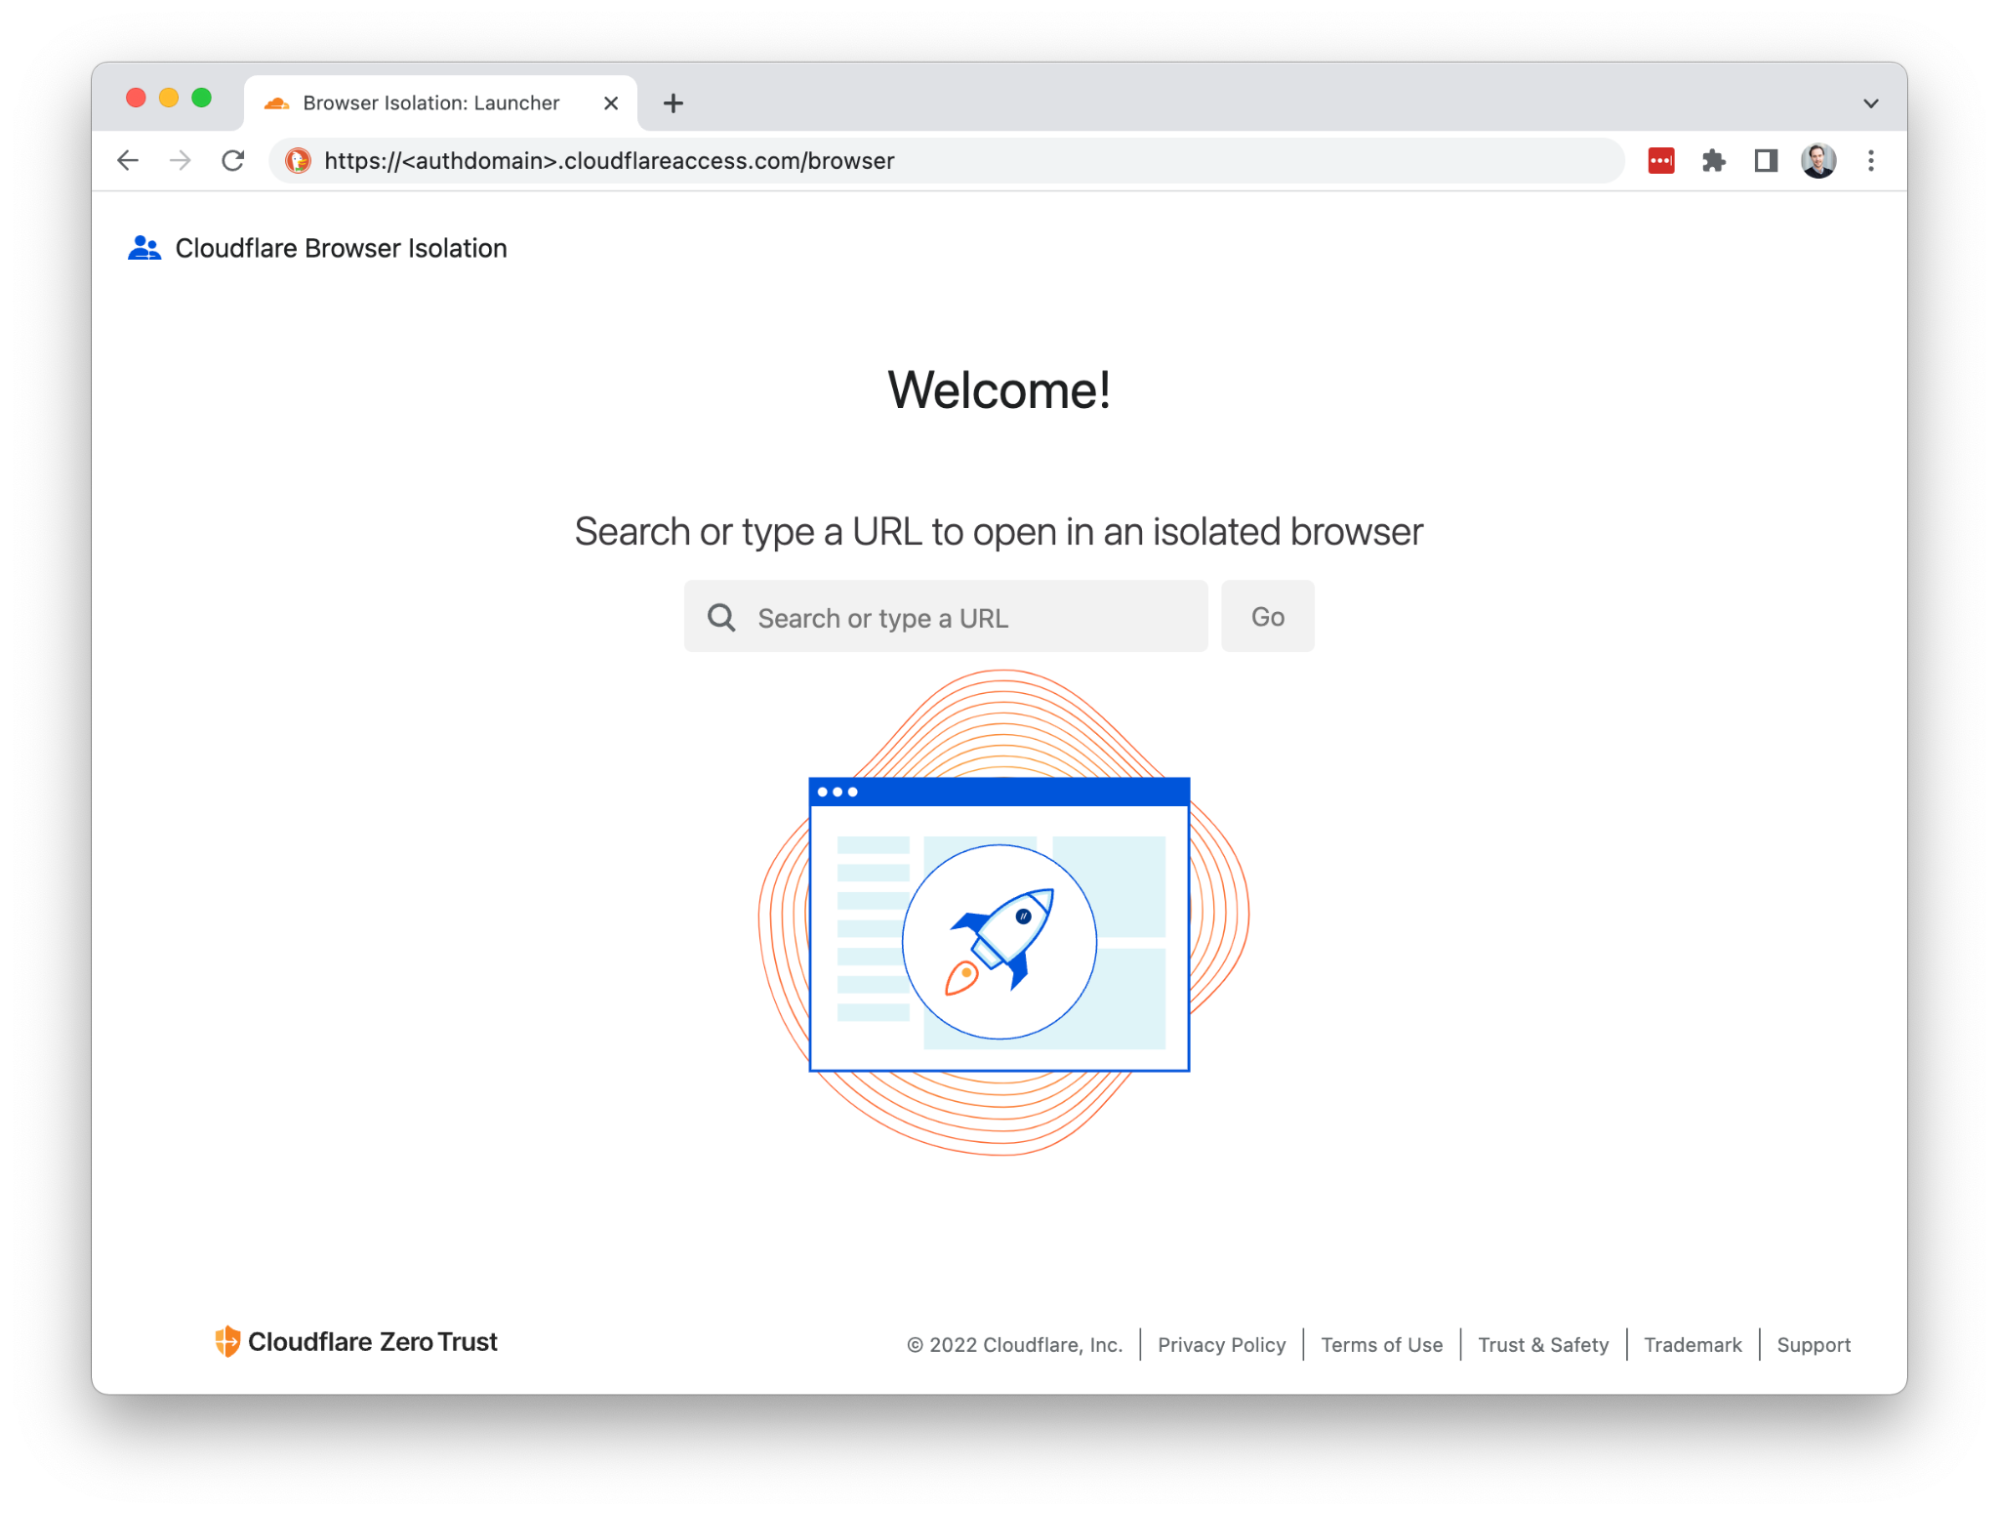
Today, we’re excited to announce that Clientless Web Isolation is generally available. A new on-ramp for Browser Isolation that natively integrates Zero Trust Network Access (ZTNA) with the zero-day, phishing and data-loss protection benefits of remote browsing for users on any device browsing any website, internal app or SaaS application. All without needing to install any software or configure any certificates on the endpoint device.
Cloudflare’s clientless web isolation simplifies connections to remote browsers through a hyperlink (e.g.: https://<your-auth-domain>.cloudflareaccess.com/browser). We explored use cases in detail in our beta announcement post, but here’s a quick refresher on the use cases that clientless isolated browsing enables:
Share secure browsing across the entire team on any device
Simply navigating to Clientless Web Isolation will land your user such as an analyst, or researcher in a remote browser, ready to securely conduct their research or investigation without exposing their public IP or device to potentially malicious code on the target website.
Deep link into isolated browsing
Suspicious hyperlinks and PDF documents from sensitive applications can be opened in a remote browser by rewriting the link with the clientless endpoint. For example:
https://<authdomain>.cloudflareaccess.com/browser/https://www.example.com/suspiciouslink
This is Continue reading
Packet captures at the edge
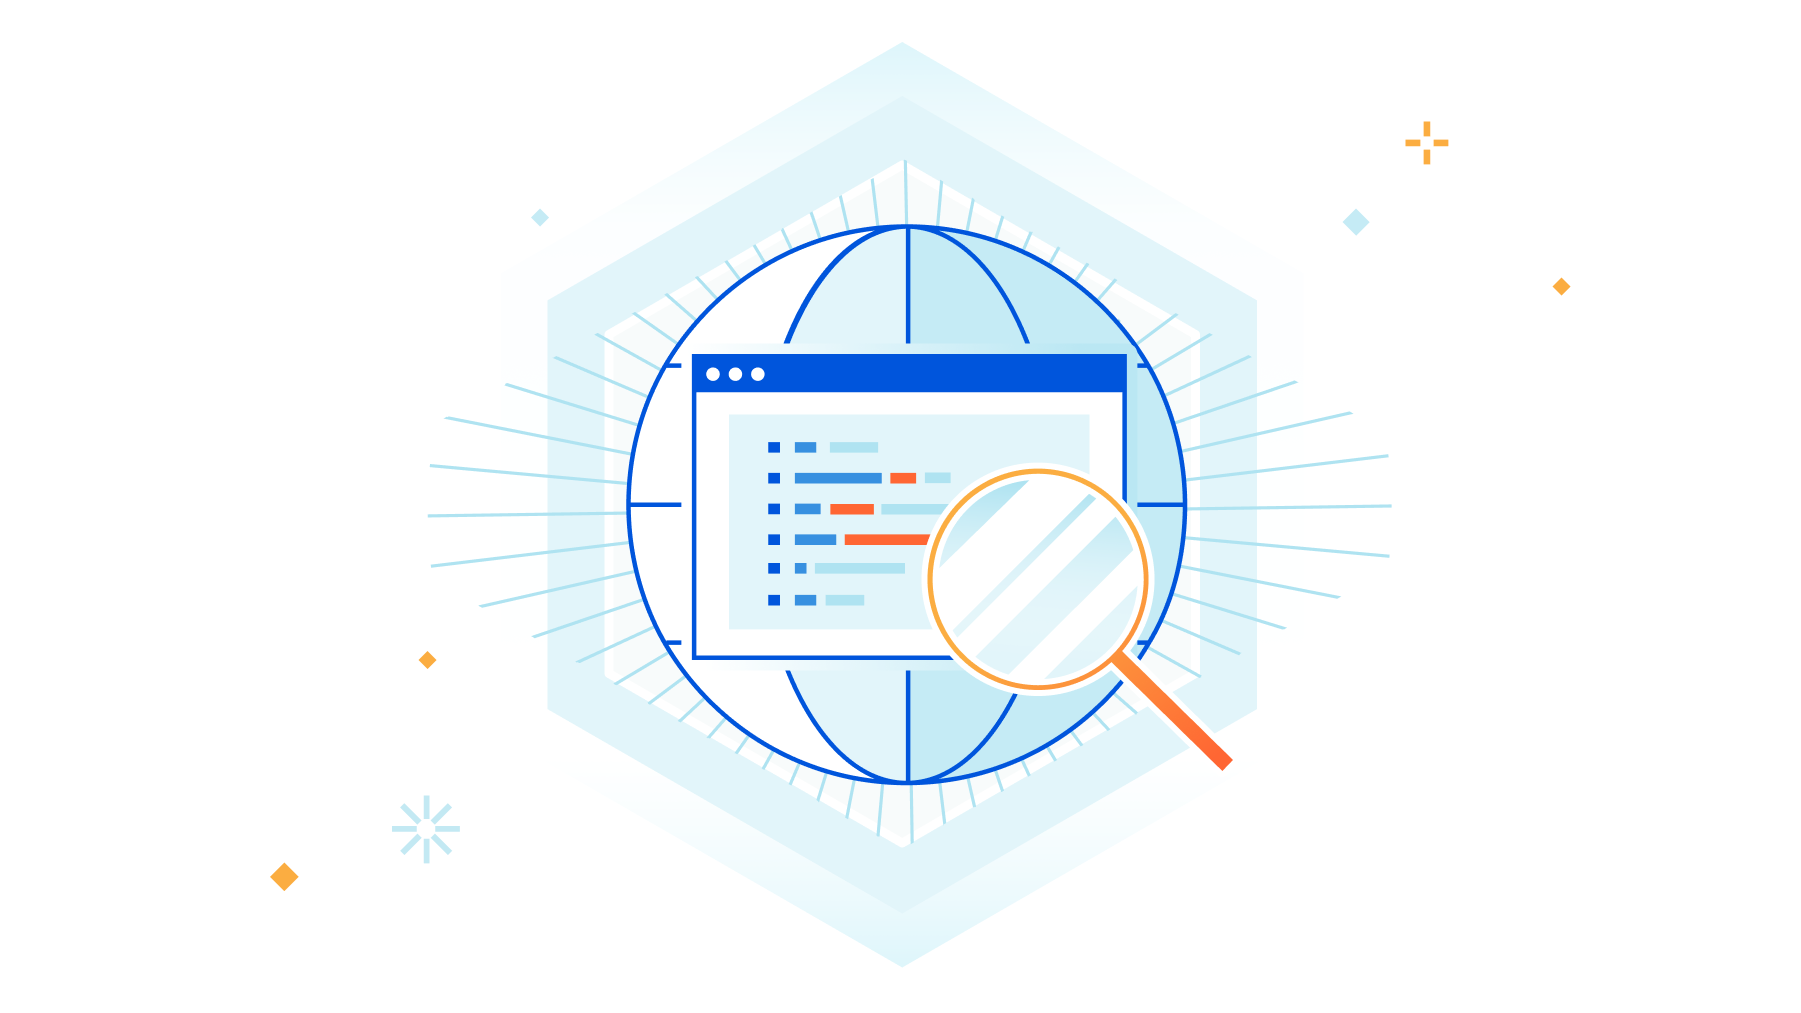

Packet captures are a critical tool used by network and security engineers every day. As more network functions migrate from legacy on-prem hardware to cloud-native services, teams risk losing the visibility they used to get by capturing 100% of traffic funneled through a single device in a datacenter rack. We know having easy access to packet captures across all your network traffic is important for troubleshooting problems and deeply understanding traffic patterns, so today, we’re excited to announce the general availability of on-demand packet captures from Cloudflare’s global network.
What are packet captures and how are they used?
A packet capture is a file that contains all packets that were seen by a particular network box, usually a firewall or router, during a specific time frame. Packet captures are a powerful and commonly used tool for debugging network issues or getting better visibility into attack traffic to tighten security (e.g. by adding firewall rules to block a specific attack pattern).
A network engineer might use a pcap file in combination with other tools, like mtr, to troubleshoot problems with reachability to their network. For example, if an end user reports intermittent connectivity to a specific application, an engineer Continue reading
Cloudflare and Aruba partner to deliver a seamless global secure network from the branch to the cloud

Today we are excited to announce that Cloudflare and Aruba are working together to develop a solution that will enable Aruba customers to connect EdgeConnect SD-WAN’s with Cloudflare's global network to further secure their corporate traffic with Cloudflare One. Whether organizations need to secure Internet-bound traffic from branch offices using Cloudflare's Secure Web Gateway & Magic Firewall, or enforce firewall policies for east/west traffic between offices via Magic Firewall, we have them covered. This gives customers peace of mind that they have consistent global security from Cloudflare while retaining granular control of their inter-branch and Internet-bound traffic policies from their Aruba EdgeConnect appliances.
SD-WAN solution
A software-defined WAN (SD-WAN) is an evolution of a WAN (wide area network) that simplifies the underlying architecture. Unlike traditional WAN architecture models where expensive leased, and MPLS links are used, SD-WAN can efficiently use a combination of private lines and the public Internet. It brings together the best of both worlds to provide an integrated solution to network administrators in managing and scaling their network and resources with ease.
Aruba’s EdgeConnect SD-WAN solution
We are proud to announce our first enhanced SD-WAN integration. Aruba’s EdgeConnect solution is an industry leader for WAN edge Continue reading