OpenSwitch

This article describes how to enable industry standard sFlow telemetry using the open source Host sFlow agent. The Host sFlow agent uses Control Plane Services (CPS) to configure sFlow instrumentation in the hardware and gather metrics. CPS in turn uses the Open Compute Project (OCP) Switch Abstraction Interface (SAI) as a vendor independent method of configuring the hardware. Hardware support for sFlow is a standard feature supported by Network Processing Unit (NPU) vendors (Barefoot, Broadcom, Cavium, Innovium, Intel, Marvell, Mellanox, etc.) and vendor neutral sFlow configuration is part of the SAI.
Installing and configuring Host sFlow agent
Installing the software is simple. Log into the switch and type the following commands:wget --no-check-certificate https://github.com/sflow/host-sflow/releases/download/v2.0.17-1/hsflowd-opx_2.0.17-1_amd64.debThe sFlow agent requires very little configuration, automatically monitoring all switch ports using the following default settings:
sudo dpkg -i hsflowd-opx_2.0.17-1_amd64.deb
| Link Speed | Sampling Rate | Polling Continue reading |
|---|
Intranet DDoS attacks
As on a Darkling Plain: Network Survival in an Age of Pervasive DDoS talk by Steinthor Bjarnason at the recent NANOG 71 conference. The talk discusses the threat that the proliferation of network connected devices in enterprises create when they are used to launch denial of service attacks. Last year's Mirai attacks are described, demonstrating the threat posed by mixed mode attacks where a compromised host is used to infect large numbers devices on the corporate network.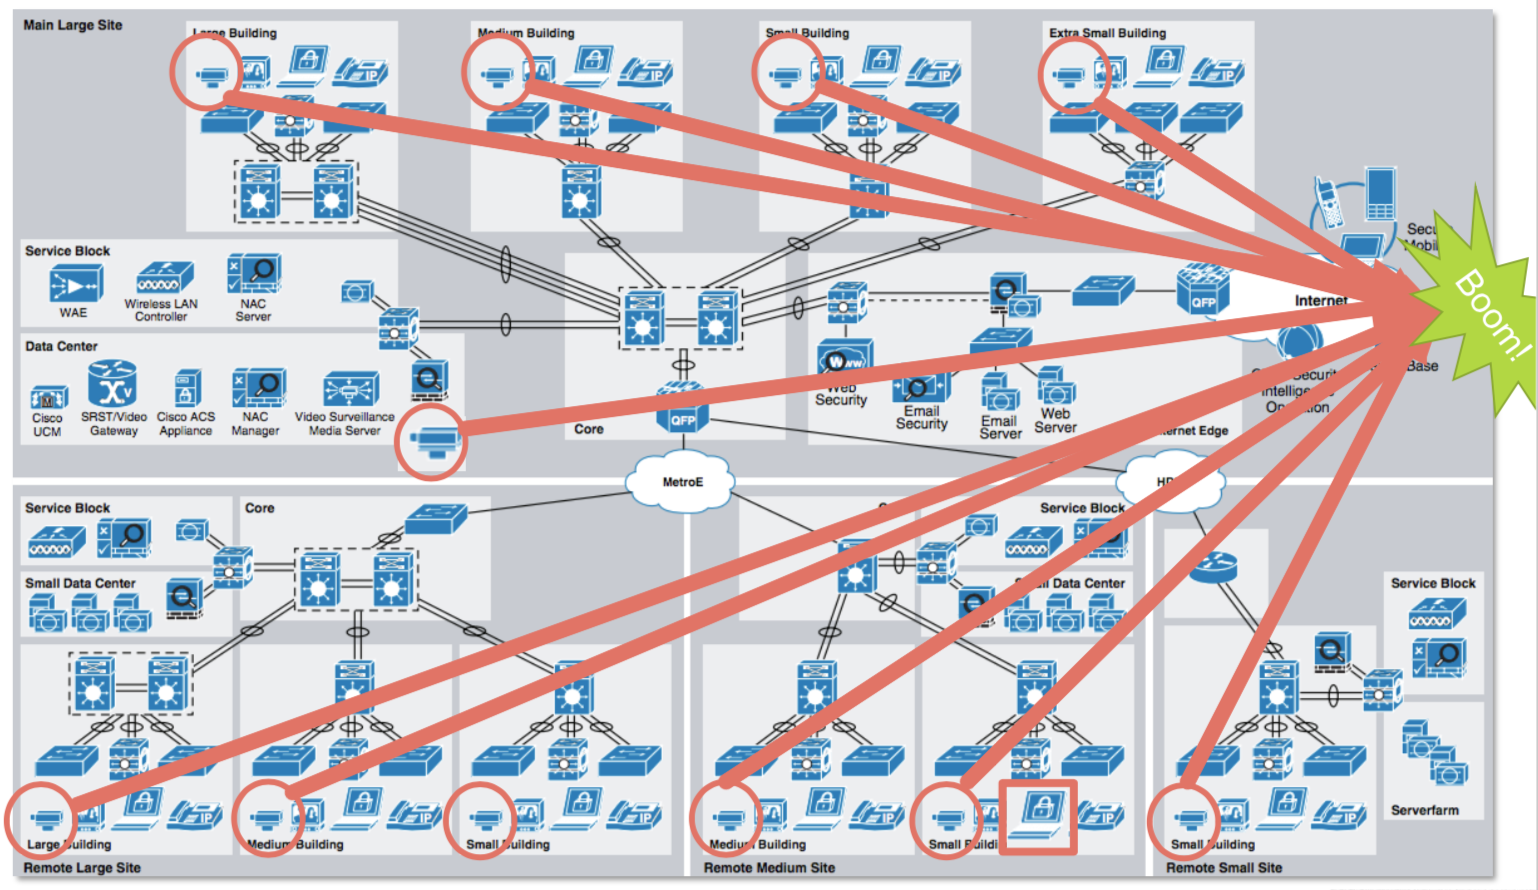
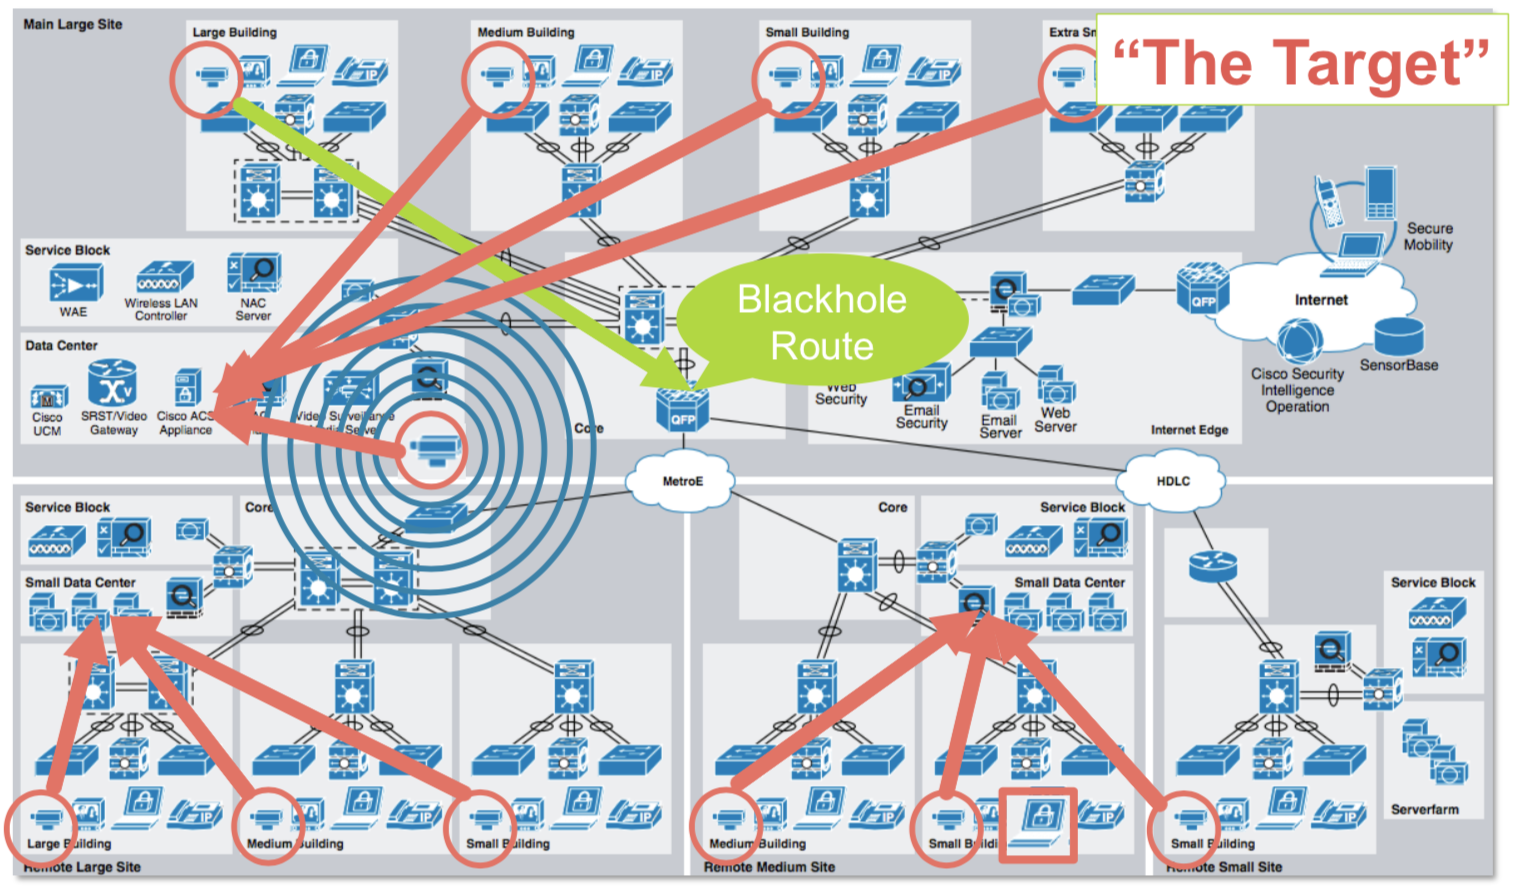
In both cases, most of the critical activity occurs behind the corporate firewall, making it extremely challenging to detect and mitigate these threats.
The talk discusses a number of techniques that service providers use to secure their networks that enterprises will need to adopt Continue reading
RESTful control of Cumulus Linux ACLs
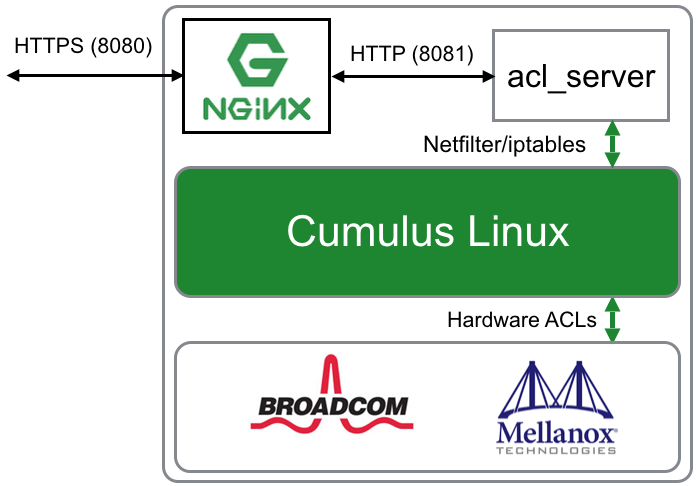
The Github pphaal/acl_server project INSTALL page describes how to install the acl_server daemon and configure the NGINX web server front end for the Cumulus Linux REST API to include the acl_server functions. The integration ensures that the same access controls configured for the REST API apply to the acl_server functions, which appear under the /acl/ path.
The following examples demonstrate the REST API.
Create an ACL
curl -X PUT -H 'Content-Type:application/json' --data '["[iptables]","-A FORWARD --in-interface swp+ -d 10.10.100.10 -p udp --sport 53 -j DROP"]' -k -u 'cumulus:CumulusLinux!' https://10.0.0.52:8080/acl/ddos1ACLs are sent as a JSON encoded array of strings. Each string will be written as a line in a file stored under /etc/cumulus/acl/policy.d/ - See Cumulus Linux: Netfilter - ACLs. For example, the rule above will be written to the file 50rest-ddos1.rules with the following Continue reading
Real-time WiFi heat map
Real-time Wifi-Traffic Heatmap (source code GitHub: cod3monk/showfloor-heatmap) displays real-time WiFi traffic from SC17 (The International Conference for High Performance Computing, Networking, Storage and Analysis, November 12-17, 2017). Click on the link to see live data.The Cisco Wireless access points in the conference network don't currently support sFlow, however, the access points are connected to Juniper EX switches which stream sFlow telemetry to an instance of sFlow-RT analytics software that provides real-time usage metrics for the heat map.
Wireless describes the additional visibility delivered by sFlow capable wireless access points, including: air time, channel, retransmissions, receive / transmit speeds, power, signal to noise ratio, etc. With sFlow enabled wireless access points, additional information could be layered on the heat map. The sFlow.org web site lists network products and vendors that support the sFlow standard.
Arista EOS CloudVision
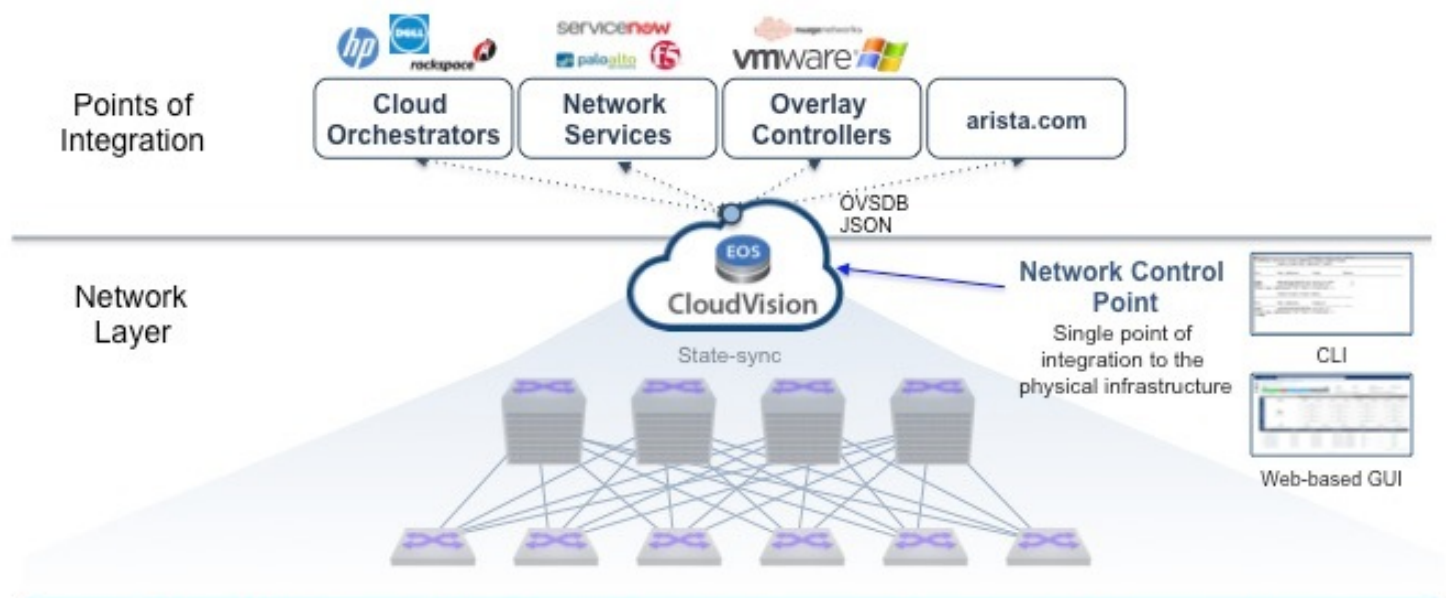
Fabric Visibility on Arista EOS Central describes how to use industry standard sFlow instrumentation in Arista switches to deliver real-time flow analytics. This article describes the steps needed to integrate flow analytics into CloudVision.
Log into the CloudVision node and run the following cvp_install_fabricview.sh script as root:
#!/bin/shEdit the cvp-api-topology.py script to Continue reading
# Install Fabric View on CloudVision Portal (CVP)
VER=`wget -qO - http://inmon.com/products/sFlow-RT/latest.txt`
wget http://www.inmon.com/products/sFlow-RT/sflow-rt-$VER.noarch.rpm
rpm --nodeps -ivh sflow-rt-$VER.noarch.rpm
/usr/local/sflow-rt/get-app.sh sflow-rt fabric-view
ln -s /cvpi/jdk/bin/java /usr/bin/java
sed -i '/^# http.hostname=/s/^# //' /usr/local/sflow-rt/conf.d/sflow-rt.conf
echo "http.html.redirect=./app/fabric-view/html/" >> /usr/local/sflow-rt/conf.d/sflow-rt.conf
cat <<EOT > /etc/nginx/conf.d/locations/sflow-rt.https.conf
location /sflow-rt/ {
auth_request /aeris/auth;
proxy_buffering off;
proxy_set_header X-Forwarded-For \$proxy_add_x_forwarded_for;
proxy_set_header X-Forwarded-Prefix /sflow-rt/;
proxy_set_header Host \$host;
proxy_pass http://localhost:8008/;
proxy_redirect ~^http://[^/]+(/.+)\$ /sflow-rt\$1;
}
EOT
systemctl restart nginx.service
firewall-cmd --zone public --add-port=6343/udp --permanent
firewall-cmd --reload
systemctl enable sflow-rt.service
systemctl start sflow-rt.service
wget http://www.inmon.com/products/sFlow-RT/cvp-eapi-topology.py
chmod +x cvp-eapi-topology.py
echo "configure and run cvp-eapi-topology.py"
Real-time visibility and control of campus networks
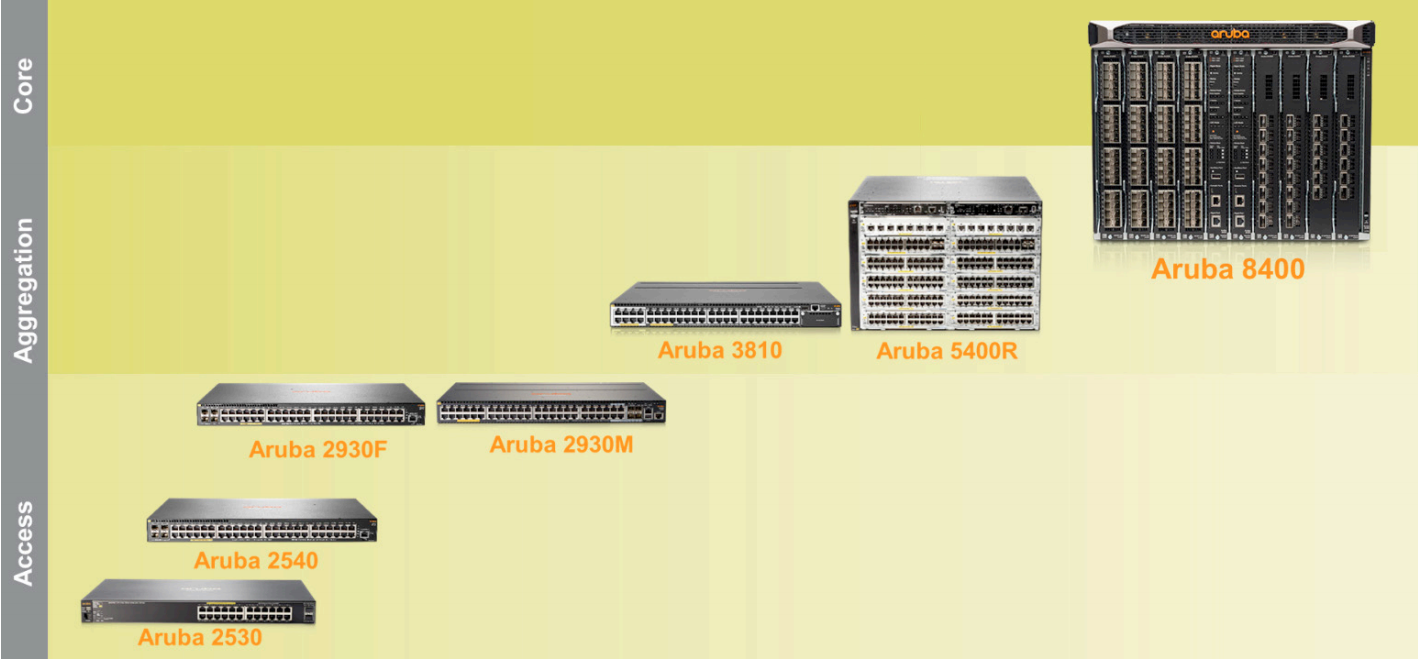
HPE Aruba has an extensive selection of campus switches that combine programmatic control via a REST API with hardware sFlow support:
- Aruba 2530
- Aruba 2540
- Aruba 2620
- Aruba 2930F
- Aruba 2930M
- Aruba 3810
- Aruba 5400R
- Aruba 8400

Peer-to-peer protocols (P2P) pose some unique challenges:
- P2P protocols make use of very large numbers of connections in order to quickly transfer data. The large number of connections allows a P2P user to obtain a disproportionate amount of network bandwidth; even a small number of P2P users (less than 0.5% of users) can consume over 90% of the network bandwidth.
- P2P protocols (and users) are very good Continue reading
Flow Trend
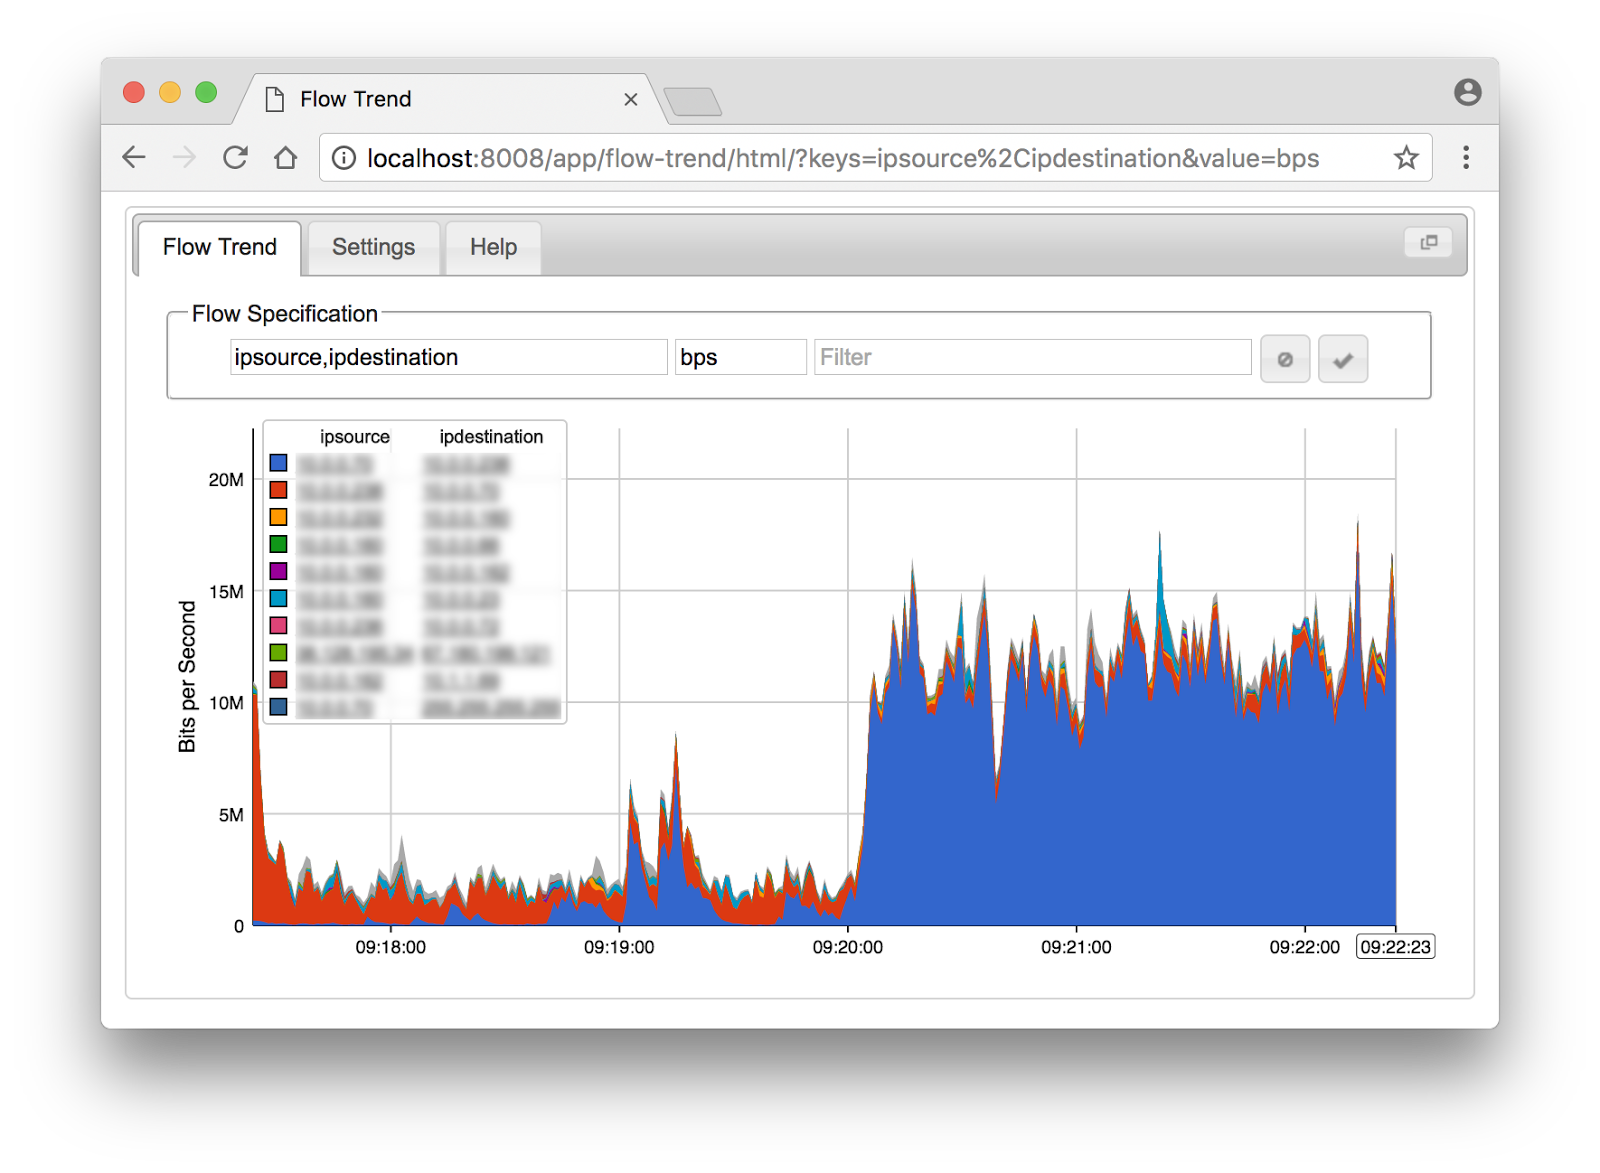
docker run -p 6343:6343/udp -p 8008:8008 sflow/flow-trendThe simplest way to run the software is using the docker. Configure network devices to send standard sFlow telemetry to Flow Trend. Access the web user interface on port 8008.
Real-time traffic visualization using Netflix Vizceral


The simplest way to run the software is to use the pre-built Docker image:
docker run -p 6343:6343/udp -p 8008:8008 sflow/vizceralThe Docker image also contains demo data based on Netflix's public cloud infrastructure:
docker run -e "RTPROP=-Dviz.demo=yes" -p 8008:8008 sflow/vizceral

Troubleshooting connectivity problems in leaf and spine fabrics

Unlike traditional hierarchical network designs, where a small number of links can be monitored to provide visibility, a leaf and spine network has no special links or switches where running CLI commands or attaching a probe would provide visibility. Even if it were possible to attach probes, the effective bandwidth of a leaf and spine network can be as high as a Petabit/second, well beyond the capabilities of current generation monitoring tools.
Fortunately, industry standard sFlow monitoring technology is built into the commodity switch hardware used to build leaf and spine networks. Enabling sFlow telemetry on all the switches in the network provides centralized, real-time, visibility into network traffic.

Cumulus Linux 3.4 REST API

The following ddos.js script is modified to use the REST API to send Network Command Line Utility - NCLU commands to add and remove ACLs, see Installing and Managing ACL Rules with NCLU:
var user = "cumulus";
var password = "CumulusLinux!";
var thresh = 10000;
var block_minutes = 1;

setFlow('udp_target',{keys:'ipdestination,udpsourceport',value:'frames'});

setThreshold('attack',{metric:'udp_target', value:thresh, byFlow:true, timeout:10});

function restCmds(agent,cmds) {
  for(var i = 0; i < cmds.length; i++) {
    let msg = {cmd:cmds[i]};
    http("https://"+agent+":8080/nclu/v1/rpc",
         "post","application/json",JSON.stringify(msg),user,password);
  }
}

var controls = {};
var id = 0;
setEventHandler(function(evt) {
  var key = evt.agent + ',' + evt.flowKey;
  if(controls[key]) return;

  var ifname = metric(evt.agent,evt.dataSource+".ifname")[0].metricValue;
  if(!ifname) return;

  var now = (new Date()).getTime();
  var name = 'ddos'+id++;
  var [ip,port] = evt.flowKey.split(',');
  var cmds = [
    'add acl ipv4 '+name+' drop udp source-ip any source-port '+port+' dest-ip '+ip+' dest-port any',
     Continue reading
Linux 4.11 kernel extends packet sampling support

Introduce psample, a general way for kernel modules to sample packets, without being tied to any specific subsystem. This netlink channel can be used by tc, iptables, etc. and allow to standardize packet sampling in the kernel commitThe psample netlink channel delivers sampled packet headers along with associated metadata from the Linux kernel to user space. The psample fields map directly into sFlow Version 5 sampled_header export structures:
| netlink psample | sFlow | Description |
|---|---|---|
| PSAMPLE_ATTR_IIFINDEX | input | Interface packet was received on. |
| PSAMPLE_ATTR_OIFINDEX | output | Interface packet was sent on. |
| PSAMPLE_ATTR_SAMPLE_GROUP | data source | The location within network device that generated packet sample. |
| PSAMPLE_ATTR_GROUP_SEQ | drops | Number of times that the sFlow agent detected that a packet marked to be sampled was dropped due to lack of resources. Agent calculates drops by tracking discontinuities in PSAMPLE_ATTR_GROUP_SEQ |
| PSAMPLE_ATTR_SAMPLE_RATE | sampling_rate | The Sampling Rate specifies the ratio of packets observed at the Data Source to the samples generated. For example a sampling rate of 100 specifies that, on Continue reading |
Arista eAPI
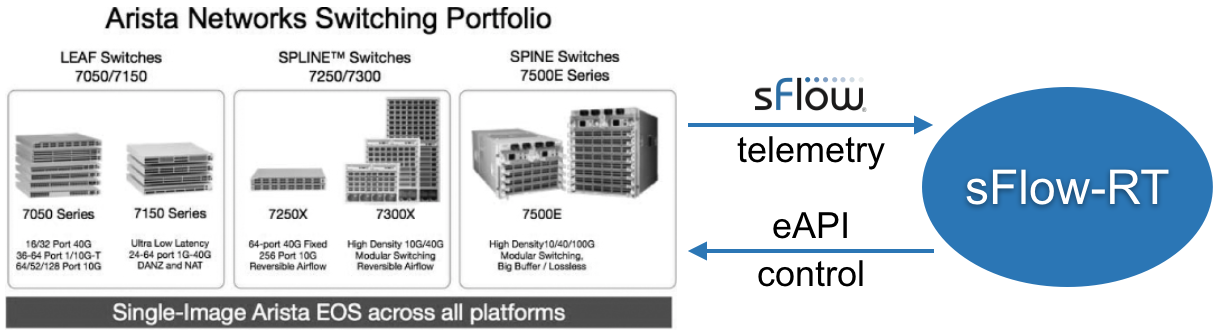
In the diagram, the sFlow-RT analytics engine receives streaming sFlow telemetry, provides real-time network-wide visibility, and automatically applies controls using eAPI to optimize forwarding, block denial of service attacks, or capture suspicious traffic.
Arista eAPI 101 describes the JSON RPC interface for programmatic control of Arista switches. The following eapi.js script shows how eAPI requests can be made using sFlow-RT's JavaScript API:
function runCmds(proto, agent, usr, pwd, cmds) {
  var req = {
    jsonrpc:'2.0',id:'sflowrt',method:'runCmds',
    params:{version:1,cmds:cmds,format:'json'}
  };
  var url = (proto || 'http')+'://'+agent+'/command-api';
  var resp = http(url,'post','application/json',JSON.stringify(req),usr,pwd);
  if(!resp) throw "no response";
  resp = JSON.parse(resp);
  if(resp.error) throw resp.error.message;
  return resp.result;
}
The following test.js script demonstrates the eAPI functionality with a basic show request: include('eapi.js');
var result = runCmds('http','10.0.0.90','admin','arista',['show hostname']);
logInfo(JSON.stringify(result));Starting sFlow-RT: env "RTPROP=-Dscript.file=test.js" ./start.shRunning the script generates the following output:
2017-07-10T14:00:06-0700 Continue reading
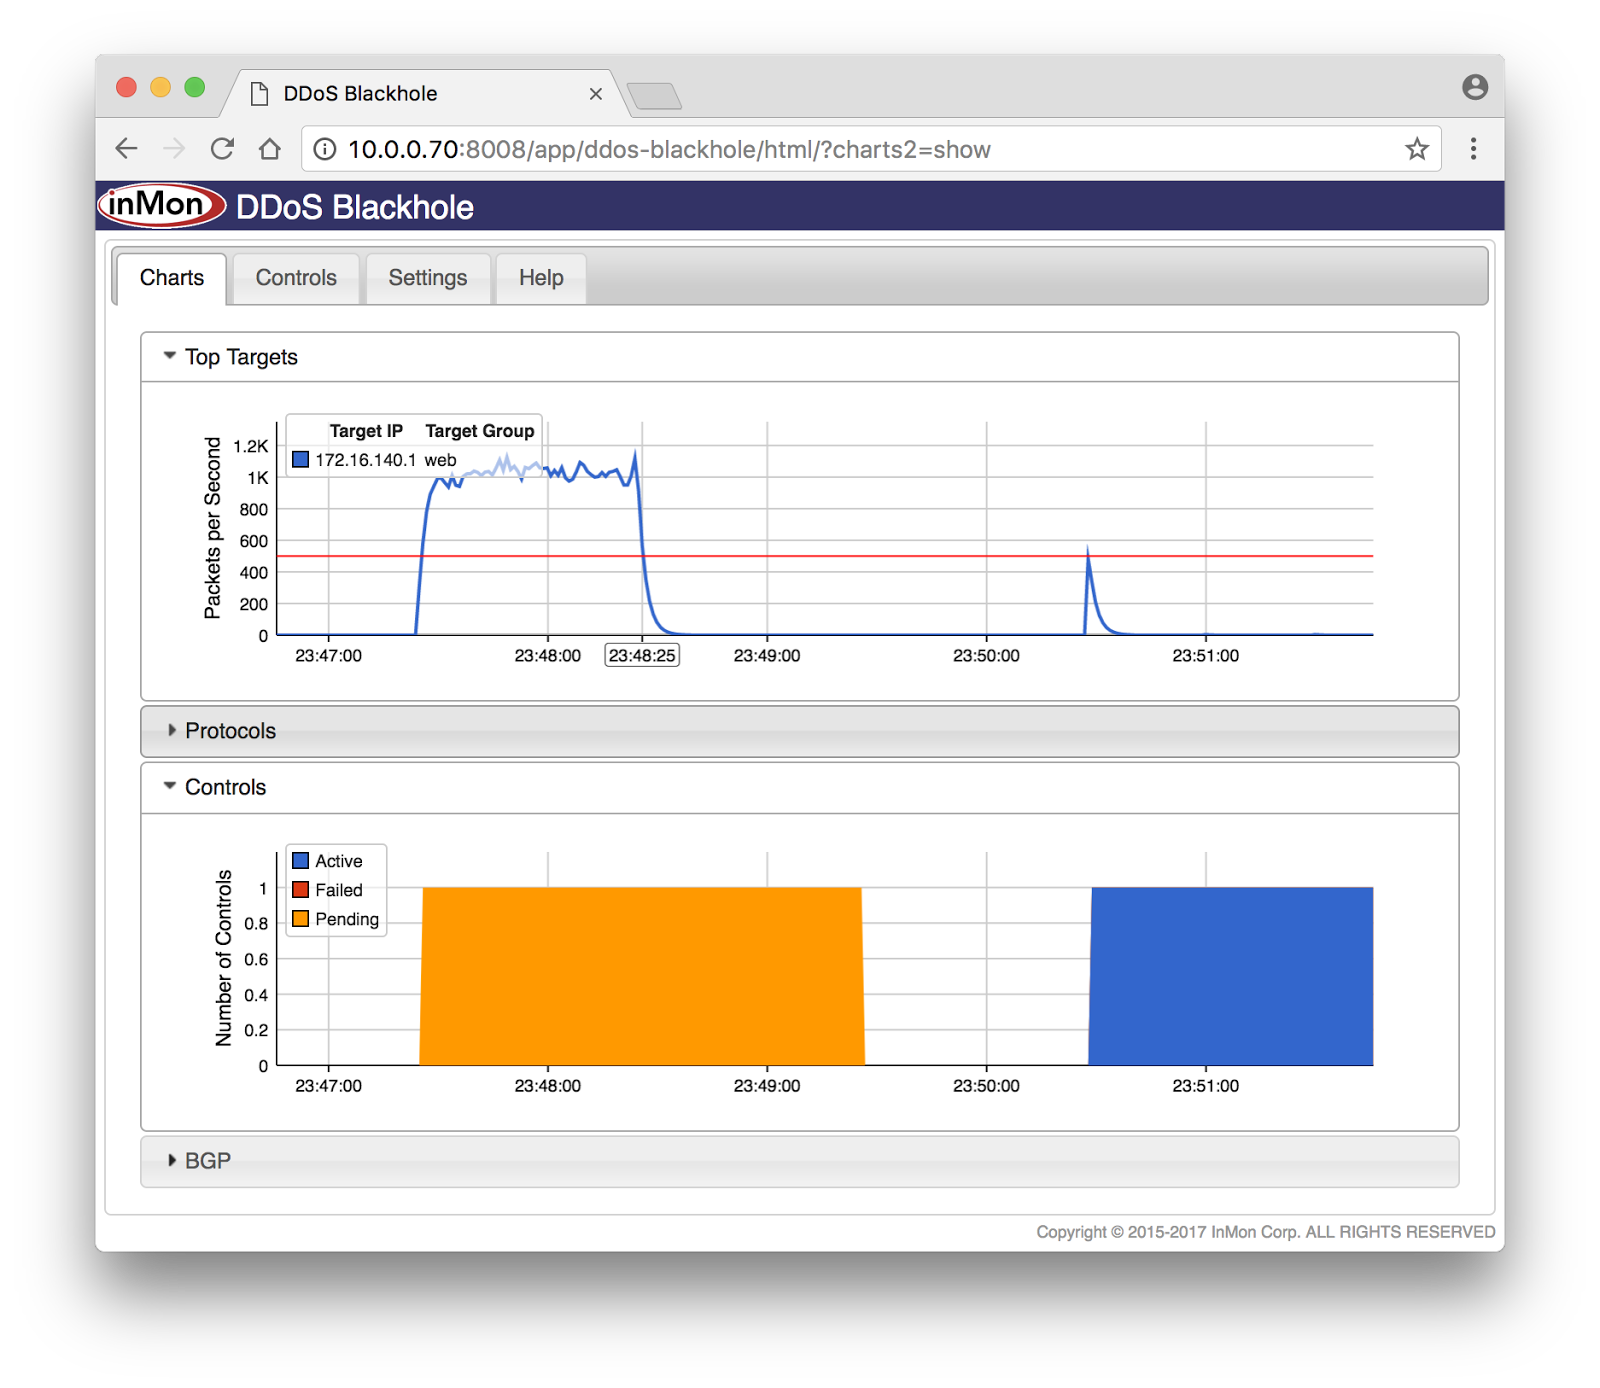
Real-time DDoS mitigation using sFlow and BGP FlowSpec

The BGP FlowSpec extension (RFC 5575: Dissemination of Flow Specification Rules) provides a method of transmitting traffic filters that selectively block the attack traffic while allowing normal traffic to pass. BGP FlowSpec support has recently been added to sFlow-RT and this article demonstrates the new capability.

The following flowspec.js sFlow-RT script detects and blocks UDP-Based Amplification attacks:
var router = '10.0.0.141';
var id = '10.0.0.70';
var as = 65141;
var thresh = 1000;
var block_minutes = 1;

setFlow('udp_target',{keys:'ipdestination,udpsourceport',value:'frames'});

setThreshold('attack',{metric:'udp_target', value:thresh, byFlow:true});

bgpAddNeighbor(router,as,id,{flowspec:true});

var  Continue reading
BGP FlowSpec on white box switch
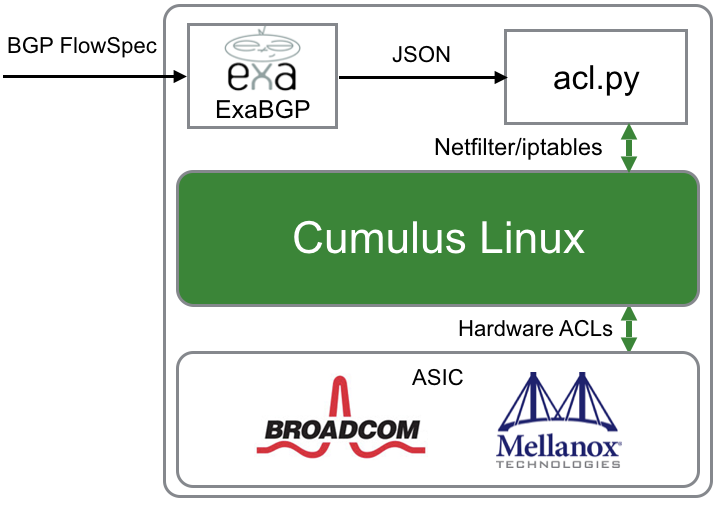
Unfortunately, FlowSpec is currently only available on high end routing devices and so experimenting with the technology is expensive. Looking for an alternative, Cumulus Linux is an open Linux platform that allows users to install Linux packages and develop their own software.
This article describes a proof of concept implementation of basic FlowSpec functionality using ExaBGP installed on a free Cumulus VX virtual machine. The same solution can be run on inexpensive commodity white box hardware to deliver terabit traffic filtering in a production network.
First, install latest version of ExaBGP on the Cumulus Linux switch:
curl -L https://github.com/Exa-Networks/exabgp/archive/4.0.0.tar.gz | tar zxNow define the handler, acl.py, that will convert BGP FlowSpec updates into standard Linux netfilter/iptables entries used by Cumulus Linux to specify hardware ACLs (see Netfilter - ACLs):
#!/usr/bin/python

import json
import re
from os import listdir,remove
from os.path import isfile
from  Continue reading
Remotely Triggered Black Hole (RTBH) Routing

The following configuration is installed on the ce-router:
router bgp 65140The ce-router peers with the upstream service provider router ( Continue reading
bgp router-id 0.0.0.140
neighbor 10.0.0.70 remote-as 65140
neighbor 10.0.0.70 port 1179
neighbor 172.16.141.2 remote-as 65141
!
address-family ipv4 unicast
neighbor 10.0.0.70 allowas-in
neighbor 10.0.0.70 route-map blackhole-in in
exit-address-family
!
ip community-list standard blackhole permit 65535:666
!
route-map blackhole-in permit 20
match community blackhole
match ip address prefix-len 32
set ip next-hop 192.0.2.1
Arista EOS telemetry

Linux as a Switch Operating System: Five Lessons Learned identifies benefits of using Linux as the basis for EOS. In this context, the Linux operating system made it easy to port the Host sFlow agent, use standard Linux package management (RPM Package Manager), and gather metrics using standard Linux APIs. A new eAPI module automatically synchronizes the Host sFlow daemon with the EOS sFlow configuration.
The following sflowtool output shows the additional metrics contributed by a Host sFlow agent installed on an Arista switch:
startDatagram =================================
datagramSourceIP 172.17.0.1
datagramSize 704
unixSecondsUTC 1490843418
datagramVersion 5
agentSubId 100000
agent 10.0.0.90
packetSequenceNo 714
sysUpTime 0
samplesInPacket 1
startSample ----------------------
sampleType_tag 0:2
sampleType COUNTERSSAMPLE
sampleSequenceNo 714
sourceId 2:1
counterBlock_tag 0:2001
counterBlock_tag 0:2010
udpInDatagrams 1459
udpNoPorts 16
udpInErrors 0
udpOutDatagrams 4765
udpRcvbufErrors 0
udpSndbufErrors 0
udpInCsumErrors 0
counterBlock_tag 0:2009
tcpRtoAlgorithm 1
tcpRtoMin 200
tcpRtoMax 120000
tcpMaxConn 4294967295
tcpActiveOpens 102
 Continue reading
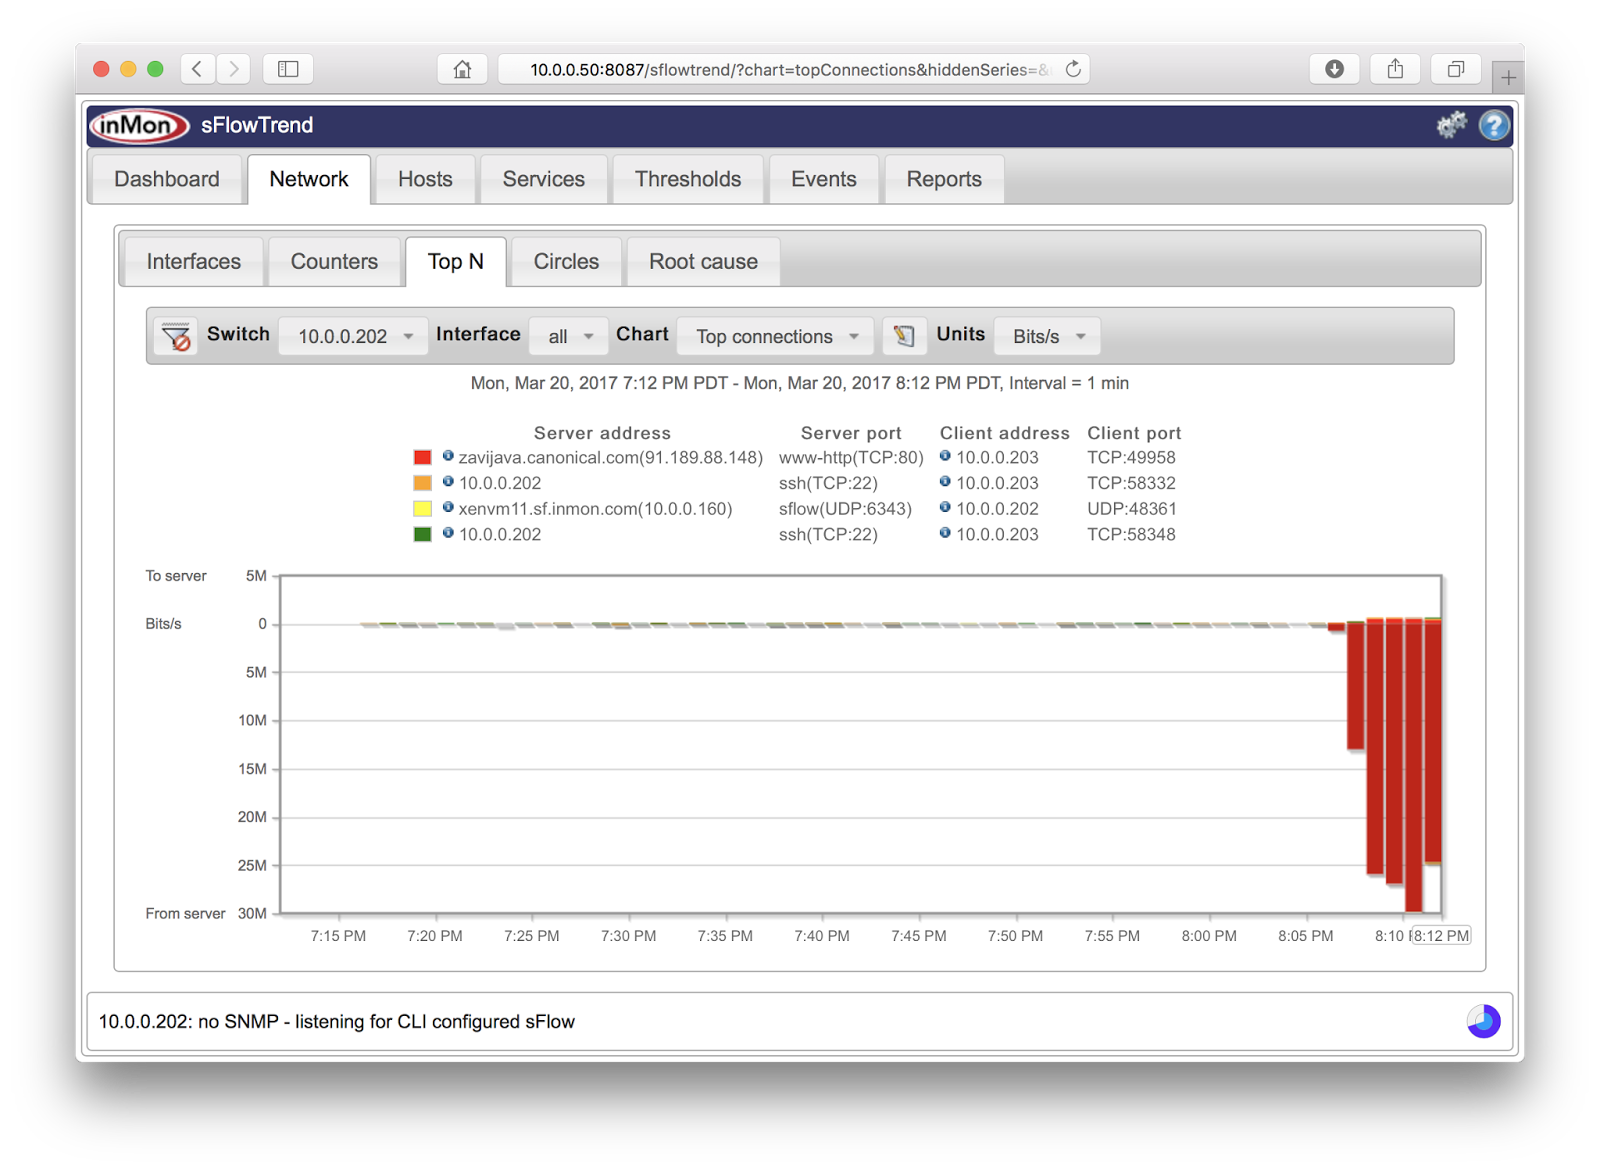
Nutanix
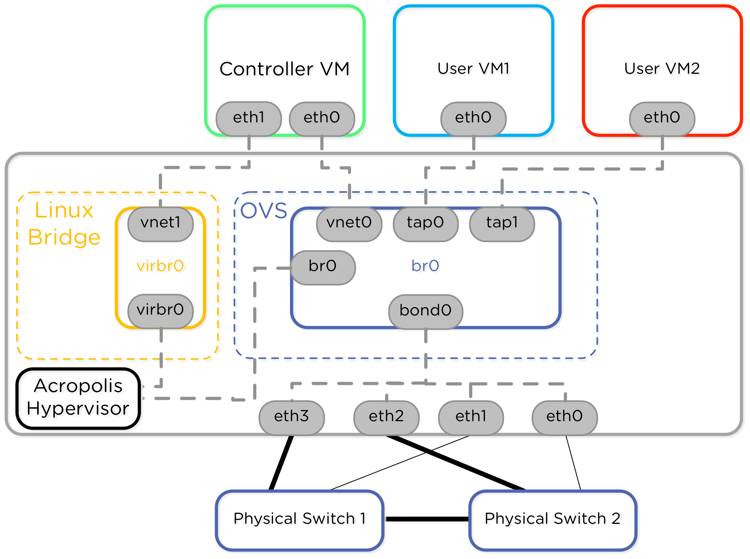
This article is based on a single hardware node running Nutanix Community Edition (CE), built following the instruction in Part I: How to setup a three-node NUC Nutanix CE cluster. If you don't have hardware readily available, the article, 6 Nested Virtualization Resources To Get You Started With Community Edition, describes how to run Nutanix CE as a virtual machine.The sFlow standard is widely supported by network equipment vendors, which combined with sFlow from each Nutanix appliance, delivers end to end visibility in the Nutanix cluster. The following screen captures from the free sFlowTrend tool are representative examples of the data available from the Nutanix appliance.
QUIC

An easy way to see if you have any QUIC traffic on your network is to use the standard sFlow instrumentation built into network switches. Configure the switches to send sFlow telemetry to an sFlow collector for visibility into network traffic.
For example, use Docker to run the sFlow-RT active-flows application to analyze the sFlow data stream:
docker run -p 6343:6343/udp -p 8008:8008 -d sflow/top-flowsAccess the web interface at http://localhost:8008/ and enter the following Flow Specification to monitor QUICK flows:
dns:ipsource,dns:ipdestination,quicpackettypeNote: Real-time domain name lookups describes how sFlow-RT incorporates DNS (Domain Name Service) requests in its real-time analytics pipeline so that traffic flows can be identified by domain name.

Telegraf, InfluxDB, Chronograf, and Kapacitor
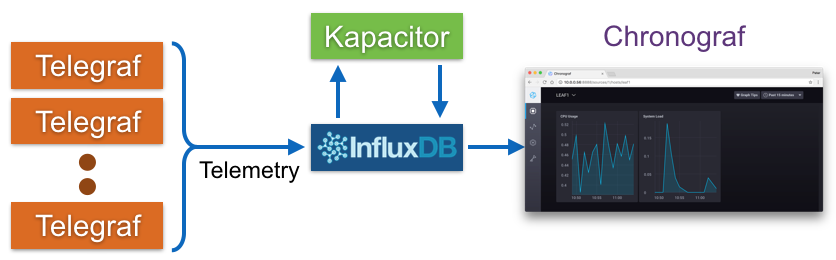
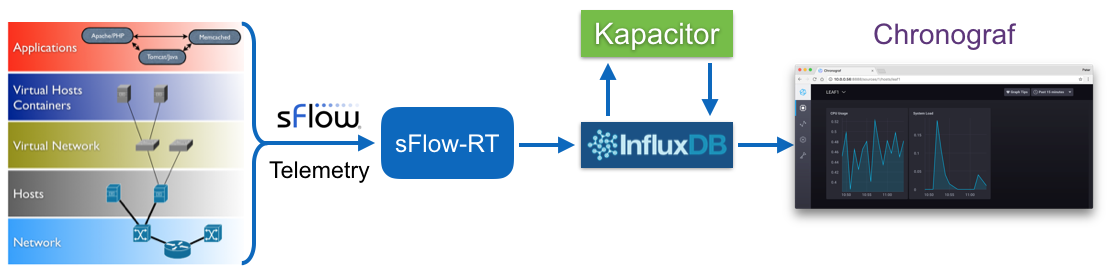
The following telegraf.js script instructs sFlow-RT to periodically export host metrics to InfluxDB:
var influxdb = "http://10.0.0.56:8086/write?db=telegraf";

function sendToInfluxDB(msg) {
  if(!msg || !msg.length) return;

  var req = {
    url:influxdb,
    operation:'POST',
    headers:{"Content-Type":"text/plain"},
    body:msg.join('\n')
  };
  req.error = function(e) {
    logWarning('InfluxDB POST failed, error=' + e);
  }
  try { httpAsync(req); }
  catch(e) {
    logWarning('bad request ' + req.url + ' ' + e);
  }
}

var metric_names = [
   Continue reading
Using Ganglia to monitor Linux services
