Cloudflare’s tenant platform in action: Meter deploys DNS filtering at scale
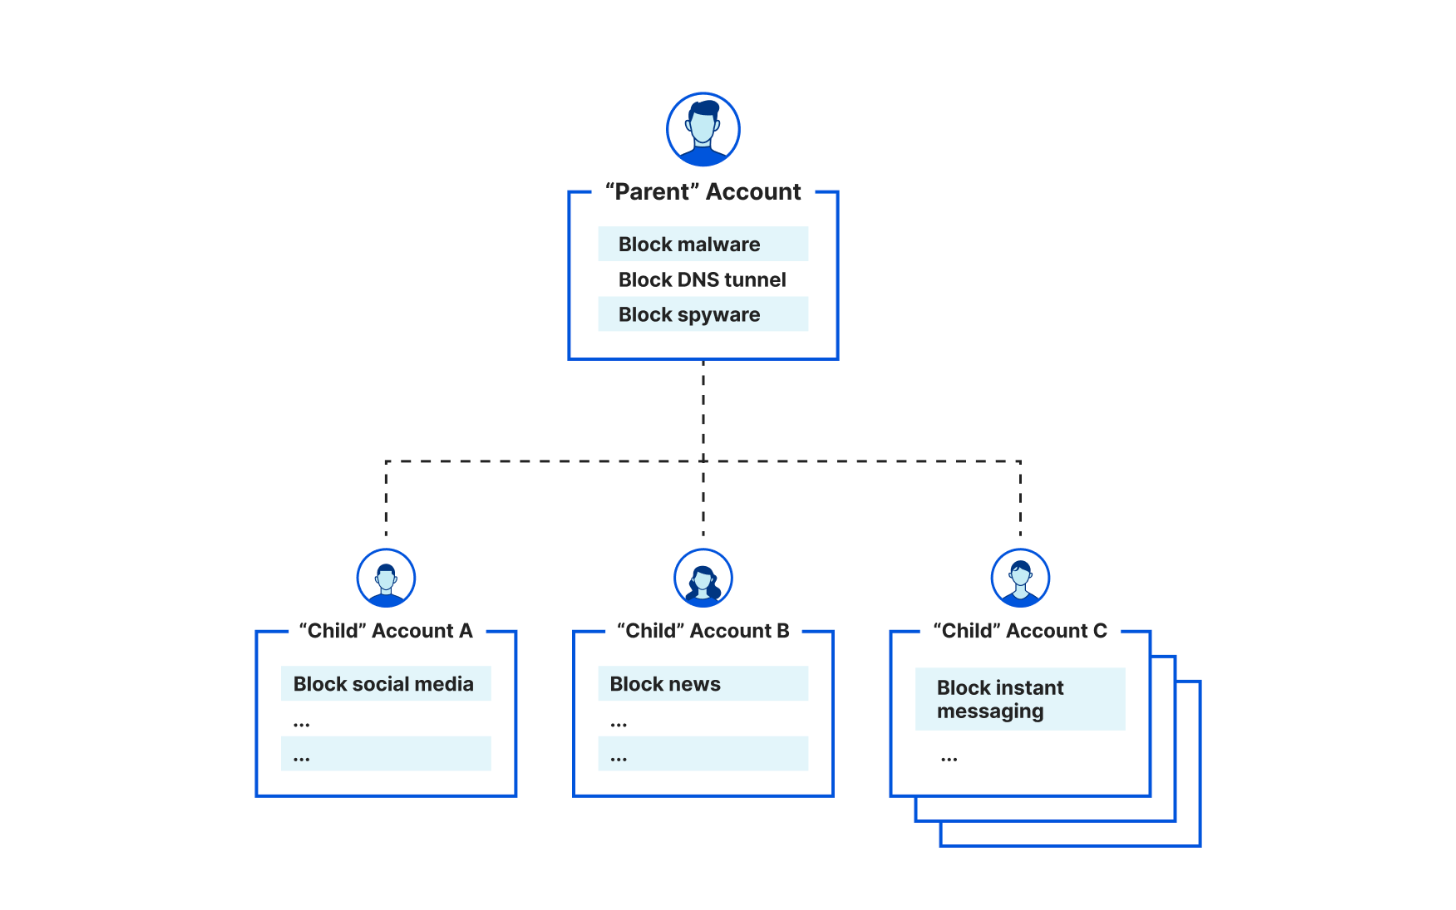
In January 2023, we announced support for Managed Service Providers (MSPs) and other businesses to create 'parent-child' and account-level policy configurations when deploying Cloudflare for DNS filtering. Specifically, organizations leverage the integration between our Tenant API and Cloudflare Gateway, our Secure Web Gateway (SWG) to protect their remote or office end users with web filtering and inspection. Already, customers like the US federal government, MalwareBytes, and a large global ISP take advantage of this integration to enable simpler, more flexible policy management across larger deployments across their end customers
Today, we're excited to showcase another similar story: Meter, a provider of Internet infrastructure, is leveraging the Tenant API integration for DNS filtering to help their clients enforce acceptable Internet use policies.
How Meter deploys Cloudflare to secure Internet browsing
Meter, headquartered in San Francisco and founded in 2015, provides Internet infrastructure that includes routing, switching, wireless, and applications. They help deliver faster, more efficient, more secure networking experiences for a diverse range of corporate spaces, including offices, warehouses, retail, manufacturing, biotech, and education institutions.
Meter integrates with the Cloudflare Tenant API to provide DNS filtering to their customers. With the Meter dashboard, Meter customers can set policies to Continue reading
Grave flaws in BGP Error handling
Grave flaws in BGP Error handling
Border Gateway Protocol is the de facto protocol that directs routing decisions between different ISP networks, and is generally known as the “glue”
Worth Reading: Looking Inside Large Language Models
Bruce Davie published an interesting overview article about Large Language Models. It would be worth reading just for the copious links to in-depth article; I particularly like his conclusions:
We mistake performance (producing realistic text) for competence (understanding the world).
Having a model for language is different from having a model of the world.
And that’s a perfect explanation why it makes no sense to expect ChatGPT and friends to produce picture-perfect device configurations or always-working code.
Is One Protocol Simpler Than Two?
I’ve been in a lot of interesting discussions the last couple of days on what protocol to use for the underlay when building a VXLAN datacenter network. Do you use an IGP such as OSPF or ISIS or do you use BGP? A common argument for BGP is that running one protocol is less complex than two. Is it, though?
We can argue about if OSPF or BGP is the more well known protocol. What I think is going on here though is that OSPF is perceived as complex due to the following reasons:
- Utilizes both unicast and multicast for messaging.
- Maintains a link state database and runs SPF to calculate best paths.
- Different LSA types and flooding behavior.
- Does not advertise routes.
On the other hand, BGP has the following characteristics:
- Utilizes only unicast for messaging.
- Rides over TCP.
- Advertises prefixes (NLRI).
Is OSPF complex? That’s debateable but everything is difficult if you don’t know it well enough. If you don’t know your way around the LSDB then it can be difficult to understand how routes get into the RIB and later FIB. Not knowing a protocol doesn’t make it complex, though. I would argue that someone with the Continue reading
Tech Bytes: How StackPath Uses Catchpoint’s Internet Performance Monitoring To Accelerate MTTI (Sponsored)
Today on the Tech Bytes podcast we talk about monitoring network and application performance. Our sponsor is Catchpoint, and they’ve sent a customer, StackPath, to talk about using Catchpoint in production. This includes real-time BGP monitoring and Catchpoint’s observability network that lets you test networks and applications from multiple vantage points, and instant tests when you need immediate data.Tech Bytes: How StackPath Uses Catchpoint’s Internet Performance Monitoring To Accelerate MTTI (Sponsored)
Today on the Tech Bytes podcast we talk about monitoring network and application performance. Our sponsor is Catchpoint, and they’ve sent a customer, StackPath, to talk about using Catchpoint in production. This includes real-time BGP monitoring and Catchpoint’s observability network that lets you test networks and applications from multiple vantage points, and instant tests when you need immediate data.
The post Tech Bytes: How StackPath Uses Catchpoint’s Internet Performance Monitoring To Accelerate MTTI (Sponsored) appeared first on Packet Pushers.
Network Break 444: NVIDIA Mines GPU Gold; VMware Wants To Sell You Private AI; SUSE Prepares To Go Private
Take a Network Break! On today's episode we discuss two announcements from VMware Explore 2023: a private AI offering, and a revamped NSX for public and private cloud networking. We also discuss recent rule changes at the SEC that require public companies to disclose material security incidents in a timely manner, NVIDIA's huge revenue results, SUSE going private, and more tech news.Network Break 444: NVIDIA Mines GPU Gold; VMware Wants To Sell You Private AI; SUSE Prepares To Go Private
Take a Network Break! On today's episode we discuss two announcements from VMware Explore 2023: a private AI offering, and a revamped NSX for public and private cloud networking. We also discuss recent rule changes at the SEC that require public companies to disclose material security incidents in a timely manner, NVIDIA's huge revenue results, SUSE going private, and more tech news.
The post Network Break 444: NVIDIA Mines GPU Gold; VMware Wants To Sell You Private AI; SUSE Prepares To Go Private appeared first on Packet Pushers.
Mac, iPad, or Both?
Both Jason Snell and John Gruber, both stalwarts in the Apple journalism world, have recently weighed in on this topic. Jason says he’s given up on the iPad-only travel dream; John says he keeps throwing his iPad in his bag when he travels, even if he never uses it. I have thoughts on this topic—as you might think, considering I decided to write about it! (Ah, but what device did I use to write?)
Jason kicks off the discussion with a review of his iPad travel usage, which until the arrival of Apple Silicon, was going along swimmingly. Now, with Apple Silicon-powered Macs, things are different:
In the battle between iPad and Mac, I’m a longtime member of Team Both—I use my Mac most of the day at my desk, but when I write elsewhere in the house or backyard, I switch to an iPad Pro in the Magic Keyboard case. And that iPad (in a regular case) is my primary computing device when I’m not in work mode…But here I sit at my mother’s dining room table, typing on a MacBook Air. Something has changed in my approach to travel, and I’m trying to understand just Continue reading
C 001. Intro into the IPv4/IPv6 Application Support from the Software/System Point of View.
Dear friend,
Being a long-time network engineer, I’ve seen (and done) it all: talking about about IPv6, designing and implementing IPv6 in production service providers and data center networks, holly wars IPv6 vs IPv4, industries saying they aren’t going to use IPv6 ever, and many others. For some network engineers, it could be even quite an “innovation” project (I clearly remember some senior person told me back in 2018 that introduction of IPv6 is an innovation; quite a statement in the 20-years anniversary of IPv6). But today I want to talk about it from a different angle.
How Is Network Relevant for Software?
In many cases every day we rely on the software, which works over Internet: whatever you need to buy or sell some goods, order a table in your favorite cafe, book ticket to train to visit your friends. Connected world is around us and, if for whatever reason it breaks, our life immediately becomes much more difficult. That’s because the applications rely on the Internet and their capability to provide you the service depends on their capabilities to connect from your smartphone or laptop to the application servers. And this capability is significantly affected by Continue reading
Why Distributedness is a Measure of Digital Maturity
Digital maturity takes a lot of work and a variety of skill sets. That’s why multi-cloud networking (MCN) exists as a market and why it continues to gain traction.ARP Details Behind the Scenes
When figuring out how unnumbered IPv4 interfaces work, Daniel Dib asked an interesting question: How does ARP work when the source and destination IPv4 address are not in the same segment (as is usually the case when using unnumbered interfaces)?
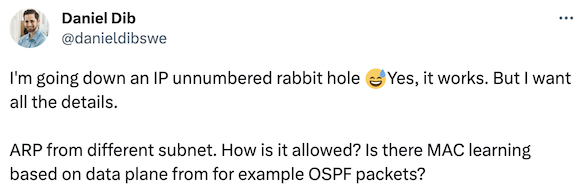
TL&DR: ARP doesn’t care about subnets. If the TCP/IP stack needs to find a MAC address of a node it thinks is adjacent, ARP does its best, no matter what.
ARP Details Behind the Scenes
When figuring out how unnumbered IPv4 interfaces work, Daniel Dib asked an interesting question: How does ARP work when the source and destination IPv4 address are not in the same segment (as is usually the case when using unnumbered interfaces)?
TL&DR: ARP doesn’t care about subnets. If the TCP/IP stack needs to find a MAC address of a node it thinks is adjacent, ARP does its best, no matter what.
The Network Times 2023-08-27 09:59:00

Available at Leanpub and Amazon
About This Book
A modern application typically comprises several modules, each assigned specific roles and responsibilities within the system. Application architecture governs the interactions and communications between these modules and users. One prevalent architecture is the three-tier architecture, encompassing the Presentation, Application, and Data tiers. This book explains how you can build a secure and scalable networking environment for your applications running in Microsoft Azure. Besides a basic introduction to Microsoft Azure, the book explains various solutions for Virtual Machines Internet Access, connectivity, security, and scalability perspectives.
Azure Basics: You will learn the hierarchy of Microsoft Azure datacenters, i.e., how a group of physical datacenters forms an Availability Zone within the Azure Region. Besides, you learn how to create a Virtual Network (VNet), divide it into subnets, and deploy Virtual Machines (VM). You will also learn how the subnet in Azure differs from the subnet in traditional networks.
Internet Access: Depending on the role of the application, VMs have different Internet access requirements. Typically, front-end VMs in the presentation tier/DMZ are visible on the Internet, allowing external hosts to initiate connections. VMs in the Application and Data tiers are rarely accessible from Continue reading