0

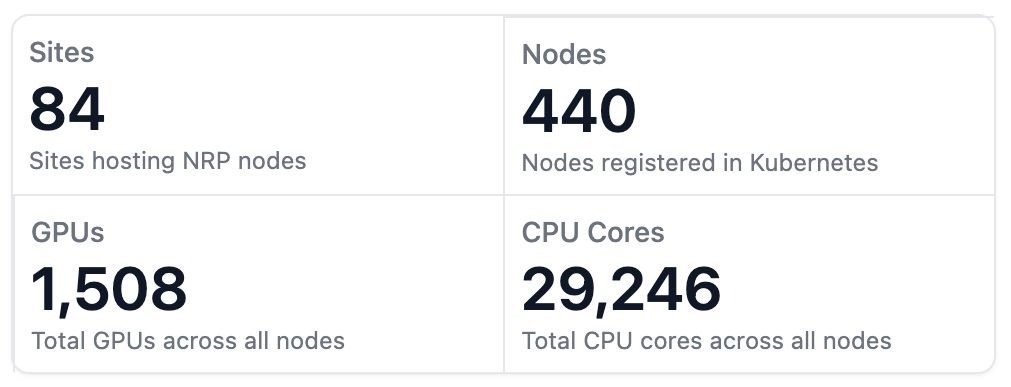
The National Research Platform (NRP) operates a globally distributed, high-performance computing and networking environment, with an average of 15,000 pods across 450 nodes supporting more than 3,000 scientific project namespaces. With its head node in San Diego, NRP connects research institutions and data centers worldwide via links ranging from 10 to 400 Gbps, serving more than 5,000 users in 70+ locations.
- Non-profit company
- Uses Calico Open Source
NRP is a partnership of more than 50 institutions, led by researchers at UC San Diego, University of Nebraska-Lincoln, and Massachusetts Green High Performance Computing Center and includes contributions by the National Science Foundation, the Department of Energy, the Department of Defense, and many research universities and R&E networking organizations in the US and around the world.
Challenges
Complex Network Visibility and Debugging
NRP needed a way to diagnose connectivity problems across globally distributed storage nodes. Frequent changes to edge network configurations, ACLs, firewalls, and static routes caused blocked ports, forcing manual troubleshooting with tools such as nmap and iperf. This process slowed down root-cause analysis and problem resolution.
Balancing Performance with Granular Security at Scale
Scientific workflows demanded maximum throughput over 100/400 Gbps links and jumbo frames. Traditional host firewalls introduced unacceptable Continue reading
