Sponsored We all know AI and machine learning rely on vast amounts of data, just as we all know the Internet is largely cat videos and other user-generated content no one ever looks at. …
Today's Day Two Cloud podcast dives into Cloud Development Kits (CDKs). How do CDKs differ from tools such as Terraform? What are the selling points for CDKs for infrastructure and development professionals? Our guest is Michael Levan, Researcher and Consultant at GigaOM.
Today's Day Two Cloud podcast dives into Cloud Development Kits (CDKs). How do CDKs differ from tools such as Terraform? What are the selling points for CDKs for infrastructure and development professionals? Our guest is Michael Levan, Researcher and Consultant at GigaOM.
How do you measure IT Security ? Specifically, how do you decide to allocate budget and justify the underlying reasoning. Most companies allocate a percentage of IT Budget, but Johna argues differently.
How do you measure IT Security ? Specifically, how do you decide to allocate budget and justify the underlying reasoning. Most companies allocate a percentage of IT Budget, but Johna argues differently.
Enterprises can look for more transparency from software vendors after the Biden Administration’s recent mandate that software bills of materials be provided by companies attempting to do business with the federal government.Software bills of materials, frequently abbreviated to SBOMs, aren’t a new concept. The idea comes from the manufacturing sector, where it’s often crucial for buyers to fully understand the components and materials that were used to make a particular piece of equipment.The 10 most powerful companies in enterprise networking 2021
For example, a train engine might contain parts that aren’t rated for certain levels of vibration stress, making it unsuitable for use on a particular type of track. The goal of an SBOM is similar, listing all the proprietary, open source, and licensed components being used in a particular piece of software, so that a buyer can review it and check whether any of those components are outdated or insecure.To read this article in full, please click here
As a policymaker or executive, do you worry about your data getting stolen or intercepted? Or your website suffering an attack? Or your services being shut down? Today on the MANRS blog, we’re introducing new primers that explain why you should care about routing security and simple steps you can take to decrease routing security […]
Cloudflare is known for innovation, for needle-moving projects that help make the Internet better. For Impact Week, we wanted to take this approach to innovation and apply it to the environmental impact of the Internet. When it comes to tech and the environment, it’s often assumed that the only avenue tech has open to it is harm mitigation: for example, climate credits, carbon offsets, and the like. These are undoubtedly important steps, but we wanted to take it further — to get into harm reduction. So we asked — how can the Internet at large use less energy and be more thoughtful about how we expend computing resources in the first place?
Cloudflare has a global view into the traffic of the Internet. More than 1 in 6 websites use our network, and we observe the traffic flowing to and from them continuously. While most people think of surfing the Internet as a very human activity, nearly half of all traffic on the global network is generated by automated systems.
We've analyzed this automated traffic, from so-called “bots,” in order to understand the environmental impact. Most of the bot traffic is malicious. Cloudflare protects our clients from this malicious traffic Continue reading
Today we’re excited to announce Smart Edge Revalidation. It was designed to ensure that compute resources are synchronized efficiently between our edge and a browser. Right now, as many as 30% of objects cached on Cloudflare’s edge do not have the HTTP response headers required for revalidation. This can result in unnecessary origin calls. Smart Edge Revalidation fixes this: it does the work to ensure that these headers are present, even when an origin doesn’t send them to us. The advantage of this? There’s less wasted bandwidth and compute for objects that do not need to be redownloaded. And there are faster browser page loads for users.
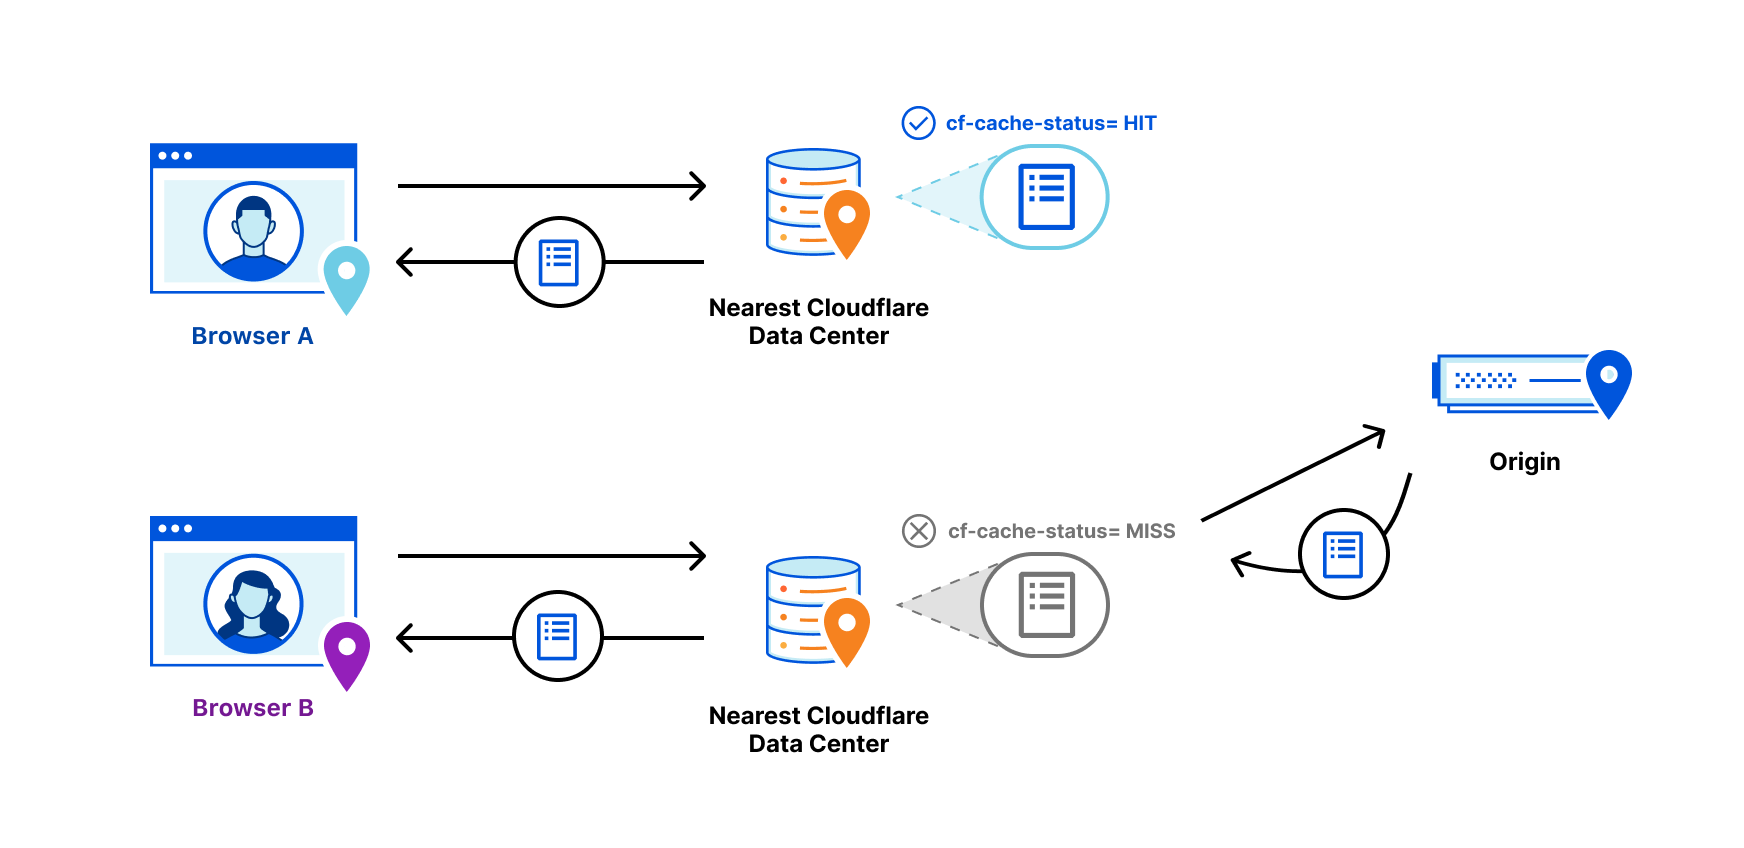
So What Is Revalidation?
Revalidation is one part of a longer story about efficiently serving objects that live on an origin server from an intermediary cache. Visitors to a website want it to be fast. One foundational way to make sure that a website is fast for visitors is to serve objects from cache. In this way, requests and responses do not need to transit unnecessary parts of the Internet back to an origin and, instead, can be served from a data center that is closer to the visitor. As such, website operators Continue reading
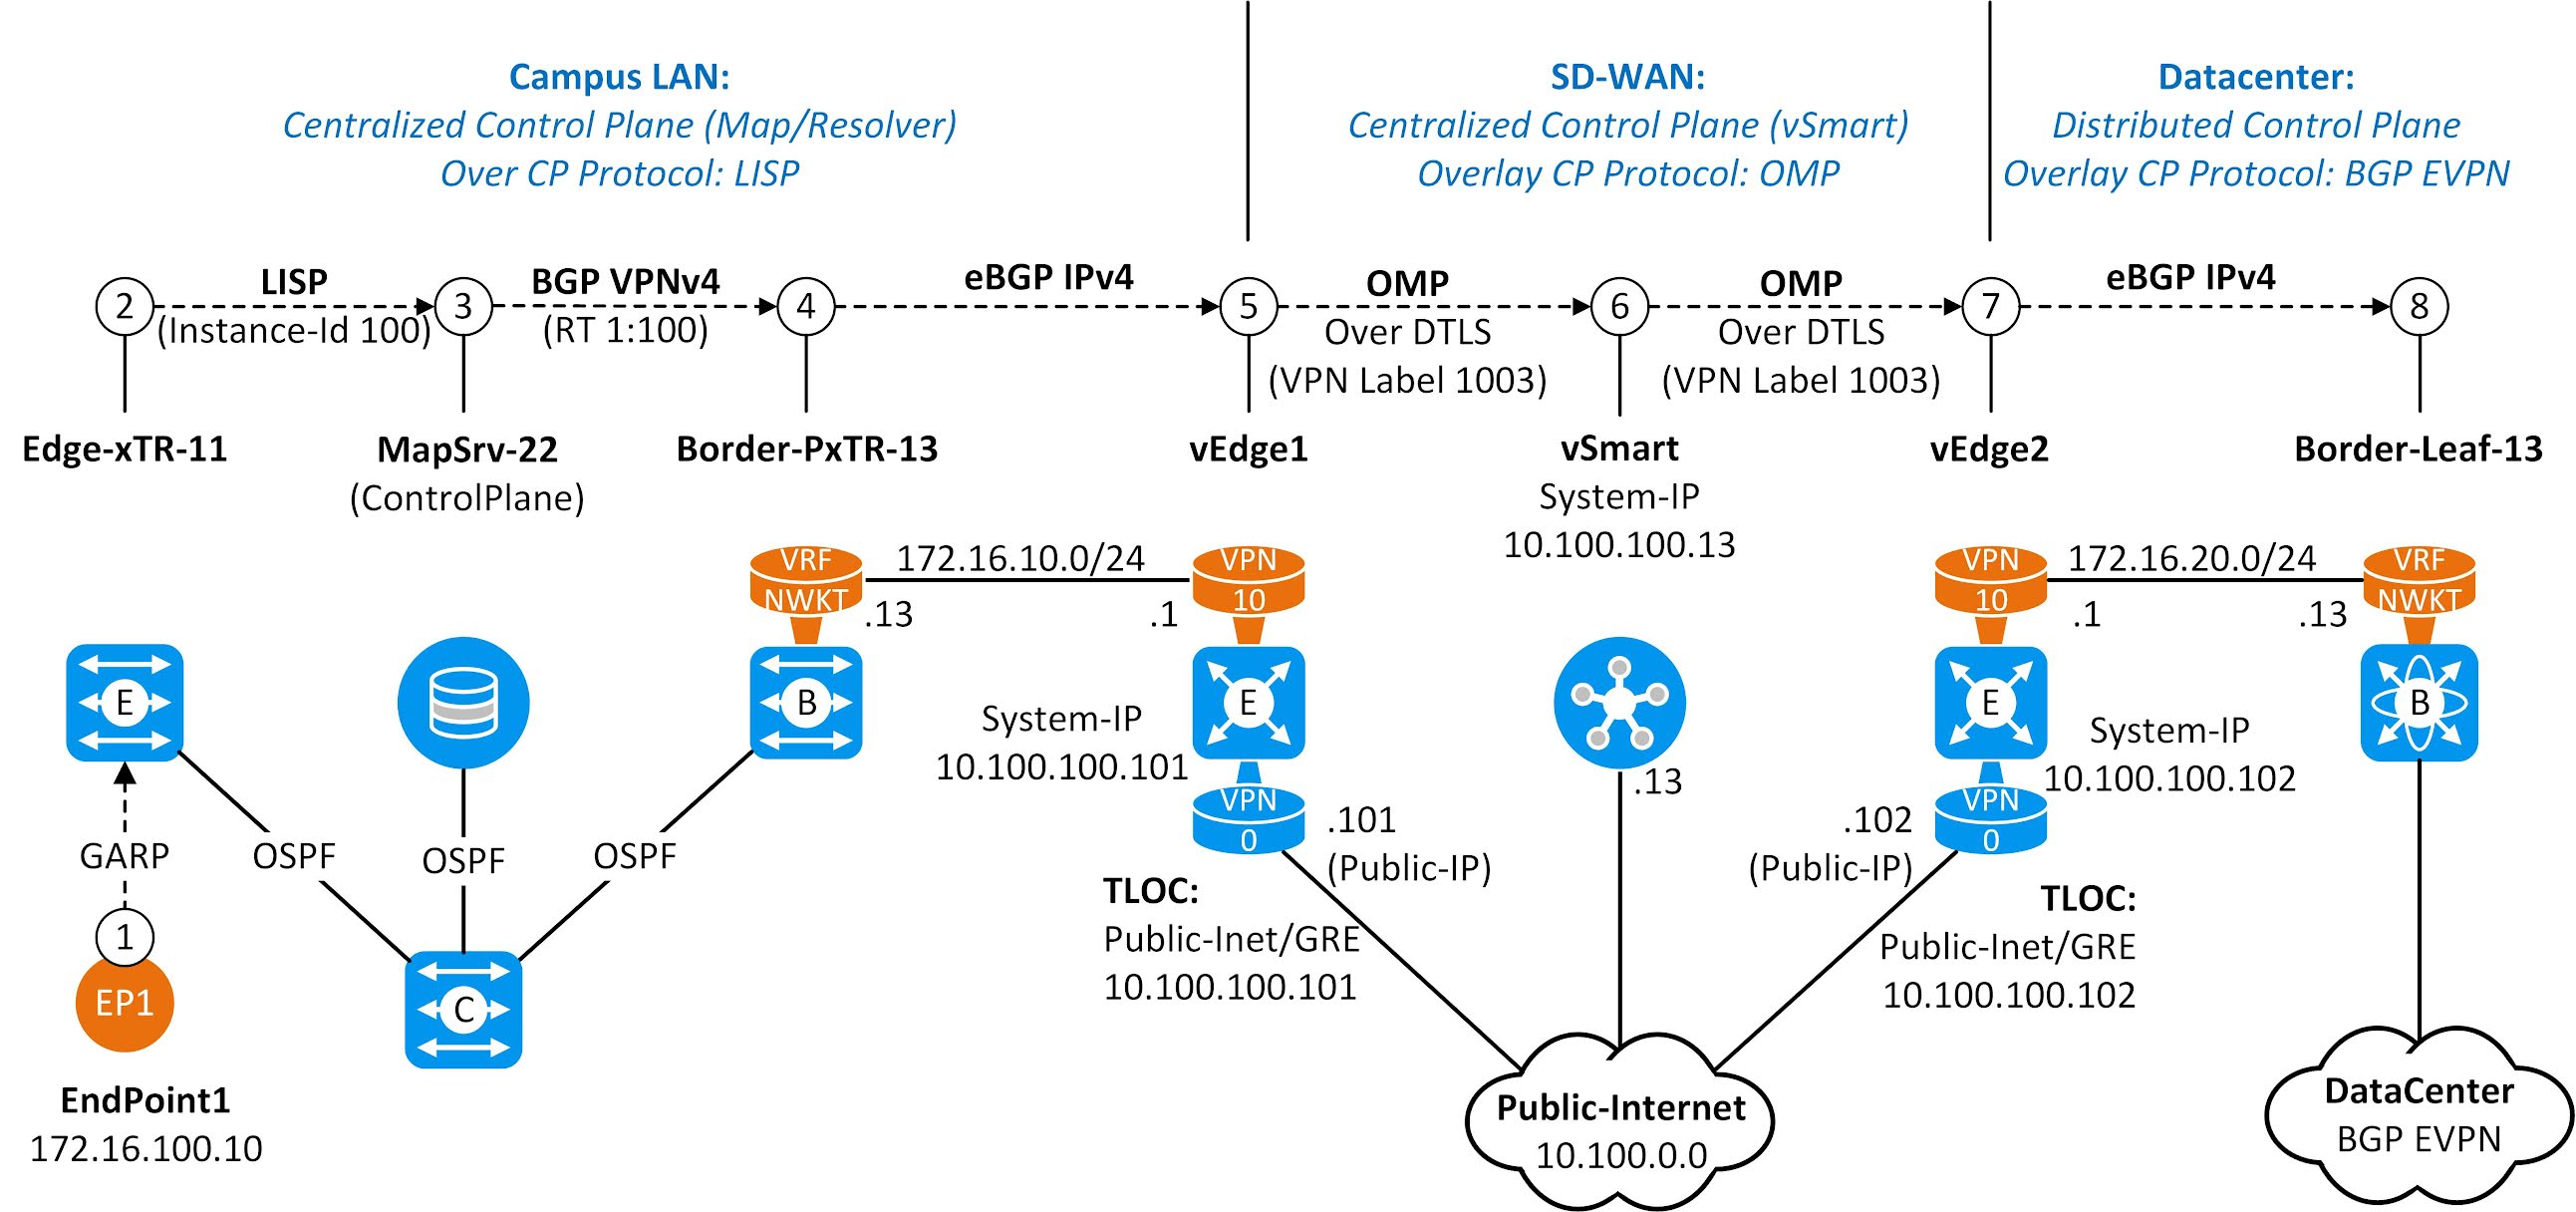
Figure 2-1 shows the Control Plane operation when host EP1 using IP 172.16.100.10/32 joins the network. In the previous chapter, we saw how Edge-xTR-11 learned the IP address and registered it to MapSrv-22 by using the LISP Map-register Message where the Instance-Id 100 represents Virtual Network-Id (VN-Id). MapSrv-22, in turn, advertised the NLRI to Border-PxTR-13 as BGP VPNv4 Update message where extended community RT 1:100 (=VN-Id) is used as a kind of VPN identifier (BGP VPNv4 route import/export policy is based on RT value). This chapter first explains how Border-PxTR-13 sends BGP IPv4 Update message to local SD-WAN device vEdge-1. The eBGP peering between Border-PxTR-13 and vEdge1 is VRF based and BGP updates over it don’t carry any VN-Id. vEdge-1 imports the routing information from BRIB to RIB. Then it advertises the routing information by using OMP (Overlay Management Protocol) to the SD-WAN centralized Control Plane vSmart over the DTLS tunnel using System-IP as an originator-Id and VPN label 1003 as a VN-Id. vSmart forwards this update to SD-WAN device vEdge-2 located in Datacenter. vEdge-2 installs the route into the routing table. After that, it exports the routing information from the RIB to the BGP process and sends the BGP IPv4 Update message to Border-Leaf-13 over VRF NWKT eBGP peering without VN-Id.
Cable giant Comcast has extended its mobile virtual network operator (MVNO) services for consumers to small and midsize businesses under the brand Comcast Business Mobile.Comcast already provides a consumer mobility service called Xfinity Mobile. Verizon and Comcast launched the Xfinity Mobile service in 2017. Like Xfinity Mobile, Comcast Business Mobile offers 4G and 5G coverage from Verizon’s mobile network as well as Wi-Fi hotspots to fill in coverage.The service offers Comcast Business Internet customers up to 10 lines with no line access fees. Customers are required to get broadband service from Comcast.There's an unlimited plan that supports graduated pricing, starting at $45 per month for one line, $30 per line per month for four lines, and $24 per line per month for 10 lines. Comcast describes the unlimited plan as ideal for on-the-go employees who may not be within Wi-Fi range and need cellular data.To read this article in full, please click here
Hashes in Crystal are a collection of key/value
pairs of defined types.
Creating a hash
# Deduce the type signature of a hash.
typeof(stuff_and_things) # => Hash(String, String)
# To create an empty hash, you must define
# the intended type of its key/value pairs.
# There are 2 ways to define...continue reading
Like most languages, variables in Crystal are
defined with the =
operator.
Considerations
Variable types are inferred by the compiler and do not have to be specifically defined.
When a variable type is declared, it must be assigned a value before it can be accessed.
There are no global...continue reading
Arrays in Crystal are an ordered collection of elements,
generally of the same type. Although, it is possible
to have an array of multiple types.
Creating an array
Iterating an Array
Accessing Elements
Array Operations
Static Arrays
If the size of an array is fixed it is much more...continue reading
First off, CBRS is an acronym for Citizens Broadband Radio Service, and the upshot for IT pros is that it’s enabling enterprises to build their own private 4G/5G networks and result in improved 4G/5G offerings from service providers. Here’s a primer on CBRS—because you are going to want to know about this.CB, as in CB radio?
No, good buddy, this has nothing to do with the Citizens’ Band radio service used by truckers for two-way voice communications and that lives in the 27MHz band in the US. CBRS lives in the 3.5GHz band.To read this article in full, please click here
IBM continues to fine-tune its mainframe to keep it attractive to enterprise users interested in keeping the Big Iron in their cloud and AI-application development plans.The company released a new version of the mainframe operating system—z/OS V2.5—that includes beefed-up support for containers, AI, and security.Chip shortage will hit hardware buyers for months to years
According to IBM, applications are at the heart of transactional and batch workloads running on z/OS. Fundamentally, developing new applications while modernizing existing applications is part of the digital transformation occurring in many enterprises.To read this article in full, please click here