Author Archives: Peter
Author Archives: Peter
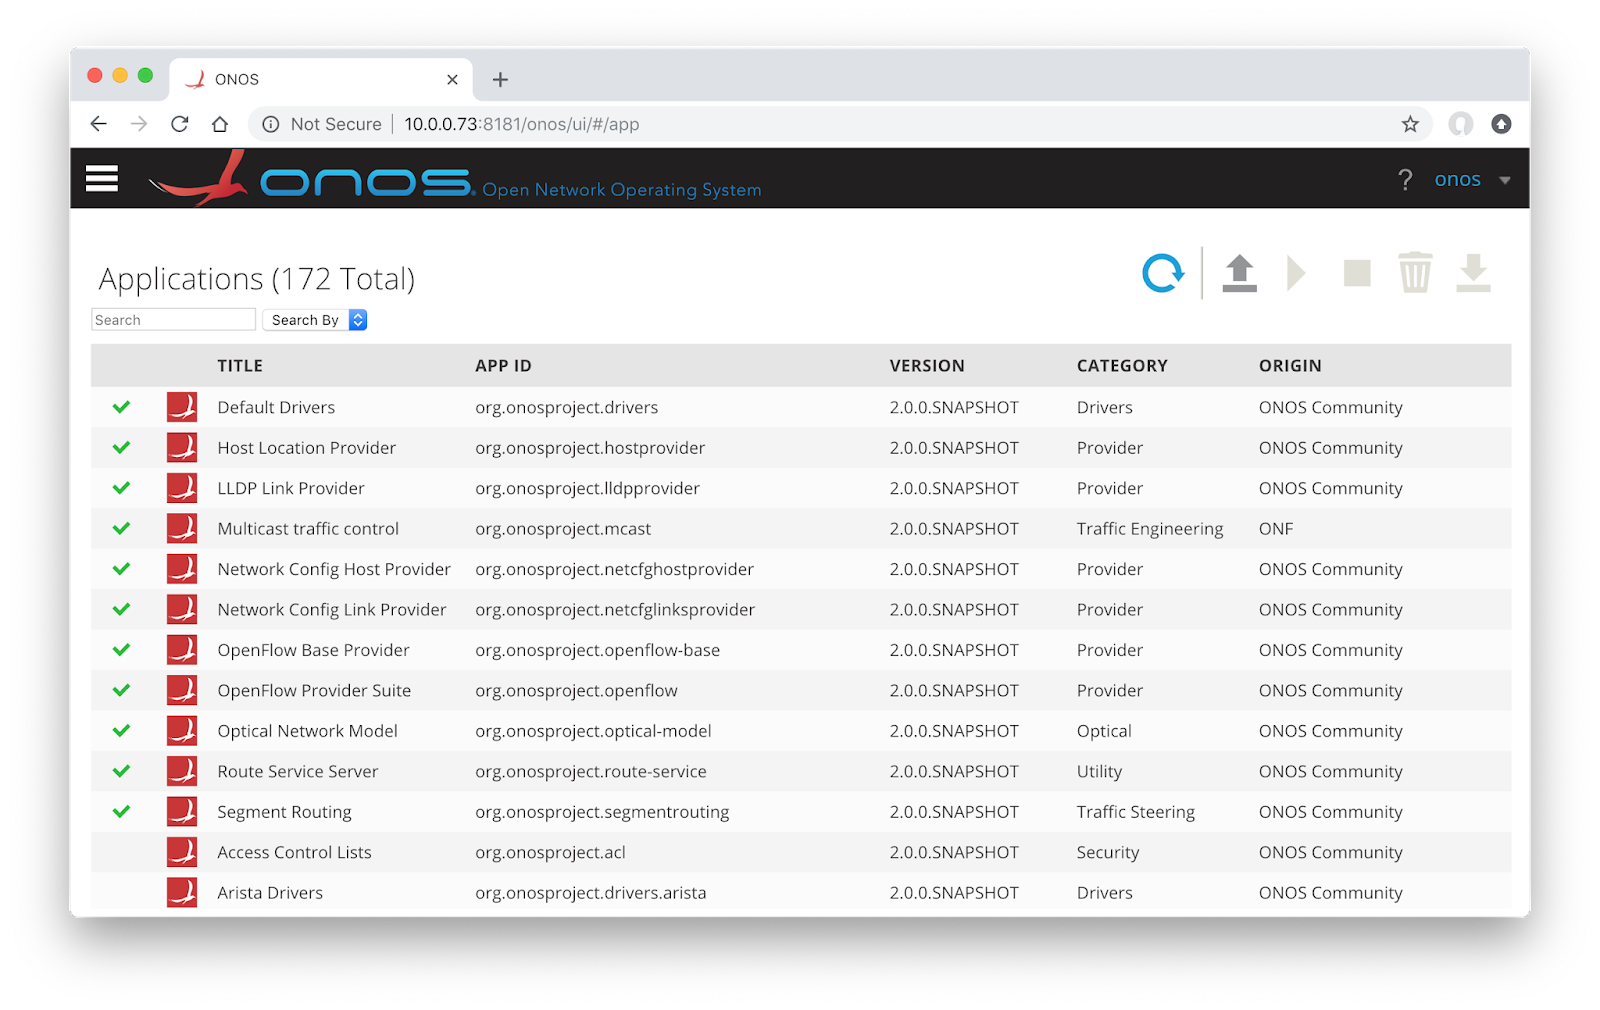
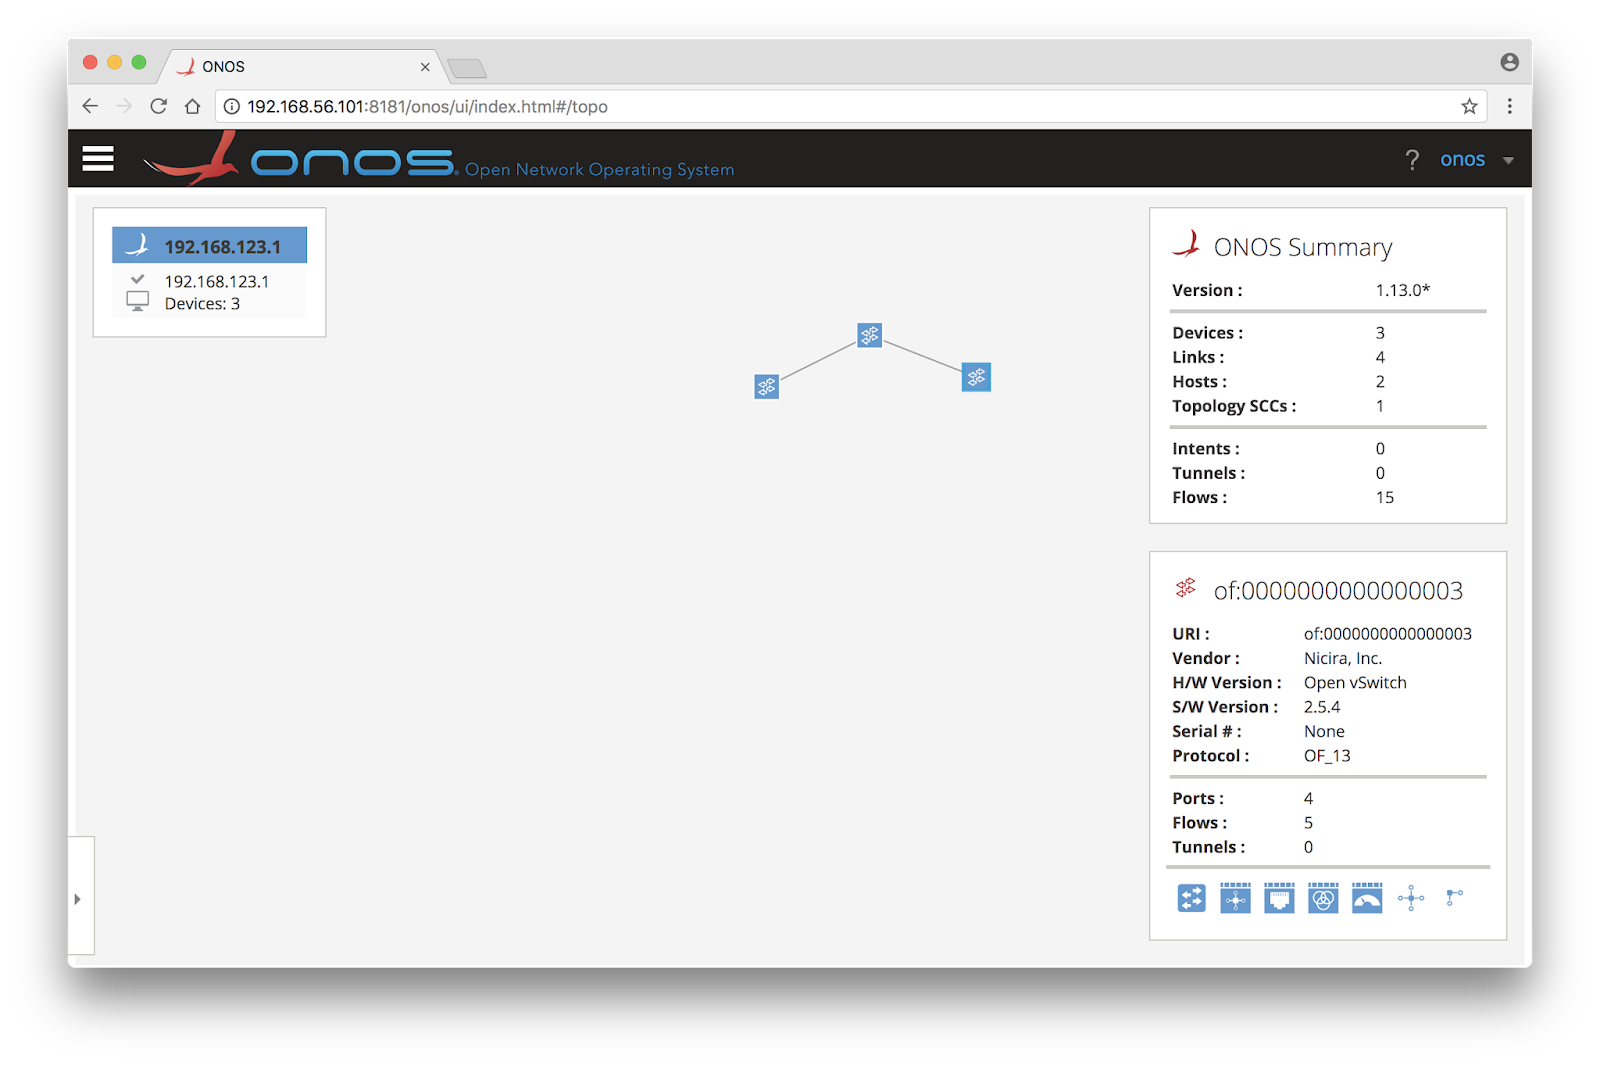
docker run --name onos --rm -p 6653:6653 -p 8181:8181 -d onosproject/onosUse the graphical interface, http://onos:8181, to enable the OpenFlow Provider Suite, Network Config Host Provider, Network Config Link Provider, and Segment Routing applications. The screen shot above shows the resulting set of enabled services.
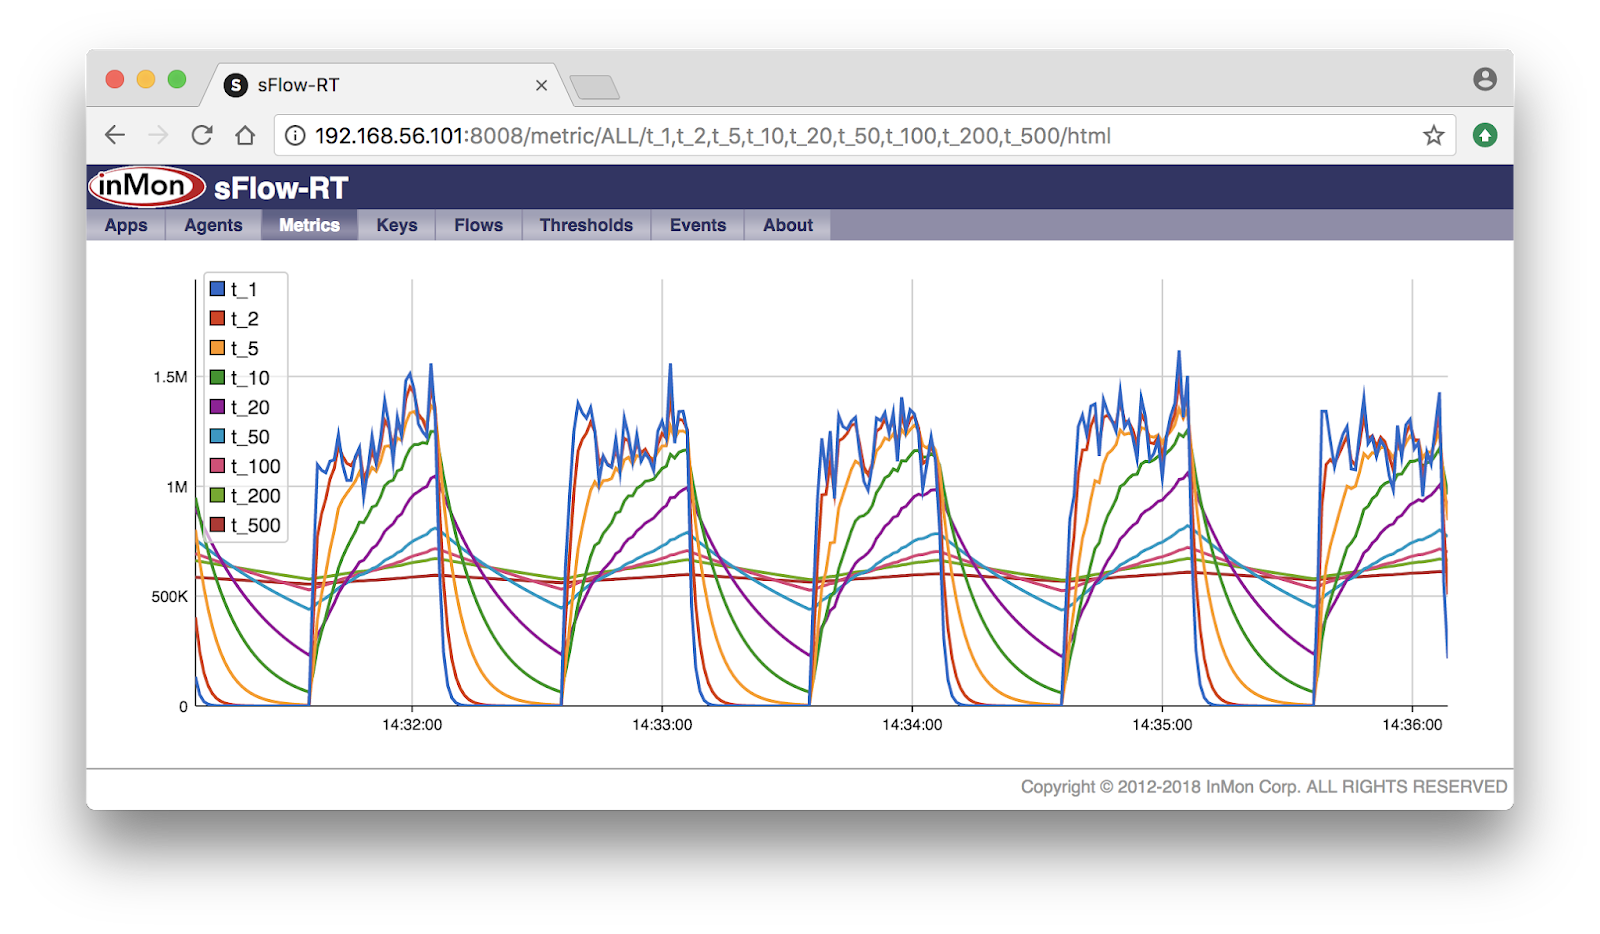
wget https://inmon.com/products/sFlow-RT/sflow-rt.tar.gzStart sFlow-RT:
tar -xvzf sflow-rt.tar.gz
./sflow-rt/get-app.sh sflow-rt mininet-dashboard
./sflow-rt/start.shDownload the sr.py script:
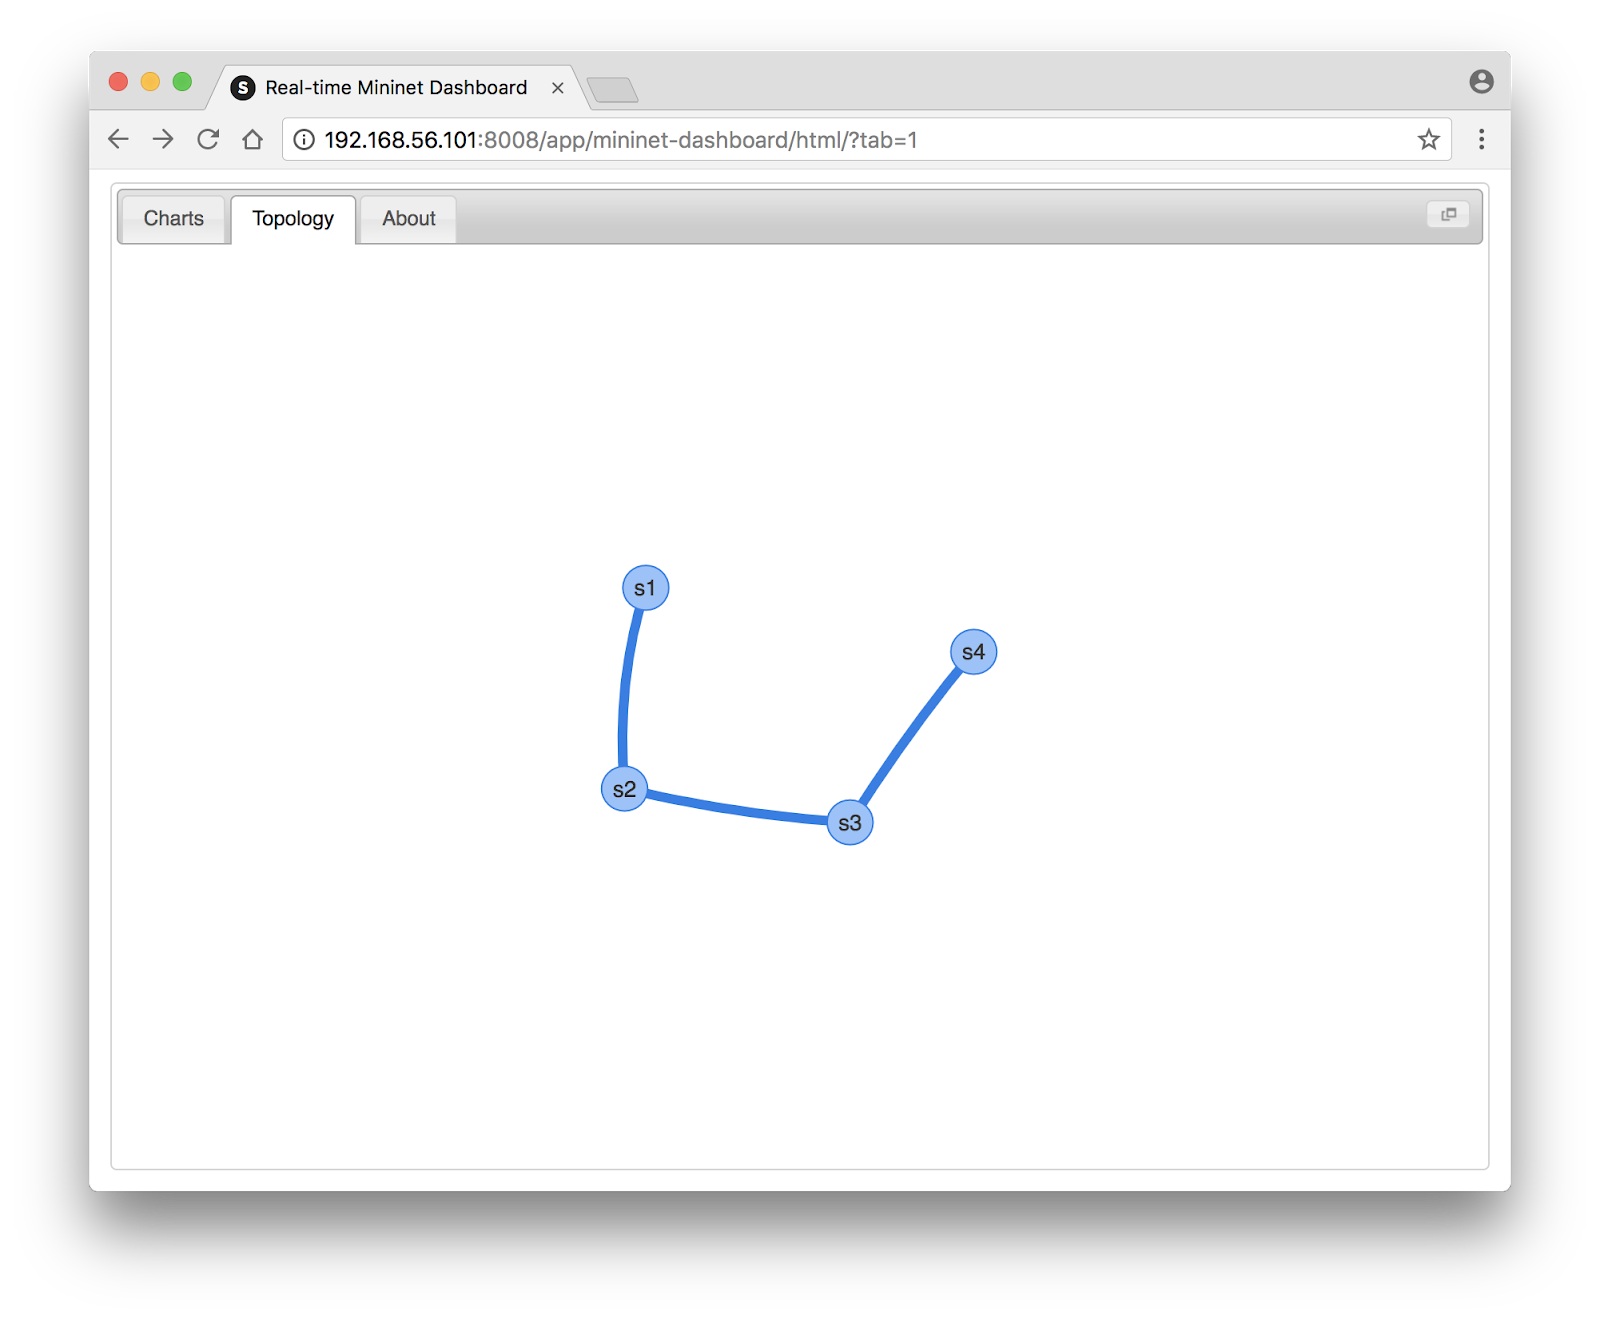
wget https://raw.githubusercontent.com/sflow-rt/onos-sr/master/sr.pyStart Mininet:
sudo env ONOS=10.0.0.73 mn --custom sr.py,sflow-rt/extras/sflow.py \
--link  Continue reading

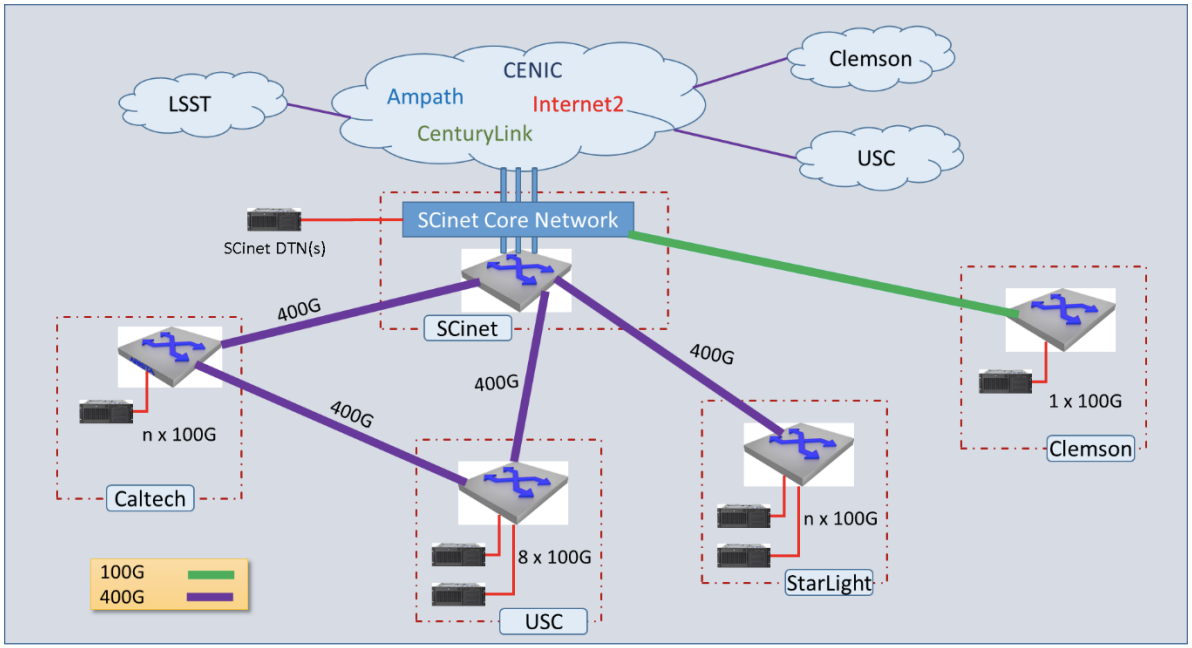 |
| NRE-36 University of Southern California network topology for SuperComputing 2018 |

ryu-manager $RYU_APP/simple_switch_13.py,$RYU_APP/ofctl_rest.pyNote: The simple_switch_13.py and ofctl_rest.py scripts are part of a standard Ryu installation. The $RYU_APP variable has been set to point to the Ryu app directory.

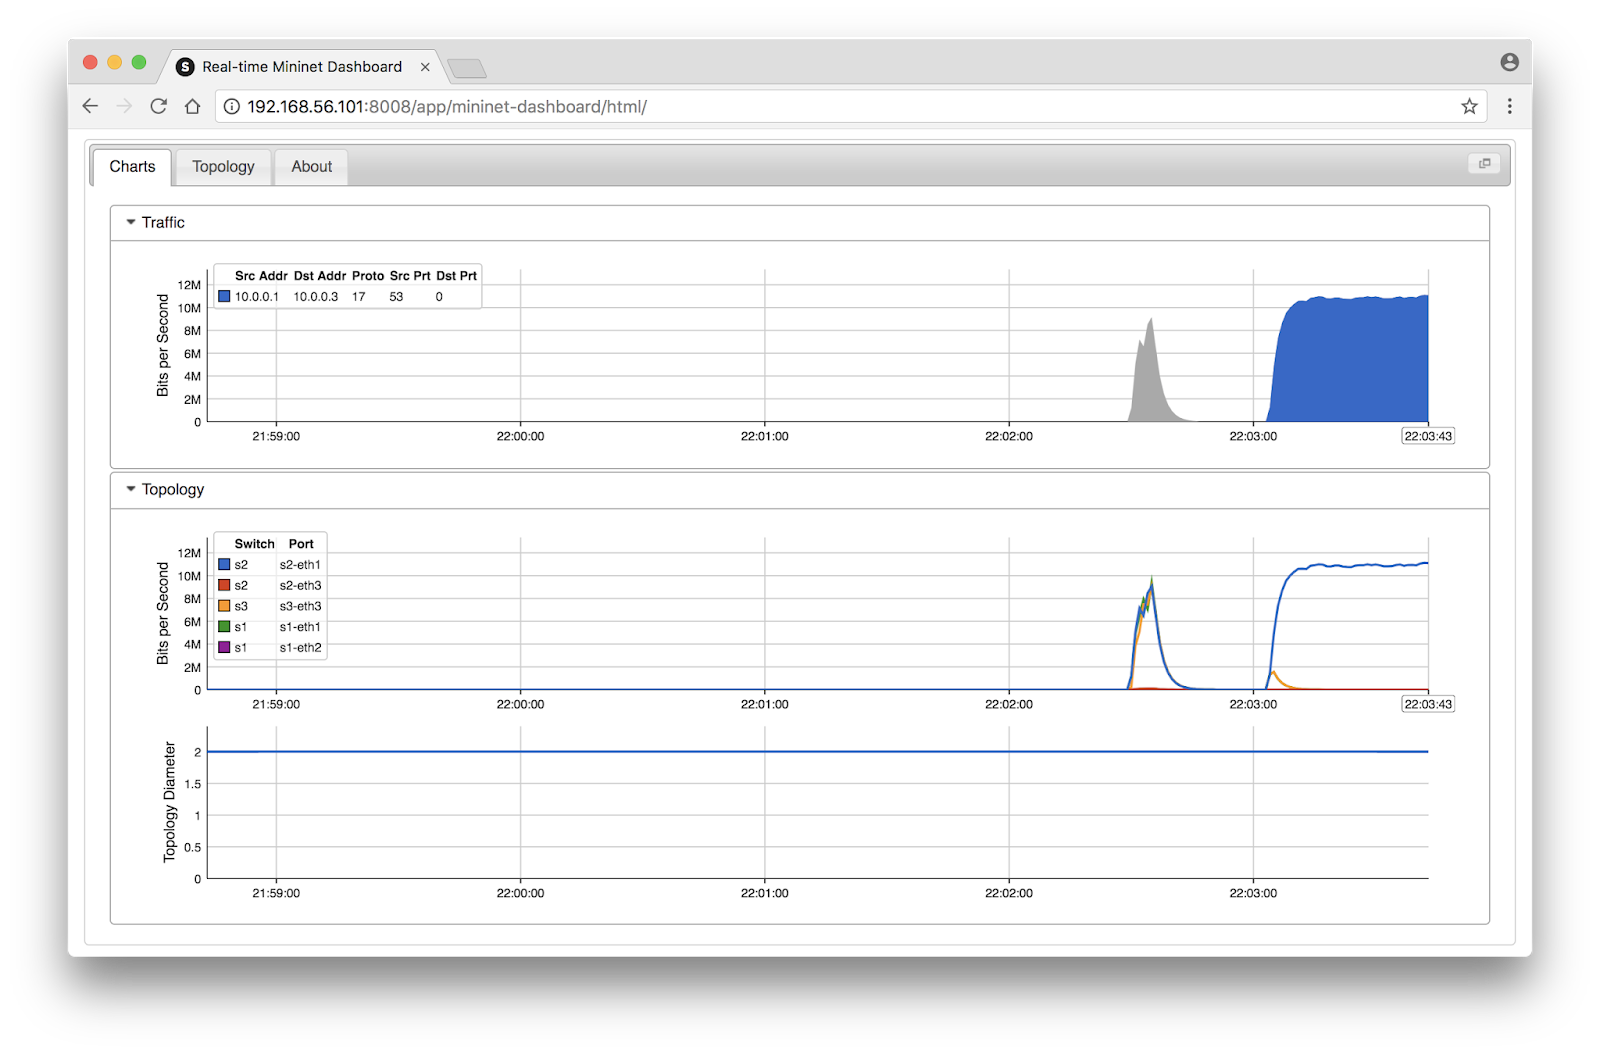
wget https://inmon.com/products/sFlow-RT/sflow-rt.tar.gzInstall the Mininet Dashboard application:
tar -xvzf sflow-rt.tar.gz
sflow-rt/get-app.sh sflow-rt mininet-dashboardThe following script, ryu.js, implements the DDoS mitigation function described in the previous article:
var ryu = '127.0.0.1';
var controls = {};

setFlow('udp_reflection',
 {keys:'ipdestination,udpsourceport',value:'frames'});
setThreshold('udp_reflection_attack',
 {metric:'udp_reflection',value:100,byFlow:true,timeout:2});

setEventHandler(function(evt) {
 // don't consider inter-switch links
 var link = topologyInterfaceToLink(evt.agent,evt.dataSource);
 if(link) return;

 // get port information
 var port = topologyInterfaceToPort(evt.agent,evt.dataSource);
 if(! Continue reading
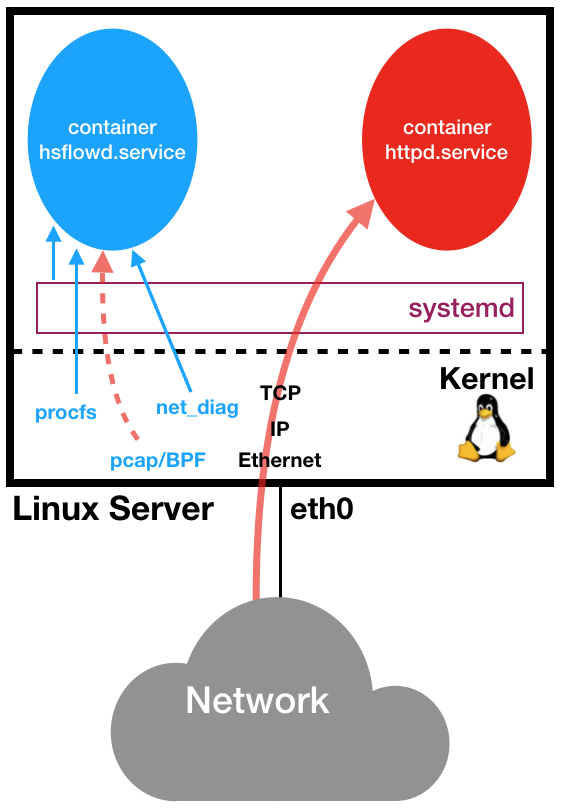
sflow {
  collector { ip = 10.0.0.70 }
  pcap { dev = eth0 }
  systemd { markTraffic = on }
  tcp { }
}
The diagram above illustrates how the Host sFlow agent is able to efficiently monitor and classify traffic. In this case both the Host sFlow agent and an Apache web server are are running as services managed by systemd. A network connection , shown in Continue reading
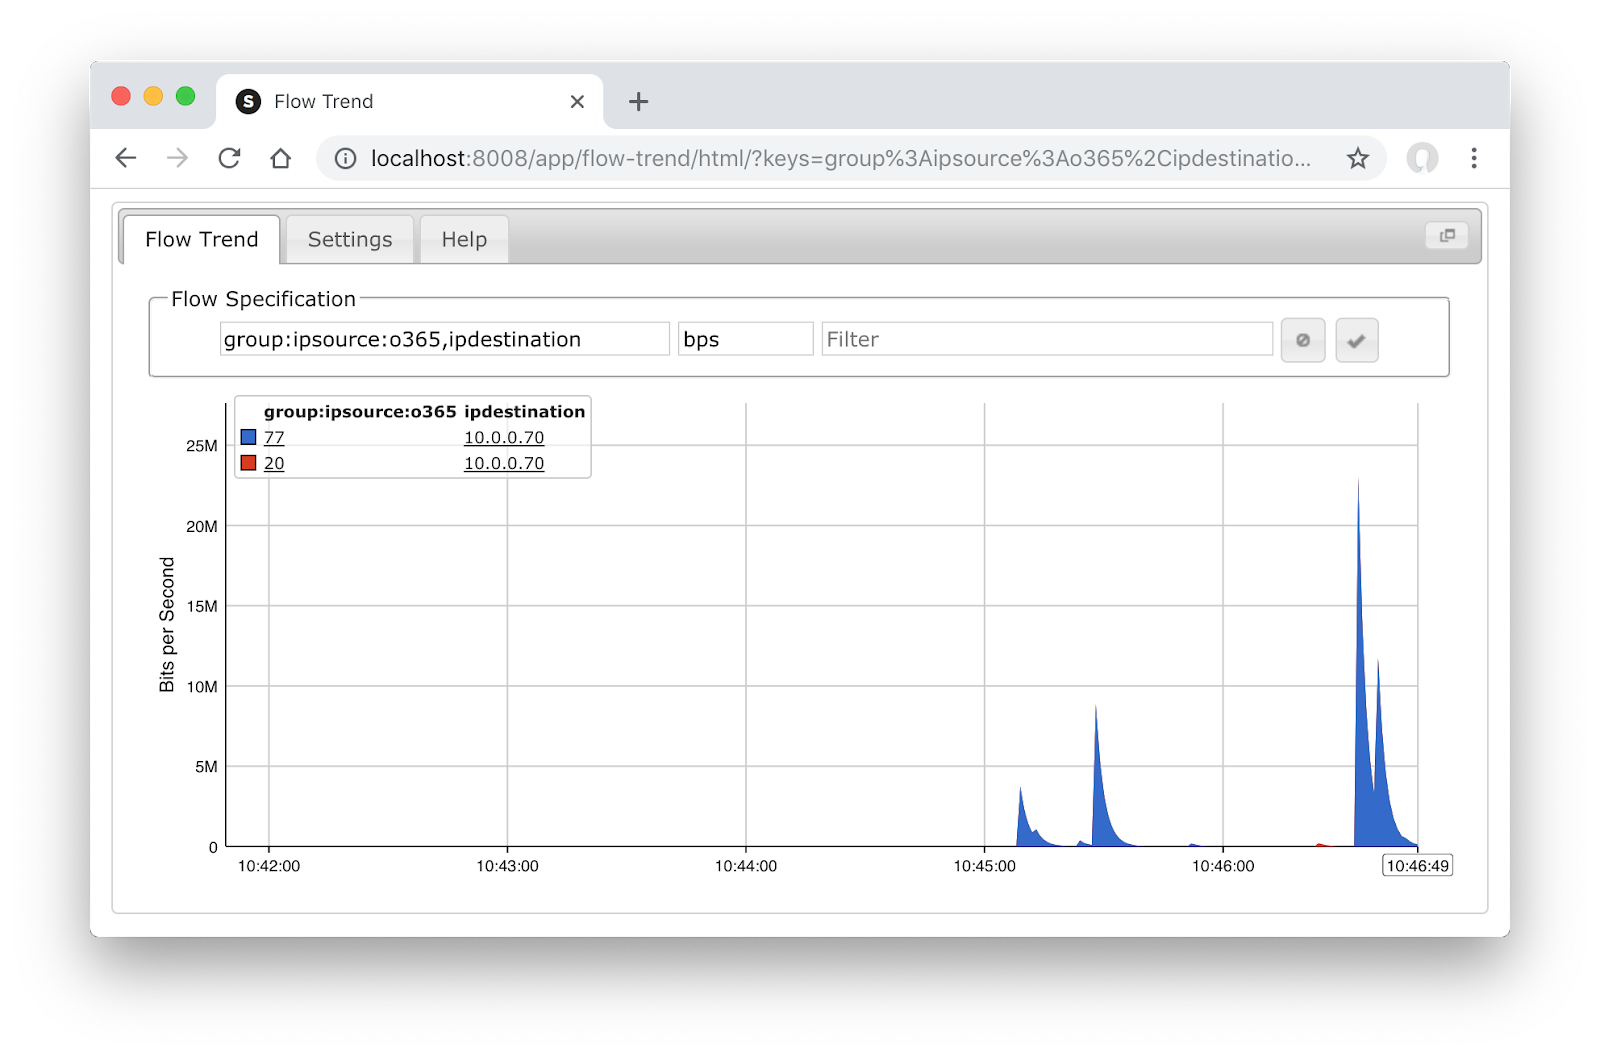
var api = 'https://endpoints.office.com/endpoints/worldwide';

function uuidv4() {
  return 'xxxxxxxx-xxxx-4xxx-yxxx-xxxxxxxxxxxx'.replace(/[xy]/g, function(c) {
    var r = Math.random() * 16 | 0, v = c == 'x' ? r : (r & 0x3 | 0x8);
    return v.toString(16);
  });
}

var reqid = uuidv4();

function updateAddressMap() {
  var res, i, ips, id, groups;
  try { res = http(api+'?clientrequestid='+reqid); }
  catch(e) { logWarning('request failed ' + e); }
  if(res == null) return;
  res = JSON.parse(res);
  groups  Continue reading


ovs-vsctl -- --id=@sflow create sflow agent=$OVS_BR target=$IP_CONTROLLER_1 sampling=100 polling=10 -- set bridge $OVS_BR sflow=@sflowReboot the switch for the changed to take effect.


bcm_asic_host_entries 4
bcm_host_entries_max 8192
bcm_ipv4_entries 0
bcm_ipv4_entries_max 0
bcm_ipv6_entries 0
bcm_ipv6_entries_max 0
bcm_ipv4_ipv6_entries 9
bcm_ipv4_ipv6_entries_max 16284
bcm_long_ipv6_entries 3
bcm_long_ipv6_entries_max 256
bcm_total_routes 10
bcm_total_routes_max 32768
bcm_ecmp_nexthops 0
bcm_ecmp_nexthops_max 2016
bcm_mac_entries 3
bcm_mac_entries_max 32768
bcm_ipv4_neighbors 4
bcm_ipv6_neighbors 0
bcm_ipv4_routes 0
bcm_ipv6_routes 0
bcm_acl_ingress_entries  Continue reading


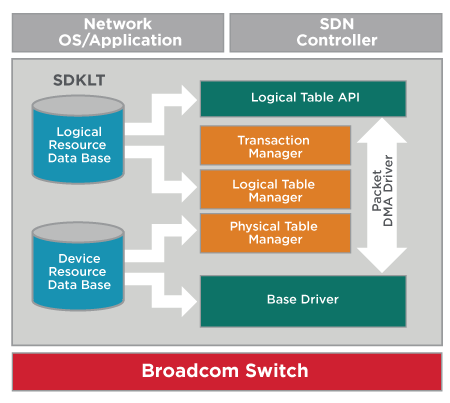
BCMLT.0> lt list -d MIRROR_PORT_ENCAP_SFLOW
MIRROR_PORT_ENCAP_SFLOW
  Description: The MIRROR_PORT_ENCAP_SFLOW logical table is used to specify
               per-port sFlow encapsulation sample configuration.
  11 fields (1 key-type field):
    SAMPLE_ING_FLEX_RATE
        Description: Sample ingress flex sFlow packet if the generated sFlow random
                     number is greater than the threshold. A lower threshold leads to
                     higher sampling frequency.
    SAMPLE_EGR_RATE
        Description: Sample egress sFlow packet if the generated sFlow random number is
                     greater than the threshold. A lower threshold leads to
                     higher sampling frequency.
    SAMPLE_ING_RATE
        Description: Sample ingress sFlow packet if the generated sFlow random number is
                     greater than the threshold. A lower threshold leads to
                     higher sampling frequency.
    SAMPLE_ING_FLEX_MIRROR_INSTANCE
        Description: Enable to copy ingress flex sFlow packet samples to the ingress
                     mirror member using the sFlow mirror instance configuration.
    SAMPLE_ING_FLEX_CPU
        Description: Enable to copy ingress flex  Continue reading

var user = 'onos';
var password = 'rocks';
var onos = '192.168.123.1';
var controls = {};

setFlow('udp_reflection',
 {keys:'ipdestination,udpsourceport',value:'frames'});
setThreshold('udp_reflection_attack',
 {metric:'udp_reflection',value:100,byFlow:true,timeout:2});

setEventHandler(function(evt) {
 // don't consider inter-switch links
 var link = topologyInterfaceToLink(evt.agent,evt.dataSource);
 if(link) return;

 // get port information
 var port = topologyInterfaceToPort(evt.agent,evt.dataSource);
 if(!port) return;

 // need OpenFlow info to create ONOS filtering rule
 if(!port.dpid || !port.ofport) return;

 // we already have  Continue reading
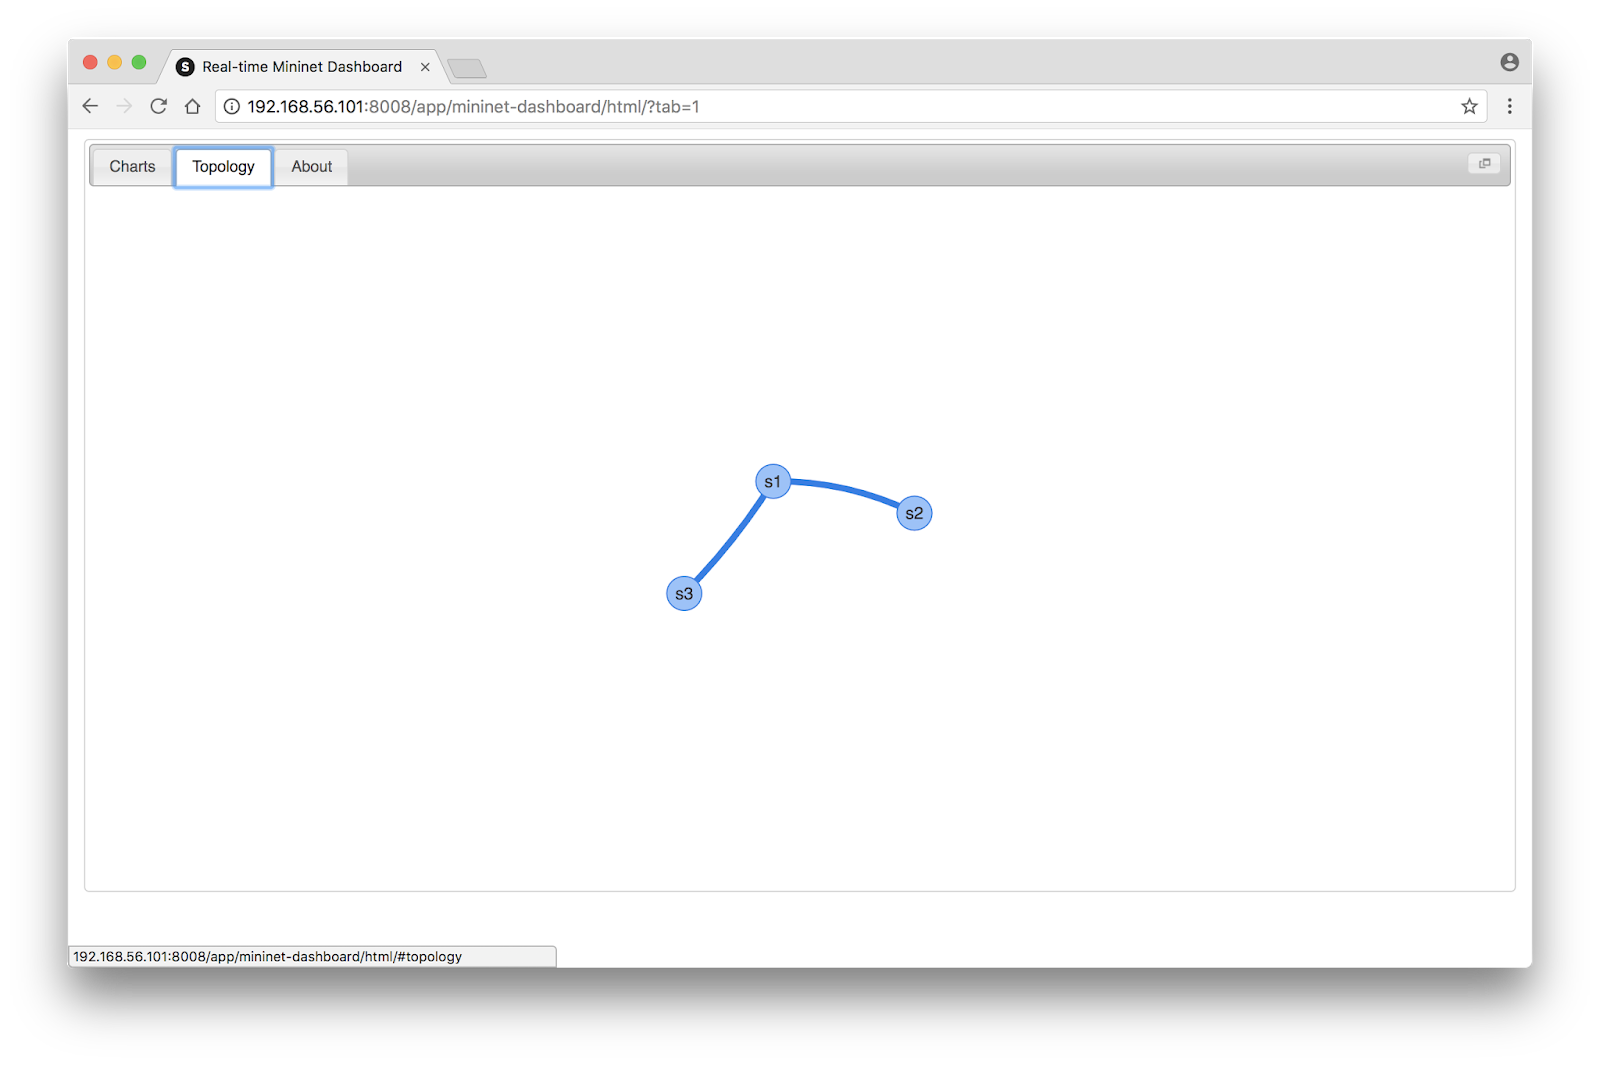
sudo mn --custom ~/onos/tools/dev/mininet/onos.py,sflow-rt/extras/sflow.py \The screen capture above shows the network topology in the ONOS web user interface.
--link tc,bw=10 --controller onos,1 --topo tree,2,2
mininet-onos> iperf h1 h3
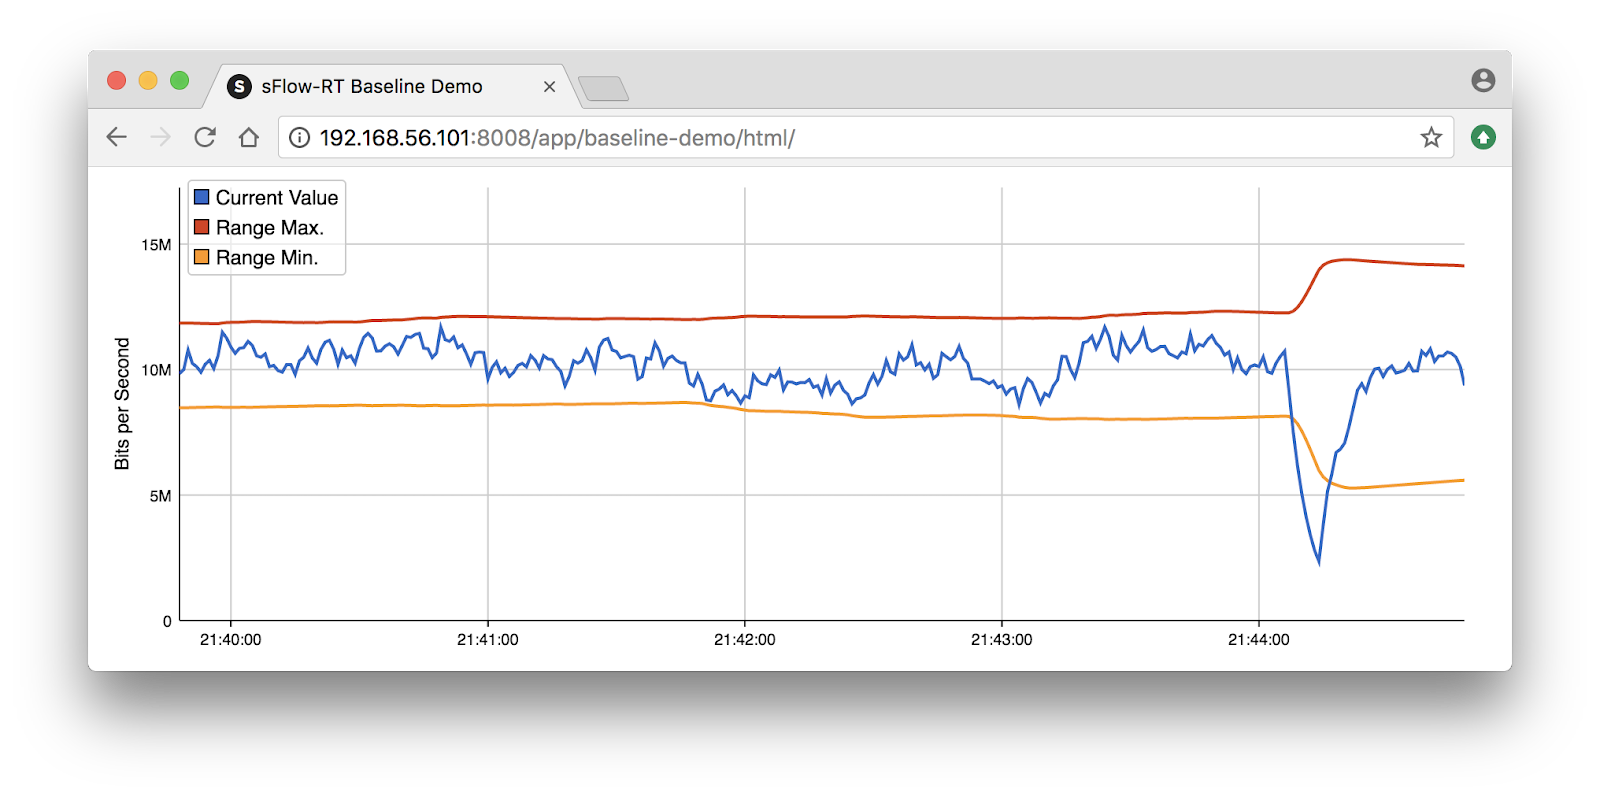
baselineCreate(name,window,sensitivity,repeat);Where:
var status = baselineCheck(name,value);Where:

sudo mn --custom=sflow-rt/extras/sflow.py --link tc,bw=10 \
--topo torus,3,3 --switch ovsbr,stp=1 --test iperf

sudo mn --custom sflow-rt/extras/sflow.py --link tc,bw=10 \
--topo tree,depth=4,fanout=2 --test iperf
sudo mn --custom sflow-rt/extras/sflow.py --link tc,bw=10 \It's also easy to create Custom Topologies. The following command creates the example custom topology, topo-2sw-2host.py, that ships with Mininet:
--topo linear,4 --test iperf
sudo mn --custom ~/mininet/custom/topo-2sw-2host.py,sflow-rt/extras/sflow.py Continue reading


<?php
header('Content-Type: text/plain');
if(isset($_GET['labels'])) {
  $keys = htmlspecialchars($_GET["labels"]);
}
$vals = htmlspecialchars($_GET["values"]);
if(isset($keys)) {
  $cols = $keys.','.$vals;
} else {
  $cols = $vals;
}
$key_arr = explode(",",$keys);
$result = file_get_contents('http://localhost:8008/table/ALL/'.$cols.'/json');
$obj = json_decode($result,true);
foreach ($obj as $row) {
  unset($labels);
  foreach ($row as $cell) {
    if(!isset($labels)) {
      $labels = 'agent="'.$cell['agent'].'",datasource="'.$cell['dataSource'].'"';
    }
    $name = $cell['metricName'];
    $val = $cell['metricValue'];
    if(in_array($name,$key_arr)) {
      $labels .=  Continue reading

wget --no-check-certificate https://github.com/sflow/host-sflow/releases/download/v2.0.17-1/hsflowd-opx_2.0.17-1_amd64.debThe sFlow agent requires very little configuration, automatically monitoring all switch ports using the following default settings:
sudo dpkg -i hsflowd-opx_2.0.17-1_amd64.deb
| Link Speed | Sampling Rate | Polling Continue reading |
|---|