Author Archives: Peter
Author Archives: Peter
wget https://github.com/sflow/host-sflow/releases/download/v2.0.26-3/hsflowd-centos8-2.0.26-3.x86_64.rpmThe above commands download and install the software.
sudo rpm -i hsflowd-centos8-2.0.26-3.x86_64.rpm
sudo systemctl enable hsflowd
sflow {
  collector { ip=10.0.0.30 }
  pcap { speed=1G-1T }
  tcp { }
  systemd { }
}
Edit the /etc/hsflowd.conf file. The above example sends sFlow to a collector at 10.0.0.30, enables packet sampling on all network adapters, adds TCP performance information, and exports metrics for Linux services. See Configuring Host sFlow for Linux for the complete set of configuration options.sudo systemctl restart hsflowdRestart the Host sFlow daemon to Continue reading

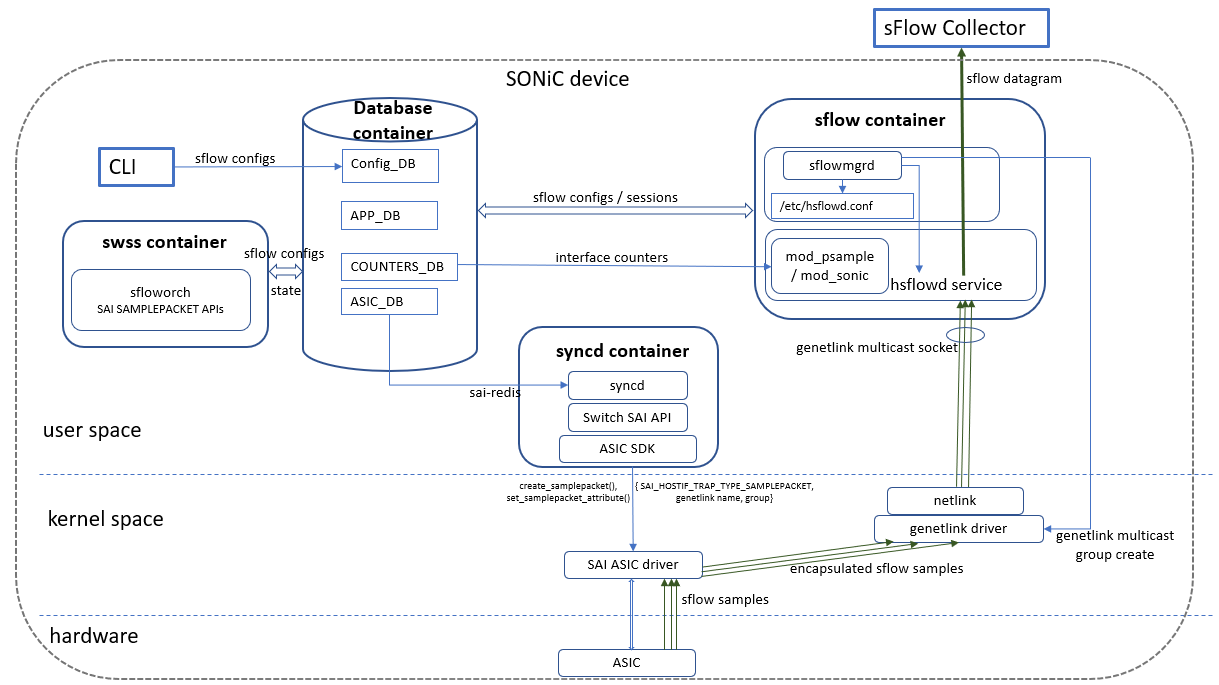 |
| SONiC: sFlow High Level Design |


400GE First Data Networks: Caltech, Starlight/NRL, USC, SCinet/XNET, Ciena, Mellanox, Arista, Dell, 2CRSI, Echostreams, DDN and Pavilion Data, as well as other supporting optical, switch and server vendor partners will demonstrate the first fully functional 3 X400GE local ring network as well as 400GE wide area network ring, linking the Starlight and Caltech booths and Starlight in Chicago. This network will integrate storage using NVMe over Fabric, the latest high throughput methods, in-depth monitoring and realtime flow steering. As part of these demonstrations, we will make use of the latest DWDM, Waveserver Ai, and 400GE as Continue reading


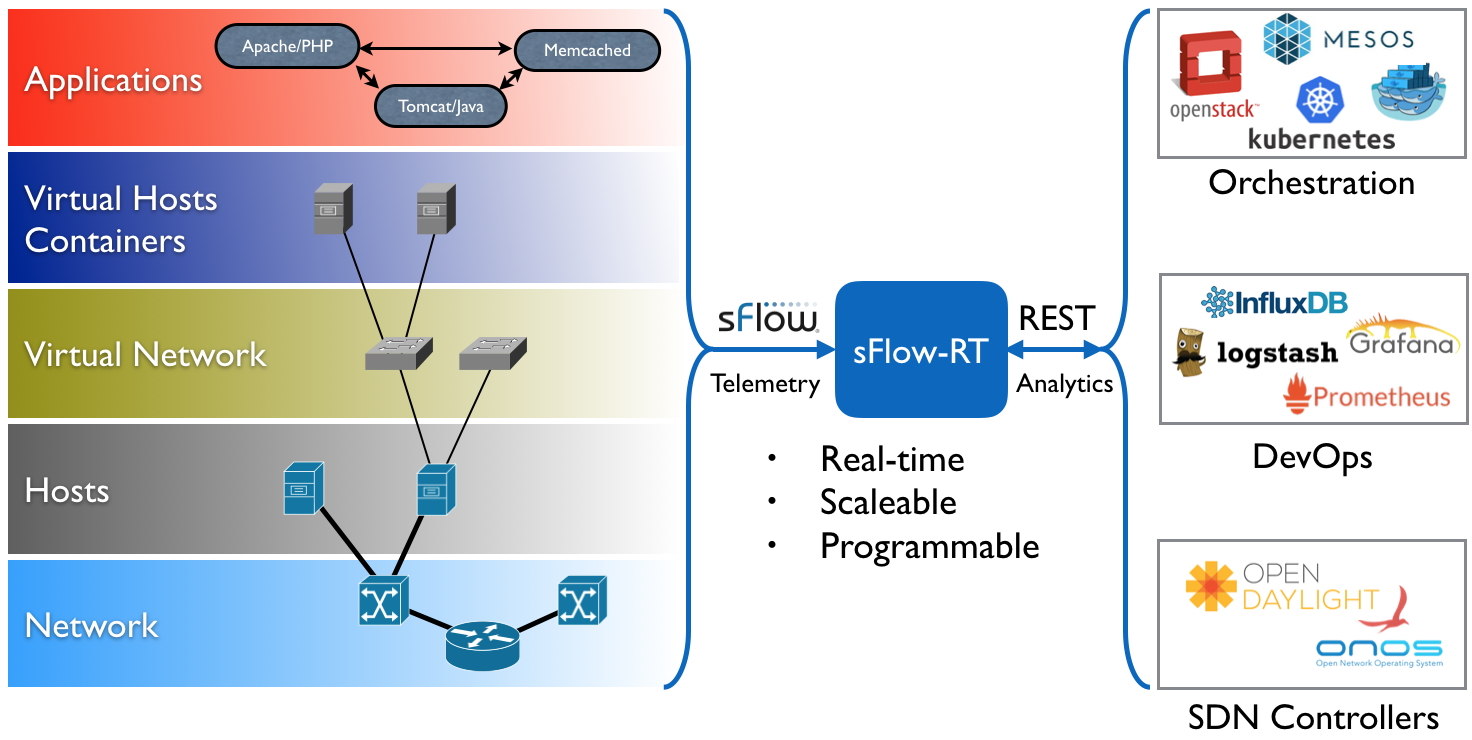
Observability in Data Center Networks: In this session, you’ll learn how the sFlow protocol provides broad visibility in modern data center environments as they migrate to highly meshed topologies. Our data center workloads are shifting to take advantage of higher speeds and bandwidth, so visibility to east-west traffic within the data center is becoming more important. Join Peter Phaal—one of the inventors of sFlow—and Joe Reves from SolarWinds product management as they discuss how sFlow differs from other flow instrumentation to deliver visibility in the switching fabric.THWACKcamp is SolarWinds’ free, annual, worldwide virtual IT learning event connecting thousands of skilled IT professionals with industry experts and SolarWinds technical staff. This video was one of the sessions.
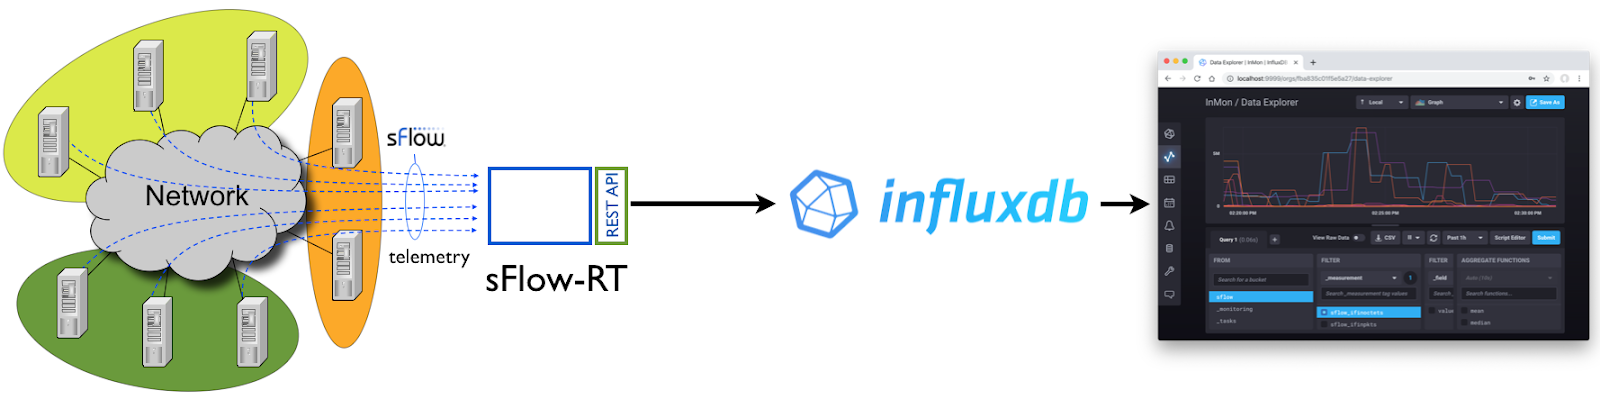
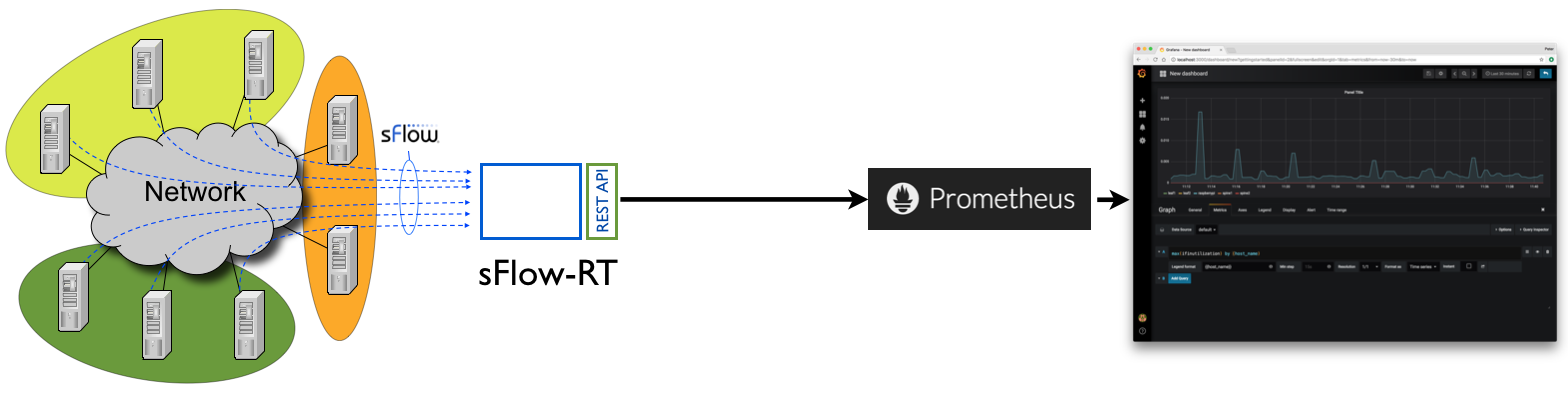
docker run --name influxdb -p 9999:9999 quay.io/influxdb/influxdb:2.0.0-alphaPrometheus exporter describes an application that runs on the sFlow-RT analytics platform that converts real-time streaming telemetry from industry standard sFlow agents. Host, Docker, Swarm and Kubernetes monitoring describes how to deploy agents on popular container orchestration platforms.
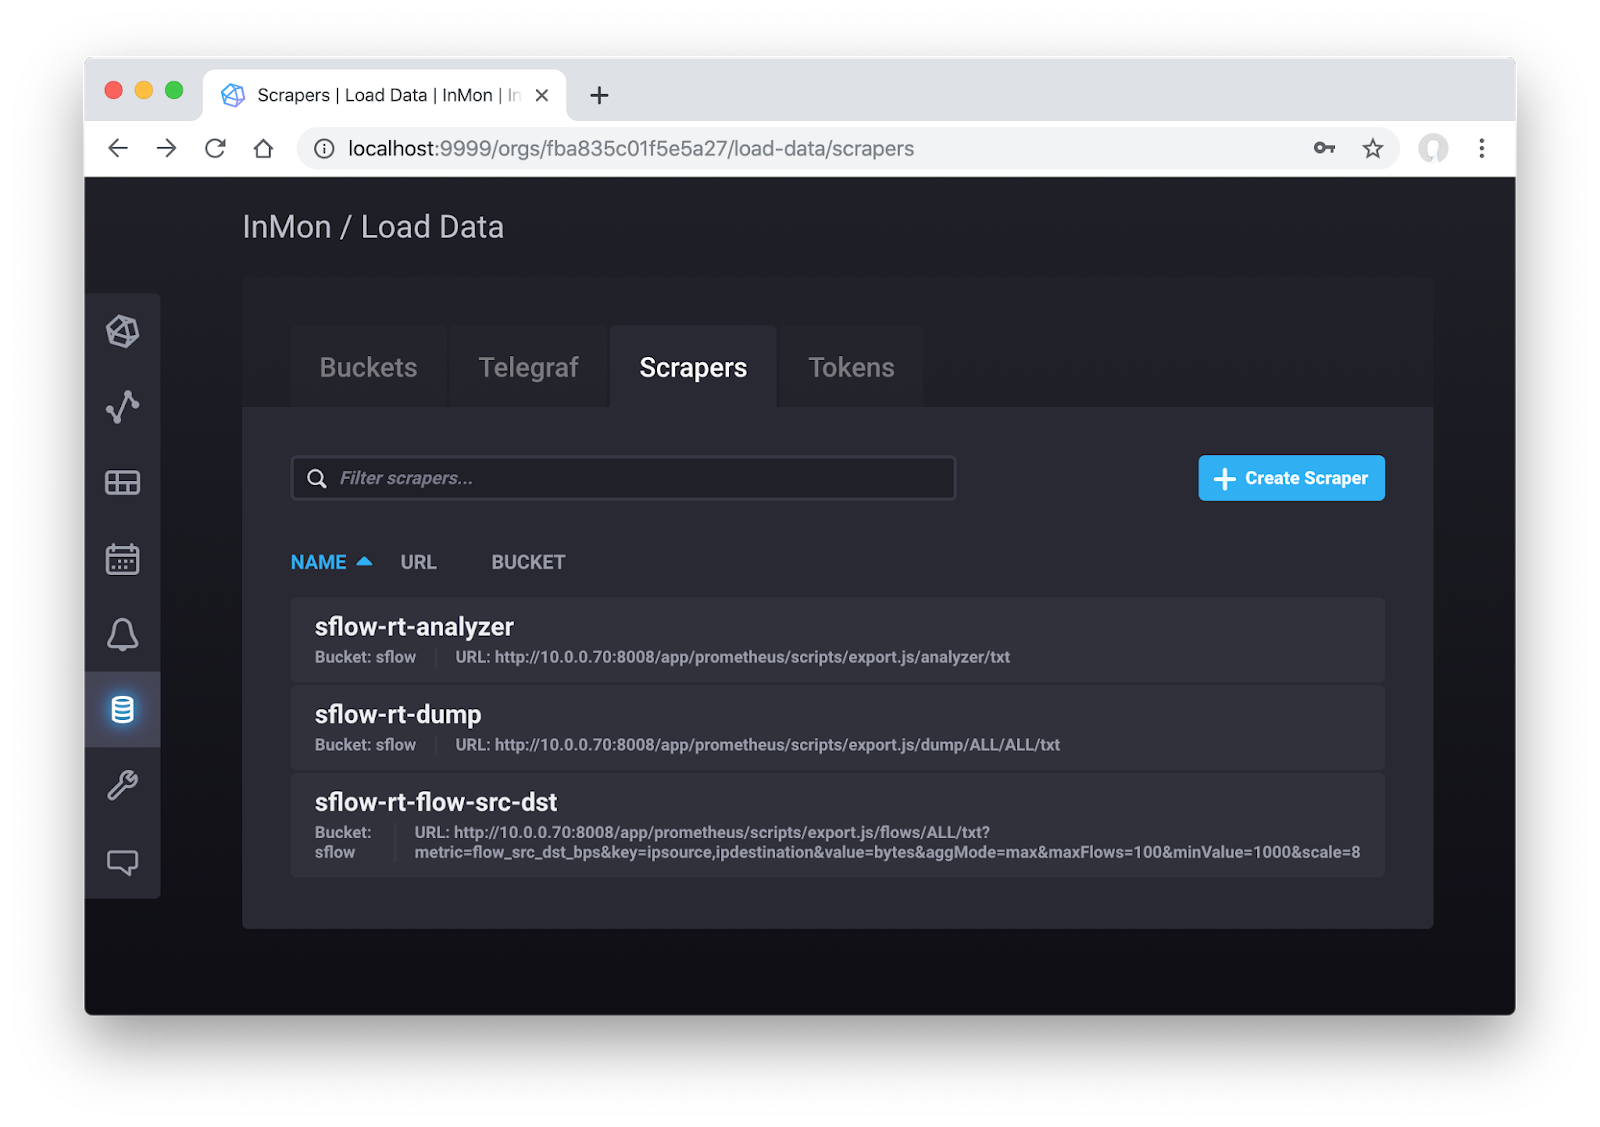

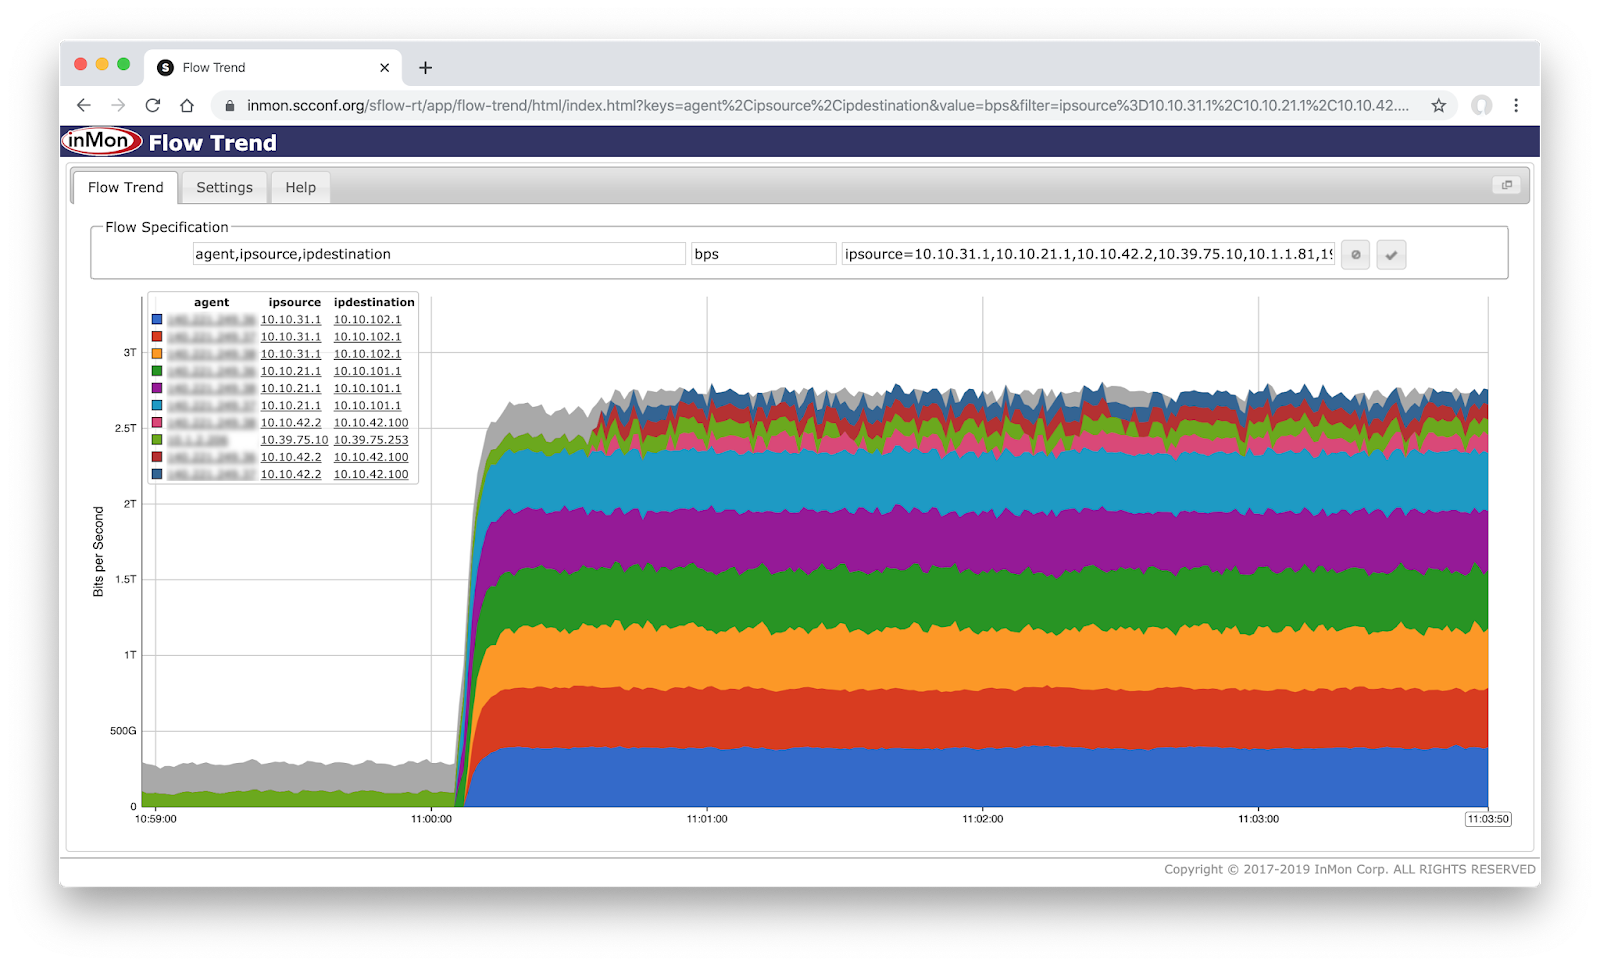
global:The above prometheus.yml file extends the previous example to add two additional scrape jobs, sflow-rt-src-dst-bps and sflow-rt-countries-bps, that return flow metrics. Defining flows describes the attributes and settings available to build Continue reading
scrape_interval: 15s
evaluation_interval: 15s
rule_files:
# - "first.rules"
# - "second.rules"
scrape_configs:
- job_name: 'sflow-rt-metrics'
metrics_path: /prometheus/metrics/ALL/ALL/txt
static_configs:
- targets: ['10.0.0.70:8008']
- job_name: 'sflow-rt-src-dst-bps'
metrics_path: /app/prometheus/scripts/export.js/flows/ALL/txt
static_configs:
- targets: ['10.0.0.70:8008']
params:
metric: ['ip_src_dst_bps']
key: ['ipsource','ipdestination']
label: ['src','dst']
value: ['bytes']
scale: ['8']
minValue: ['1000']
maxFlows: ['100']
- job_name: 'sflow-rt-countries-bps'
metrics_path: /app/prometheus/scripts/export.js/flows/ALL/txt
static_configs:
- targets: ['10.0.0.70:8008']
params:
metric: ['ip_countries_bps']
key: ['null:[country:ipsource]:unknown','null:[country:ipdestination]:unknown']
label: ['src','dst']
value: ['bytes']
scale: ['8']
aggMode: ['sum']
minValue: ['1000']
maxFlows: ['100']
sflow {
  collector { ip=10.0.0.70 }
  docker { }
  pcap { dev=docker0 }
  pcap { dev=docker_gwbridge }
}
The above /etc/hsflowd.conf file, see Configuring Host sFlow for Linux via /etc/hsflowd.conf, enables the docker {} and pcap {} modules for detailed visibility into container metrics and network traffic flows, and streams telemetry to an sFlow collector (10.0.0.70). The configuration is the same for every node making it simple to install and configure Host sFlow on all nodes using orchestration software such as Puppet, Chef, Ansible, etc.
$ docker run -p 6343:6343/udp -p 8008:8008 sflow/tcpdump

19:06:42.000000 ARP, Reply 10.0.0.254 is-at c0:ea:e4:89:b0:98 (oui Unknown), length 64
19:06:42.000000 IP 10.0.0.236.548 > 10.0.0.70.61719: Flags [P.], seq 3380015689:3380015713, ack 515038158, win 41992, options [nop,nop,TS val 1720029042 ecr 904769627], length 24
19:06:42.000000  Continue reading

$ docker run -p 6343:6343/udp sflow/sflowtoolThe -g option flattens the output so that it is more easily filtered using grep:
startDatagram =================================
datagramSourceIP 10.0.0.111
datagramSize 144
unixSecondsUTC 1321922602
datagramVersion 5
agentSubId 0
agent 10.0.0.20
packetSequenceNo 3535127
sysUpTime 270660704
samplesInPacket 1
startSample ----------------------
sampleType_tag 0:2
sampleType COUNTERSSAMPLE
sampleSequenceNo 228282
sourceId 0:14
counterBlock_tag 0:1
ifIndex 14
networkType 6
ifSpeed 100000000
ifDirection 0
ifStatus 3
ifInOctets 4839078
ifInUcastPkts 15205
ifInMulticastPkts 0
ifInBroadcastPkts 4294967295
ifInDiscards 0
ifInErrors 0
ifInUnknownProtos 4294967295
ifOutOctets 149581962744
ifOutUcastPkts 158884229
ifOutMulticastPkts 4294967295
ifOutBroadcastPkts 4294967295
ifOutDiscards 101
ifOutErrors 0
ifPromiscuousMode 0
endSample ----------------------
endDatagram =================================
$ docker run -p 6343:6343/udp sflow/sflowtool -g | grep ifInOctets
2019-09-03T22:37:21+0000 10.0.0.231  Continue reading
wget https://inmon.com/products/sFlow-RT/sflow-rt.tar.gzOn a system with Docker installed:
tar -xvzf sflow-rt.tar.gz
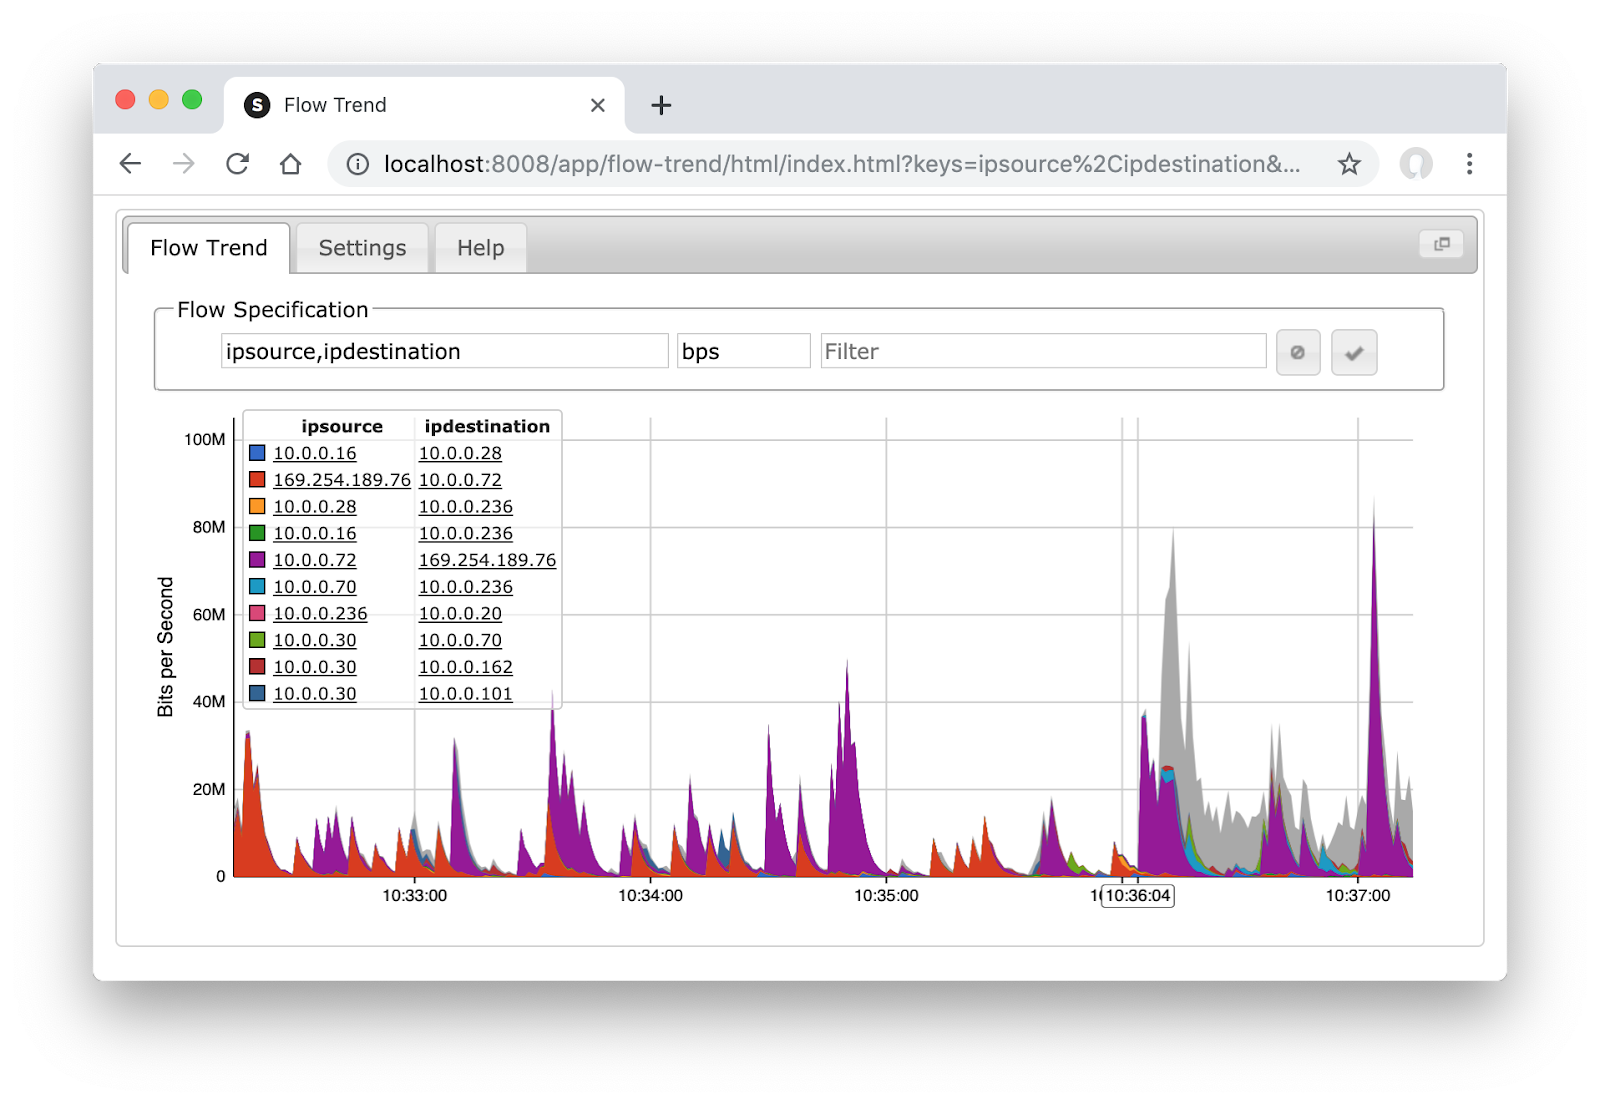
./sflow-rt/get-app.sh sflow-rt flow-trend
./sflow-rt/get-app.sh sflow-rt browse-metrics
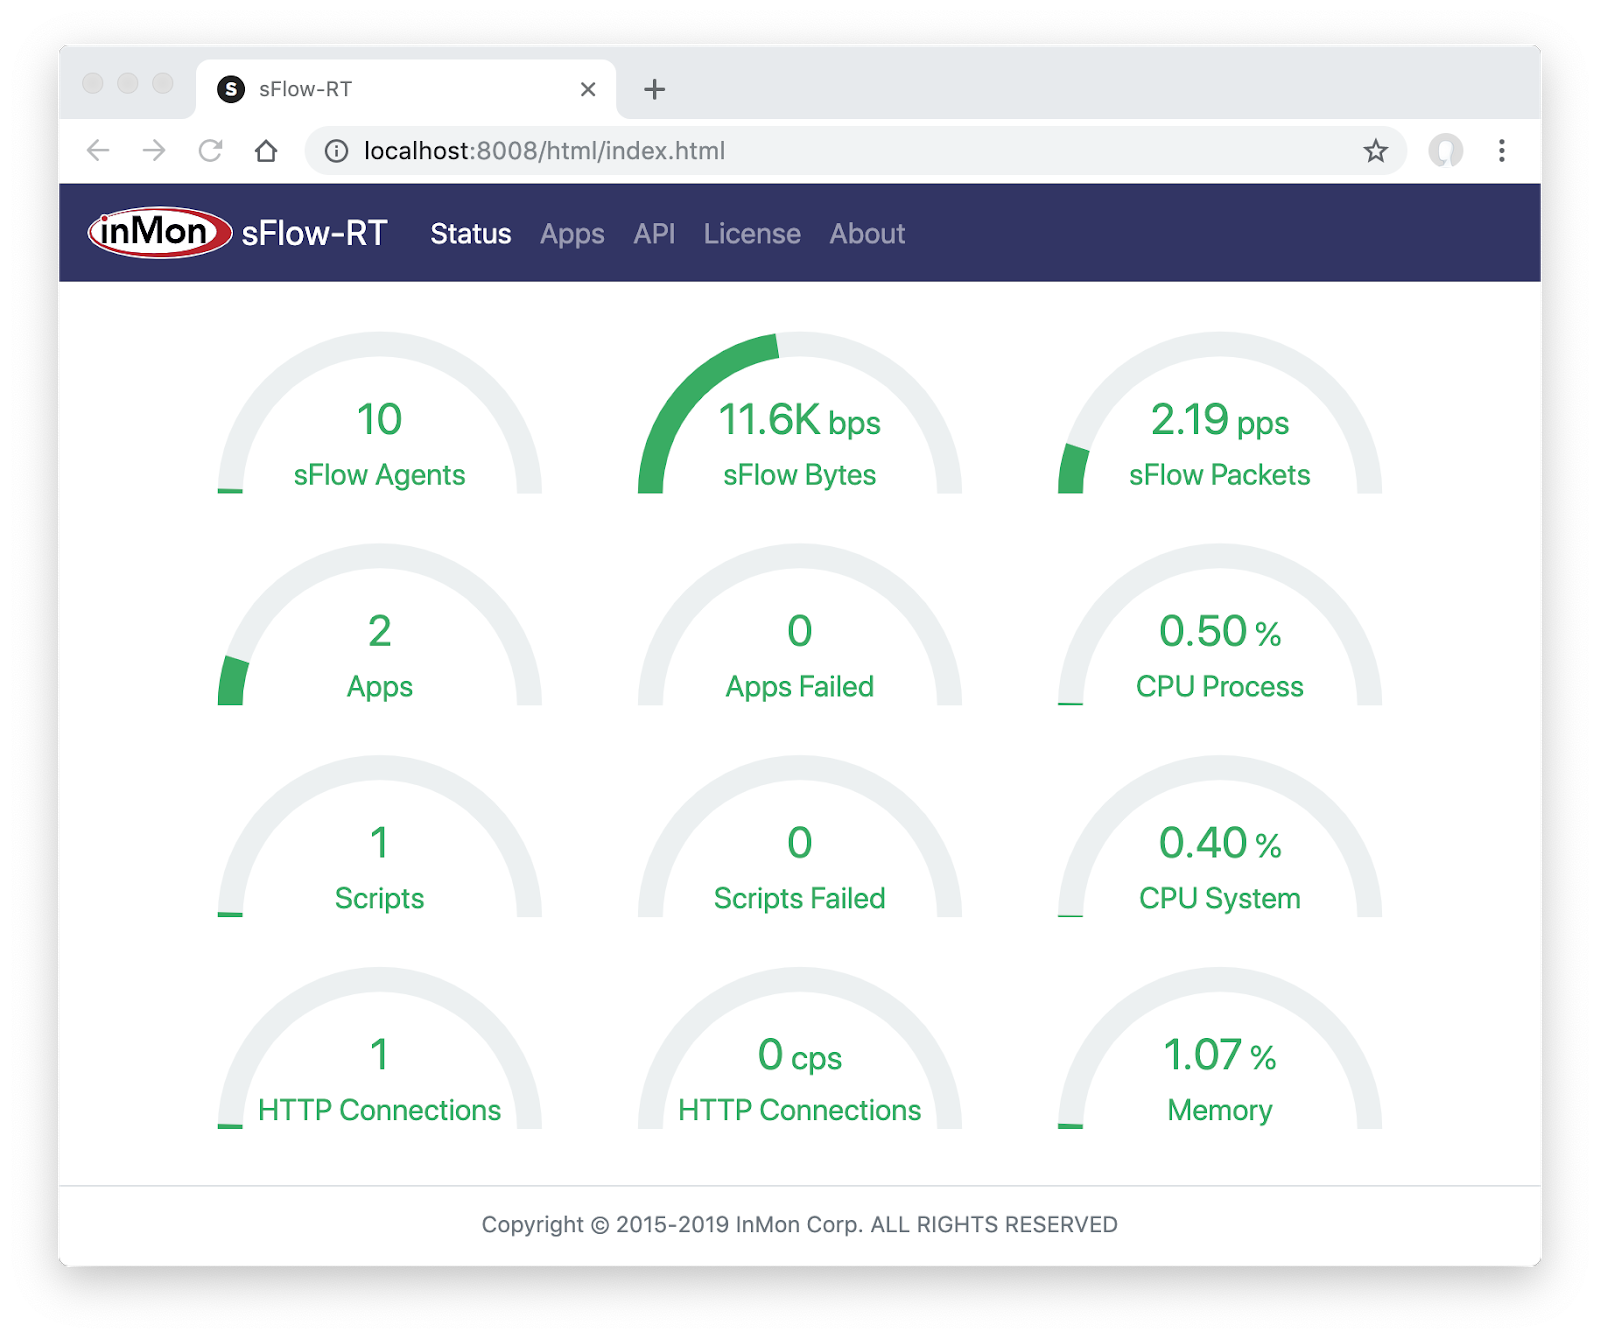
./sflow-rt/start.sh
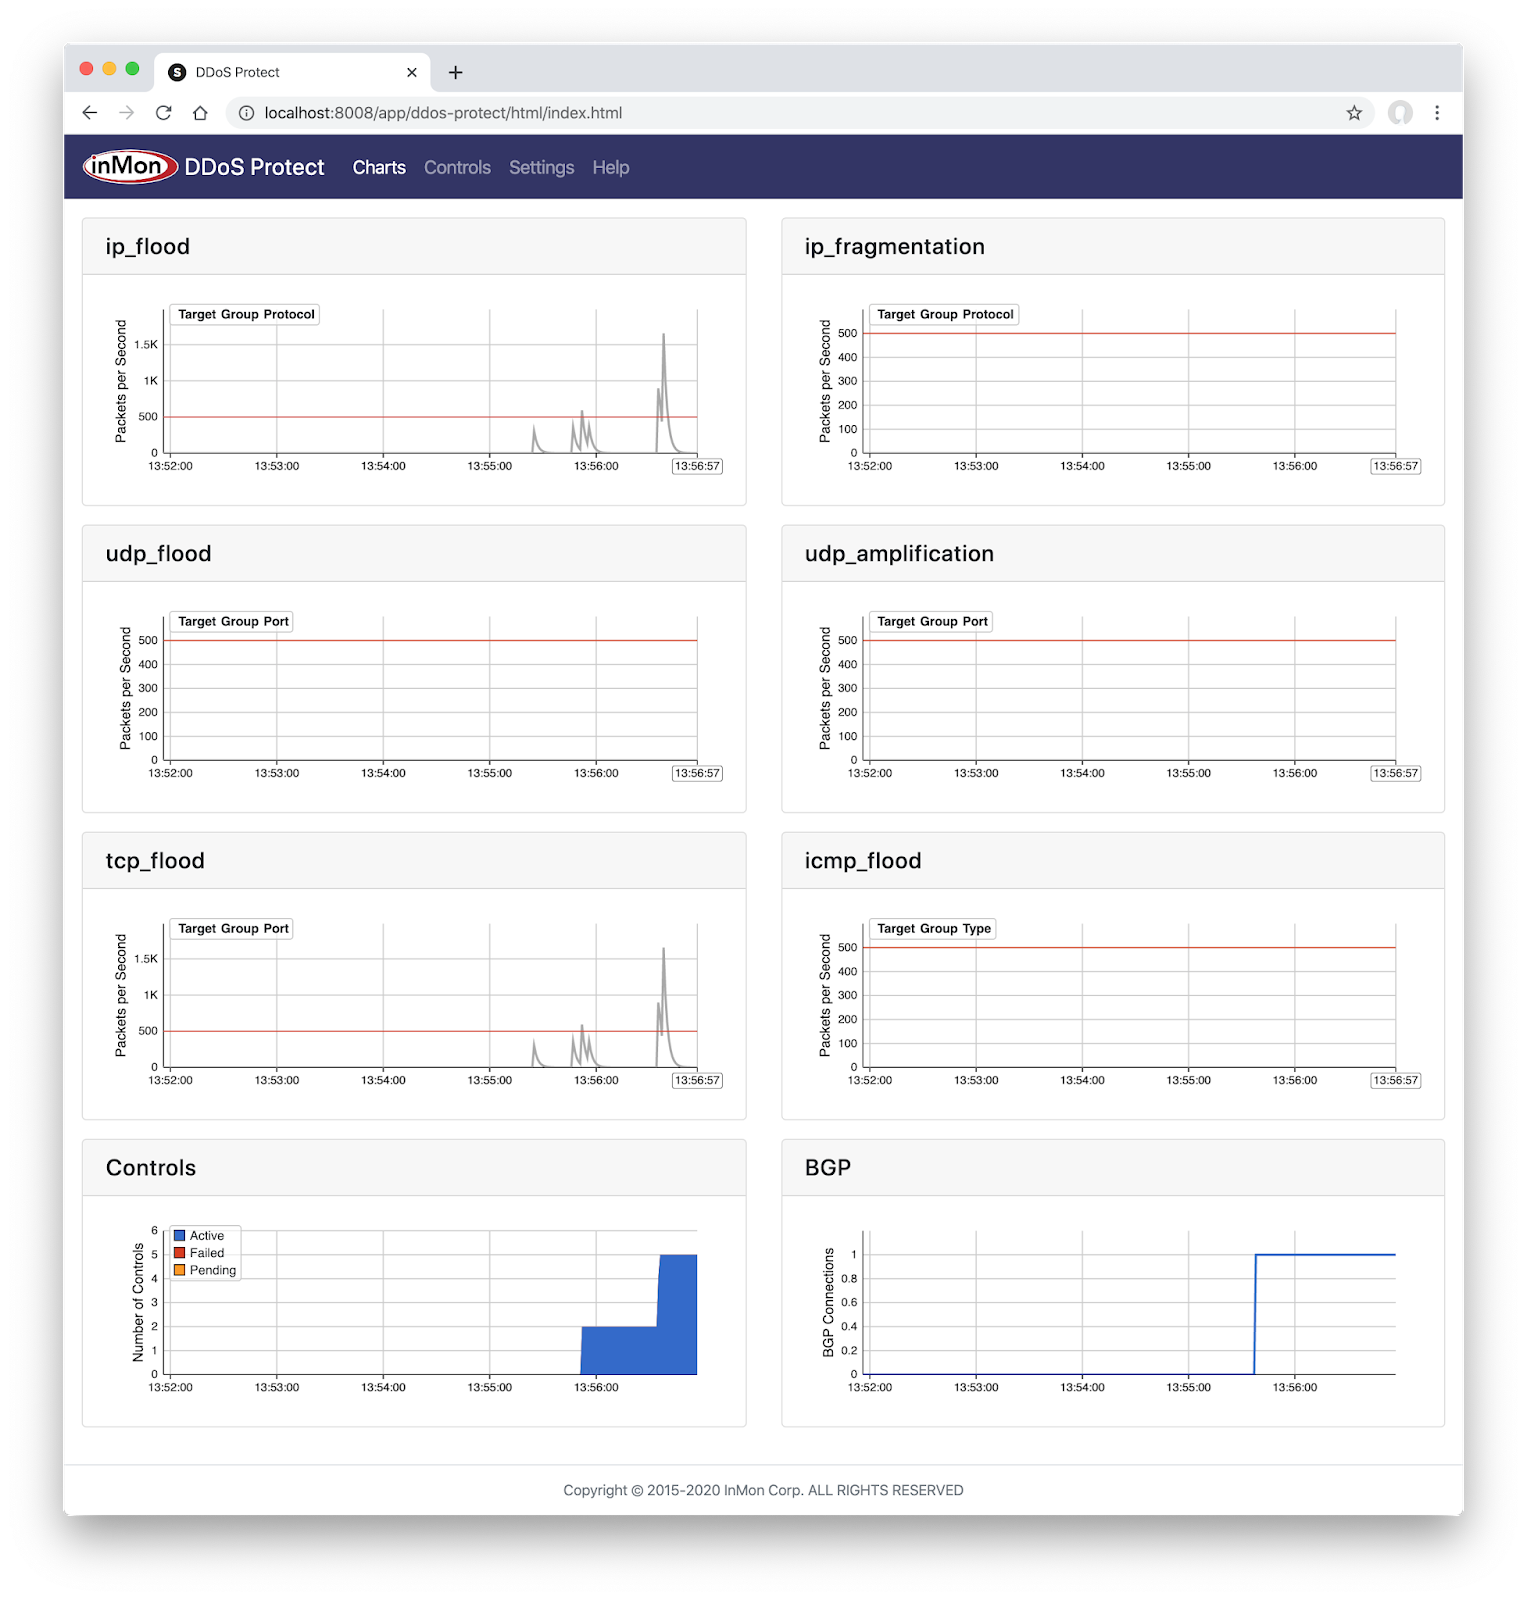
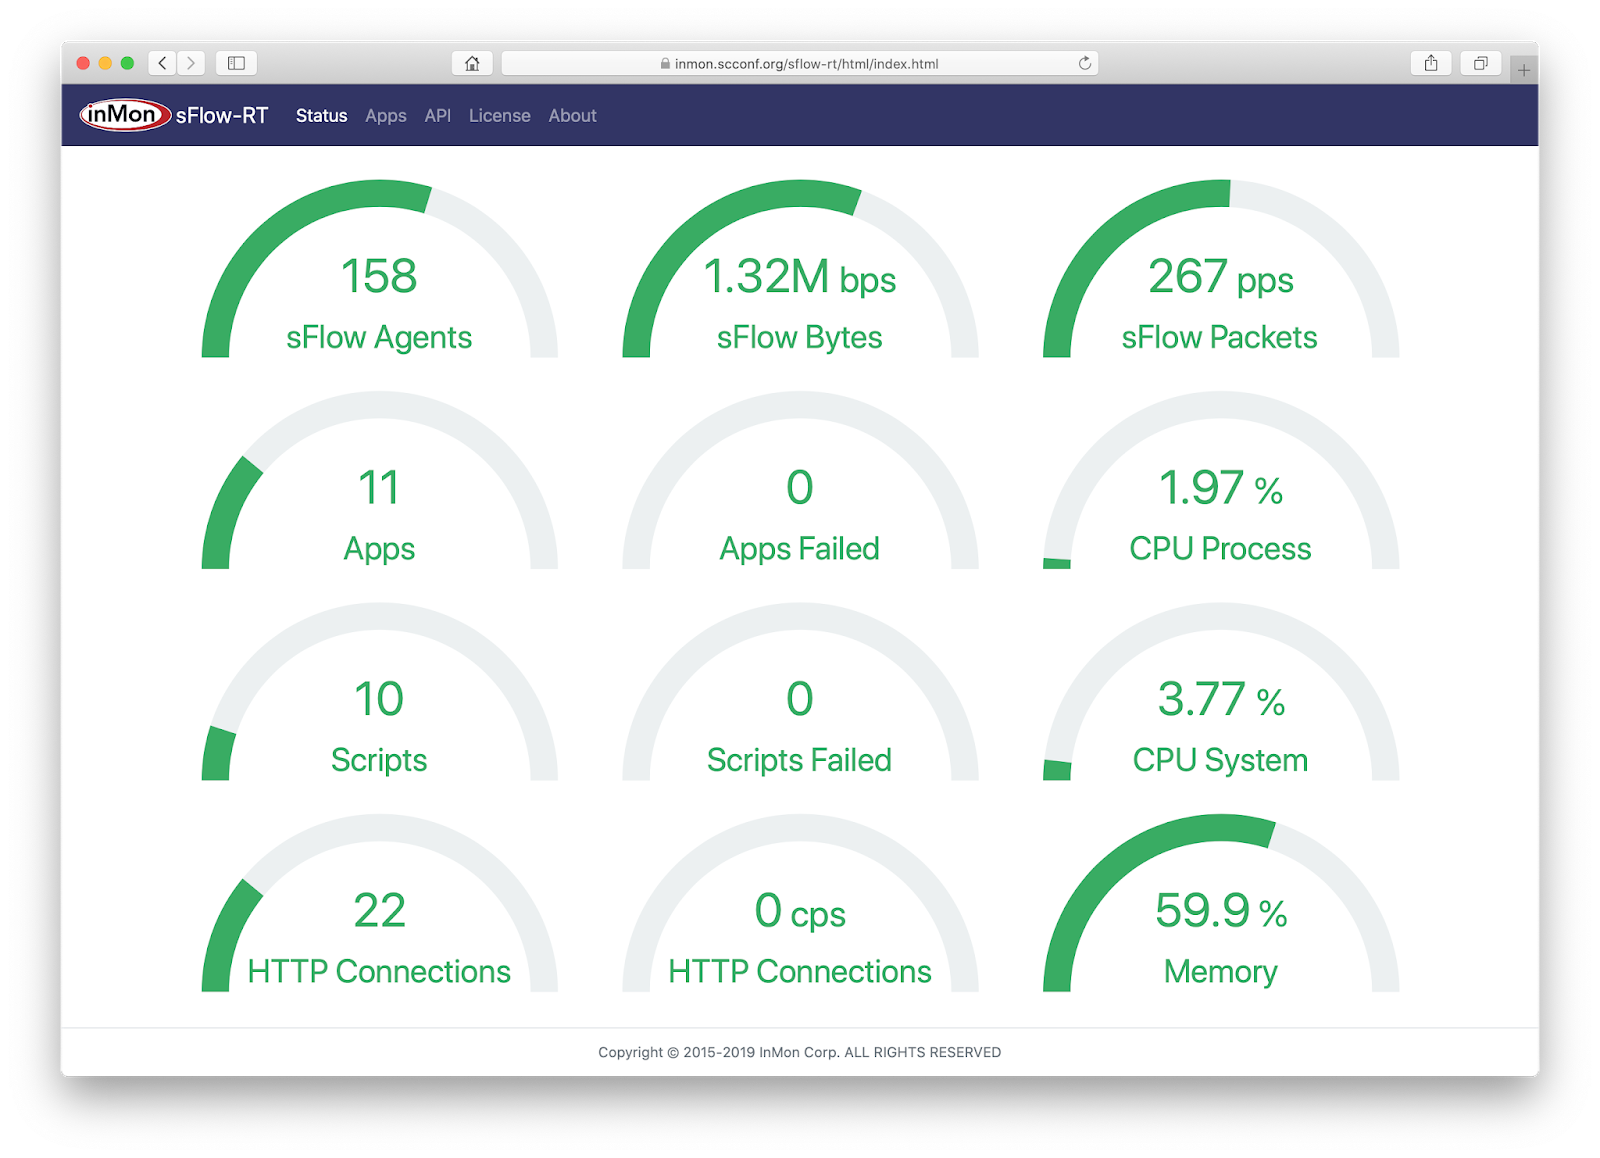
mkdir appThe product user interface can be accessed on port 8008. The Status page, shown at the top of this article, displays key metrics about the performance of the software.
docker run -v $PWD/app:/sflow-rt/app --entrypoint /sflow-rt/get-app.sh sflow/sflow-rt sflow-rt flow-trend
docker run -v $PWD/app:/sflow-rt/app --entrypoint /sflow-rt/get-app.sh sflow/sflow-rt sflow-rt browse-metrics
docker run -v $PWD/app:/sflow-rt/app -p 6343:6343/udp -p 8008:8008 sflow/sflow-rt

!
service routing protocols model multi-agent
!
sflow sample 16384
sflow polling-interval 30
sflow destination 10.0.0.70
sflow run
!
interface Ethernet1
   flow-spec ipv4 ipv6
!
interface Management1
   ip address 10.0.0.96/24
!
ip routing
!
router bgp 65096
   router-id 10.0.0.96
   neighbor 10.0.0.70 remote-as 65070
   neighbor 10.0.0.70 transport remote-port 1179
   neighbor 10.0.0.70 send-community extended
   neighbor 10.0.0.70 maximum-routes 12000
   !
   address-family flow-spec ipv4
      neighbor 10.0.0.70  Continue reading

sudo mn --custom sflow-rt/extras/sflow.py --link tc,bw=10 \Mininet, ONOS, and segment routing provides an example using a Custom Topology, e.g.
--topo tree,depth=2,fanout=2
sudo env ONOS=10.0.0.73 mn --custom sr.py,sflow-rt/extras/sflow.py \This article describes how to incorporate sFlow monitoring in a fully custom Mininet script. Consider the following simpletest.py script based on Working with Mininet:
--link tc,bw=10 --topo=sr '--controller=remote,ip=$ONOS,port=6653'
#!/usr/bin/python

from mininet.topo import Topo
from mininet.net import Mininet
from mininet.util import dumpNodeConnections
from mininet.log import setLogLevel

class SingleSwitchTopo(Topo):
    "Single switch connected to n hosts."
    def build(self, n=2):
        switch = self.addSwitch('s1')
        # Python's range(N) generates 0..N-1
        for h in range(n):
            host = self.addHost('h%s' % (h + 1))
            self.addLink(host, switch)

def simpleTest():
    "Create and test a simple network"
    topo = SingleSwitchTopo(n=4)
    net = Mininet(topo)
    net.start()
    print "Dumping host connections"
    dumpNodeConnections(net.hosts)
    print "Testing bandwidth between h1 and h4"
    h1, h4 = net.get( 'h1', 'h4' )
    net.iperf( (h1, h4) )
    net.stop()

if __name__ == '__main__':
    #  Continue reading

#!/usr/bin/python

import socket
import sys
import argparse

parser = argparse.ArgumentParser(description='Serialize/deserialize sFlow')
parser.add_argument('-c', '--collector', default='')
parser.add_argument('-s', '--server')
parser.add_argument('-p', '--port', type=int, default=6343)
 Continue reading

docker run --name sflow-rt -p 8008:8008 -p Continue reading
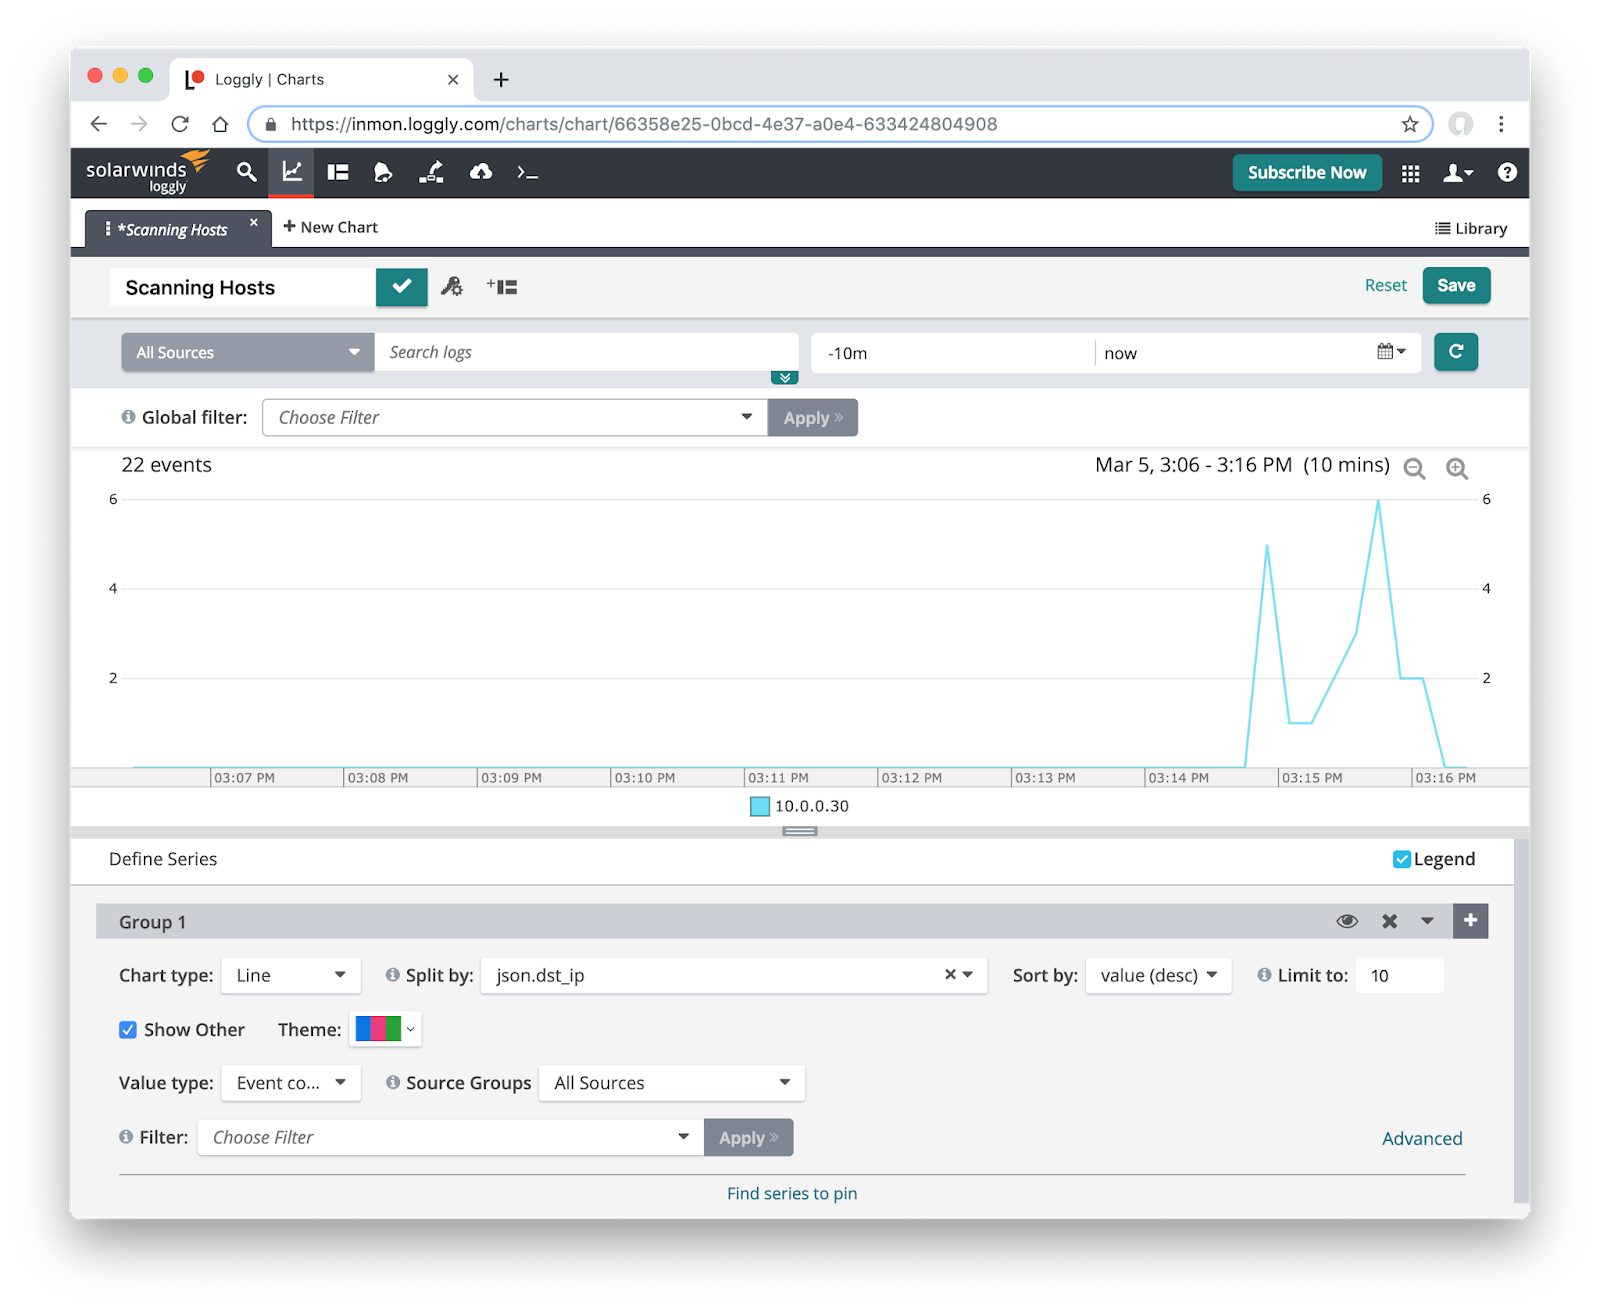 Loggly is a cloud logging and and analysis platform. This article will demonstrate how to integrate network events generated from industry standard sFlow instrumentation build into network switches.
Loggly offers a free 14 day evaluation, so you can try this example at no cost.ICMP unreachable describes how monitoring ICMP destination unreachable messages can help identify misconfigured hosts and scanning behavior. The article uses the sFlow-RT real-time analytics software to process the raw sFlow and report on unreachable messages.
var token = 'xxxxxxxx-xxxx-xxxx-xxxx-xxxxxxxxxxxx';Some notes on the script:
var url = 'https://logs-01.loggly.com/inputs/'+token+'/tag/http/';
var keys = [
'icmpunreachablenet',
'icmpunreachablehost',
'icmpunreachableprotocol',
'icmpunreachableport'
];
for (var i = 0; i < keys.length; i++) {
var key = keys[i];
setFlow(key, {
keys:'macsource,ipsource,macdestination,ipdestination,' + key,
value:'frames',
log:true,
flowStart:true
});
}
setFlowHandler(function(rec) {
var keys = rec.flowKeys.split(',');
var msg = {
flow_type:rec.name,
src_mac:keys[0],
src_ip:keys[1],
dst_mac:keys[2],
dst_ip:keys[3],
unreachable:keys[4]
};
try { http(url,'post','application/json',JSON.stringify(msg)); }
catch(e) { logWarning(e); };
}, keys);
git clone https://github.com/sflow/sflowtool.gitThe -J option formats the JSON output to be human readable:
cd sflowtool/
./boot.sh
./configure
make
sudo make install
$ sflowtool -JThe output shows the JSON representation of a single sFlow datagram containing one counter sample and one flow sample.
{
"datagramSourceIP":"10.0.0.162",
"datagramSize":"396",
"unixSecondsUTC":"1544241239",
"localtime":"2018-12-07T19:53:59-0800",
"datagramVersion":"5",
"agentSubId":"0",
"agent":"10.0.0.231",
"packetSequenceNo":"1068783",
"sysUpTime":"1338417874",
"samplesInPacket":"2",
"samples":[
{
"sampleType_tag":"0:2",
"sampleType":"COUNTERSSAMPLE",
"sampleSequenceNo":"148239",
"sourceId":"0:3",
"elements":[
{
"counterBlock_tag":"0:1",
"ifIndex":"3",
"networkType":"6",
"ifSpeed":"1000000000",
"ifDirection":"1",
"ifStatus":"3",
"ifInOctets":"4162076356",
"ifInUcastPkts":"16312256",
"ifInMulticastPkts":"187789",
"ifInBroadcastPkts":"2566",
"ifInDiscards":"0",
"ifInErrors":"0",
"ifInUnknownProtos":"0",
"ifOutOctets":"2115351089",
"ifOutUcastPkts":"7087570",
"ifOutMulticastPkts":"4453258",
"ifOutBroadcastPkts":"6141715",
"ifOutDiscards":"0",
"ifOutErrors":"0",
"ifPromiscuousMode":"0"
},
{
"counterBlock_tag":"0:2",
"dot3StatsAlignmentErrors":"0",
"dot3StatsFCSErrors":"0",
"dot3StatsSingleCollisionFrames":"0",
"dot3StatsMultipleCollisionFrames":"0",
"dot3StatsSQETestErrors":"0",
"dot3StatsDeferredTransmissions":"0",
"dot3StatsLateCollisions":"0",
"dot3StatsExcessiveCollisions":"0",
"dot3StatsInternalMacTransmitErrors":"0",
"dot3StatsCarrierSenseErrors":"0",
"dot3StatsFrameTooLongs":"0",
"dot3StatsInternalMacReceiveErrors":"0",
"dot3StatsSymbolErrors":"0"
}
]
},
{
"sampleType_tag":"0:1",
"sampleType":"FLOWSAMPLE",
"sampleSequenceNo":"11791",
"sourceId":"0:3",
"meanSkipCount":"2000",
"samplePool":"34185160",
"dropEvents":"0",
"inputPort":"3",
"outputPort":"10",
"elements":[
{
"flowBlock_tag":"0:1",
"flowSampleType":"HEADER",
"headerProtocol":"1",
"sampledPacketSize":"102",
"strippedBytes":"0",
"headerLen":"104",
"headerBytes":"0C-AE-4E-98-0B-89-05-B6-D8-D9-A2-66-80-00-54-00-00-45-08-12-04-00-04-10-4A-FB-A0-00-00-BC-A0-00-00-EF-80-00-DE-B1-E7-26-00-20-75-04-B0-C5-00-00-00-00-96-01-20-00-00-00-00-00-01-11-21-31-41-51-61-71-81-91-A1-B1-C1-D1-E1-F1-02-12-22-32-42-52-62-72-82-92-A2-B2-C2-D2-E2-F2-03-13-23-33-43-53-63-73-1A-1D-4D-76-00-00",
"dstMAC":"0cae4e980b89",
"srcMAC":"05b6d8d9a266",
"IPSize":"88",
"ip.tot_len":"84",
"srcIP":"10.0.0.203",
"dstIP":"10.0.0.254",
"IPProtocol":"1",
"IPTOS":"0",
"IPTTL":"64",
"IPID":"8576",
"ICMPType":"8",
"ICMPCode":"0"
},
{
"flowBlock_tag":"0:1001",
"extendedType":"SWITCH",
"in_vlan":"1",
"in_priority":"0",
"out_vlan":"1",
"out_priority":"0"
}
]
}
]
}