AWS Networking – Part X: VPC Internet Gateway Service – Part One
Introduction
This chapter explains what components/services and configurations we need to allow Internet traffic to and from an EC2 instance. VPCs themselves are closed entities. If we need an Internet connection, we need to use an AWS Internet Gateway (IGW) service. The IGW is running on a Blackfoot Edge Device in the AWS domain. It performs Data-Plane VPC encapsulation and decapsulation, as well as IP address translation. We also need public, Internet routable IP addresses. In our example, we allocate an AWS Elastic-IP (EIP) address. Then we associate it with EC2 Instance. By doing it, we don’t add the EIP to the EC2 instance itself. Instead, we create a static one-to-one NAT entry into the VPC associated IGW. The subnet Route Table includes only a VPC’s CIDR range local route. That is why we need to add a routing entry to the Subnet RT, default or more specific, towards IGW. Note that a subnet within an AWS VPC is not a Broadcast domain (VPC doesn’t even support Broadcasts). Rather, we can think of it as a logical place for EC2 instances having uniform connection requirements, like reachability from the Internet. As a next step, we define the security policy. Each Subnet has a Network Access Control List (NACL), which is a stateless Data-Plane filter. The Stateless definition means that to allow bi-directional traffic flow, we have to permit flow-specific Request/Reply data separately. For simplicity, we are going to use the Subnet Default NACL. The Security Group (SG), in turn, is a stateful EC2 instance-specific Data-Plane filter. The Stateful means that filter permits flow-based ingress and egress traffic. Our example security policy is based on the SG. We will allow an SSH connection from the external host 91.152.204.245 to EC2 instance NWKT-EC-Fron-End. In addition, we allow all ICMP traffic from the EC2 instance to the same external host. As the last part, this chapter introduces the Reachability Analyzer service, which we can use for troubleshooting connections. Figure 3-1 illustrates what we are going to build in this chapter.

Figure 3-1: Setting Up an Internet Connection for Public Subnet of AWS VPC.
Cloudflare Research: Two Years In

Great technology companies build innovative products and bring them into the world; iconic technology companies change the nature of the world itself.

Cloudflare’s mission reflects our ambitions: to help build a better Internet. Fulfilling this mission requires a multifaceted approach that includes ongoing product innovation, strategic decision-making, and the audacity to challenge existing assumptions about the structure and potential of the Internet. Two years ago, Cloudflare Research was founded to explore opportunities that leverage fundamental and applied computer science research to help change the playing field.
We’re excited to share five operating principles that guide Cloudflare’s approach to applying research to help build a better Internet and five case studies that exemplify these principles. Cloudflare Research will be all over the blog for the next several days, so subscribe and follow along!
Innovation comes from all places
Innovative companies don’t become innovative by having one group of people within the company dedicated to the future; they become that way by having a culture where new ideas are free-flowing and can come from anyone. Research is most effective when it is permitted to grow beyond or outside isolated lab environments, is deeply integrated into all facets of a company’s work, Continue reading
OMG: Democratizing Network Automation
I totally understand that entities relying on sponsors have to become creative while promoting whatever theirs sponsors want to sell, but in my opinion this is a bridge too far:
[…] explore how Gluware aims to democratize automation; that is, get you quick wins around common tasks such as configuration changes and OS updates.
Democratizing automation? Because it’s authoritarian now? By providing the abilities like configuration changes and OS updates that have been available in network management tools like CiscoWorks or SolarWinds for ages?
You know what’s really hard when automating existing networks? Figuring out how to simplify them to the point where it makes sense to automate them. Will any shrink-wrapped GUI product solve that? Of course not.
Where is mobile traffic the most and least popular?


You’re having dinner, you look at the table next to and everyone is checking their phone, scrolling and browsing and interacting with that little (is getting bigger) piece of hardware that puts you in contact with friends, family, work and the giant public square of sorts that social media has become. That could happen in the car (hopefully with the passengers, never the driver), at home when you’re on the sofa, in bed or even when you’re commuting or just bored in line for the groceries.
Or perhaps you use your mobile phone as your only connection to the Internet. It might be your one means of communication and doing business. For many, the mobile Internet opened up access and opportunity that simply was not possible before.
Around the world the use of mobile Internet differs widely. In some countries mobile traffic dominates, in others desktop still reigns supreme.
Mobile Internet traffic has changed the way we relate to the online world — work (once, for some, done on desktop/laptop computers) is just one part of it — and Cloudflare Radar can help us get a better understanding of global Internet traffic but also access regional trends, and monitor emerging Continue reading
Must Read: BGP Private AS Range
We all know that you have to use an AS number between 64512 and 65535 for private BGP autonomous systems, right? Well, we’re all wrong – the high end of the range is 65534, and Chris Parker wrote a nice blog post explaining the reasons behind that change.
Must Read: BGP Private AS Range
We all know that you have to use an AS number between 64512 and 65535 for private BGP autonomous systems, right? Well, we’re all wrong – the high end of the range is 65534, and Chris Parker wrote a nice blog post explaining the reasons behind that change.
Nornir: Tasks, Plugins and Templates
Nornir tasks are run against all or a subset of inventory members with the result formatted into a framework structured to show what was run against whom and the results. Tasks can be custom built python code or pre-built plugins that have been installed and imported.
Heavy Networking 601: Monitoring The Dispersed Network With Cisco ThousandEyes (Sponsored)
Cisco ThousandEyes is a long-time Packet Pushers sponsor, and we're going to probe deeply to discuss the latest feature additions that will bring you the data you need. And, since it’s been just about a year since ThousandEyes was acquired by Cisco, we’ll also discuss how ThousandEyes is being integrated into the gargantuan Cisco product portfolio.
The post Heavy Networking 601: Monitoring The Dispersed Network With Cisco ThousandEyes (Sponsored) appeared first on Packet Pushers.
Heavy Networking 601: Monitoring The Dispersed Network With Cisco ThousandEyes (Sponsored)
Cisco ThousandEyes is a long-time Packet Pushers sponsor, and we're going to probe deeply to discuss the latest feature additions that will bring you the data you need. And, since it’s been just about a year since ThousandEyes was acquired by Cisco, we’ll also discuss how ThousandEyes is being integrated into the gargantuan Cisco product portfolio.Why Enterprise IT Should Follow the Use of Emerging Tech in Sports
The National Football League’s long history of experiences – good and bad - with emerging technology products and services provides pure B2Bers with time and effort-saving learnings.Rethinking observability for Kubernetes
Observability is a staple of high-performing software and DevOps teams. Research shows that a comprehensive observability solution, along with a number of other technical practices, positively contributes to continuous delivery and service uptime.
Observability is sometimes confused with monitoring, but there is a clear difference between the two; it’s important to understand the distinction. Observability refers to a technical solution that enables teams to actively debug a system. It is based on exploring activities, properties, and patterns that are not defined in advance. Monitoring, in contrast, is a technical solution that enables teams to watch and understand the state of their systems and is based on gathering pre-defined sets of metrics or logs.
What makes Kubernetes observability different?
Conventional observability and monitoring tools were designed for monolithic systems, observing the health and behavior of a single application instance. Complex distributed microservices architectures, like Kubernetes, are constantly changing, with hundreds and even thousands of pods being created and destroyed within minutes. Because this environment is so dynamic, pre-defined metrics and logs aren’t effective for troubleshooting issues. Conventional observability approaches, which work well in traditional, monolithic environments, are inadequate for Kubernetes. So an observability solution that is purpose-built for a distributed microservices Continue reading
Weekend Reads 100821

first, a few interesting stories on the facebook outage
and other stories, as usual
What Can You Learn From Facebook’s Meltdown?

I wanted to wait to put out a hot take on the Facebook issues from earlier this week because failures of this magnitude always have details that come out well after the actual excitement is done. A company like Facebook isn’t going to do the kind of in-depth post-mortem that we might like to see but the amount of information coming out from other areas does point to some interesting circumstances causing this situation.
Let me start off the whole thing by reiterating something important: Your network looks absolutely nothing like Facebook. The scale of what goes on there is unimaginable to the normal person. The average person has no conception of what one billion looks like. Likewise, the scale of the networking that goes on at Facebook is beyond the ken of most networking professionals. I’m not saying this to make your network feel inferior. More that I’m trying to help you understand that your network operations resemble those at Facebook in the same way that a model airplane resembles a space shuttle. They’re alike on the surface only.
Facebook has unique challenges that they have to face in their own way. Network automation there isn’t a bonus. It’s Continue reading
What happened on the Internet during the Facebook outage
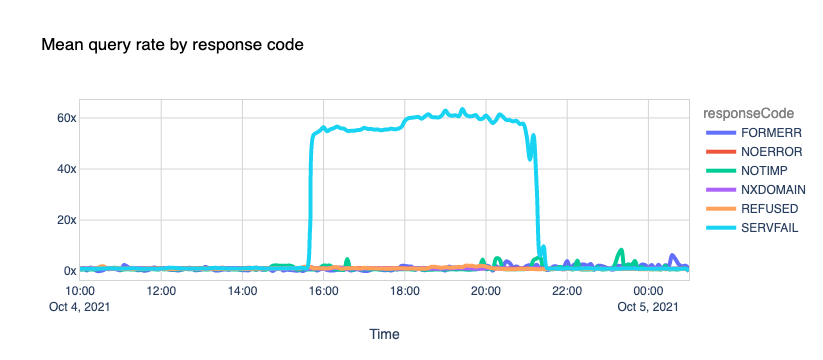
It's been a few days now since Facebook, Instagram, and WhatsApp went AWOL and experienced one of the most extended and rough downtime periods in their existence.
When that happened, we reported our bird's-eye view of the event and posted the blog Understanding How Facebook Disappeared from the Internet where we tried to explain what we saw and how DNS and BGP, two of the technologies at the center of the outage, played a role in the event.
In the meantime, more information has surfaced, and Facebook has published a blog post giving more details of what happened internally.
As we said before, these events are a gentle reminder that the Internet is a vast network of networks, and we, as industry players and end-users, are part of it and should work together.
In the aftermath of an event of this size, we don't waste much time debating how peers handled the situation. We do, however, ask ourselves the more important questions: "How did this affect us?" and "What if this had happened to us?" Asking and answering these questions whenever something like this happens is a great and healthy exercise that helps us improve our own resilience.
IPv6 Buzz 086: E-Commerce And Holiday Shopping With IPv6!
As the holiday shopping season fast approaches, the IPv6 Buzz crew dive into IPv6 in relation to e-commerce.
The post IPv6 Buzz 086: E-Commerce And Holiday Shopping With IPv6! appeared first on Packet Pushers.
IPv6 Buzz 086: E-Commerce And Holiday Shopping With IPv6!
As the holiday shopping season fast approaches, the IPv6 Buzz crew dive into IPv6 in relation to e-commerce.Helping Apache Servers stay safe from zero-day path traversal attacks (CVE-2021-41773)

On September 29, 2021, the Apache Security team was alerted to a path traversal vulnerability being actively exploited (zero-day) against Apache HTTP Server version 2.4.49. The vulnerability, in some instances, can allow an attacker to fully compromise the web server via remote code execution (RCE) or at the very least access sensitive files. CVE number 2021-41773 has been assigned to this issue. Both Linux and Windows based servers are vulnerable.
An initial patch was made available on October 4 with an update to 2.4.50, however, this was found to be insufficient resulting in an additional patch bumping the version number to 2.4.51 on October 7th (CVE-2021-42013).
Customers using Apache HTTP Server versions 2.4.49 and 2.4.50 should immediately update to version 2.4.51 to mitigate the vulnerability. Details on how to update can be found on the official Apache HTTP Server project site.
Any Cloudflare customer with the setting normalize URLs to origin turned on have always been protected against this vulnerability.
Additionally, customers who have access to the Cloudflare Web Application Firewall (WAF), receive additional protection by turning on the rule with the following IDs:
1c3d3022129c48e9bb52e953fe8ceb2f(for Continue reading
Video: Theoretical View of Network Addressing
After explaining the basics of (network) names, addresses and routes, I wasted a few minutes of everyone’s time discussing the theoretical aspects of layered addressing, and then got back to practical issues like address scopes, namespaces, and address provisioning.
The video ends with a simple (and unappreciated) truth: if you have a point-to-point link between two nodes you don’t need data-link-layer addresses. The consequences of that fact are left as an exercise for the viewer (or you can wait till the next video ;)
You need Free ipSpace.net Subscription to watch the video, and the Standard ipSpace.net Subscription to register for upcoming live sessions.