Response: Anomaly Detection For Monitoring
We manage a distributed system of autonomous elements where the operation, performance and stability is determined by external factors that are out of our operational control.
The post Response: Anomaly Detection For Monitoring appeared first on EtherealMind.
Fragmentation
One of the more difficult design exercises in packet switched network architectures is that of the design of packet fragmentation. In this article I’d like to examine IP packet fragmentation in detail and look at the design choices made by IP version 4, and then compare that with the design choices made by IP version 6.Preview launch of my book “Mastering CoreOS”
Last 6 months, I have been blogging very little since I was busy writing a book on CoreOS. The book is available for pre-ordering now from the publisher website as well as in Amazon. The tentative publishing date is late Feb/early March. Why I wrote the book other than the fact that I can make some … Continue reading Preview launch of my book “Mastering CoreOS”Gopaddle Meetup Bangalore – CI, CD Presentation
Following link captures the slides on CI, CD with Docker, Jenkins and Tutum that I presented at GoPaddle meetup, Bangalore on January 23, 2015. You can find more details on the meetup here. In this presentation, I cover the following: Overview of Continuous Integration(CI), Continuous deployment(CD) Tutum Overview Jenkins with Docker Integration CI, CD Use cases … Continue reading Gopaddle Meetup Bangalore – CI, CD PresentationCI, CD with Docker, Jenkins and Tutum
In this blog, I will give an overview of Continuous Integration (CI) and Continuous Deployment (CD) and cover few CI, CD Use cases with Docker, Jenkins and Tutum. Docker provides Container runtime and tools around Containers to create a Container platform. Jenkins is a CI/CD application to build, test and deploy applications. Tutum is a SaaS … Continue reading CI, CD with Docker, Jenkins and TutumTutum Introduction
Tutum is a SaaS Container platform that can be used to build, deploy and manage Docker Containers. Docker acquired Tutum in October 2015. I have been playing with Tutum for the past few weeks and I will share some basics of Tutum and my experiences with Tutum in this blog. Advantages Very easy to get … Continue reading Tutum IntroductionSyncing IOS Clock from Cellular Provider
I recently had a request to enable time synchronization from a Cellular provider to a 3G model of the Cisco 819. Looking through several documentation sources, I found an example of EEM policy utilizing GPS data in this manner.
LTE GPS Antenna Guide Cisco Integrated Services Router (ISR G2) and Connected Grid Router
After looking at the TCL script outlined in the above document, I thought it would be an easy modification to achieve this result with the cellular network data. After fighting with the script and EEM policy for a couple of hours, I stepped back and looked at the options for creating an EEM Applet. My goal was to achieve similar results but utilizing the time provided by the cellular carrier. This article outlines my process and the final configuration.
The source of the data that I wanted to use was derived from the show cell 0 network command.
CiscoRTR#show cell 0 network
Current Service = 1xEV-DO (Rev A) and 1xRTT
Current Roaming Status(1xRTT) = HOME, (HDR) = HOME
Current Idle Digital Mode = HDR
Current System Identifier (SID) = DDDD
Current Network Identifier (NID) = DDD
Current Call Setup Mode = Mobile IP only
Serving Base Station Longitude =  Continue reading
Defining Software Defined Networking
Can you define what is a Software Defined Network ? Here is my take.
The post Defining Software Defined Networking appeared first on EtherealMind.
Pop Up Tech Talks: Denise Fishburne
Earlier today I saw a tweet that @PopUpTechTalks had uploaded their interview of me up to their YouTube Channel. I was super stoked!  Just had to share it with y’all!
SolidFire’s Amy Lewis speaks with Cisco’s Denise Fishburne aka Fish about embracing your inner network detective at Cisco Live 2015. Filmed June, 2015 in San Diego.
Click on the pic below to see watch the interview.

VMware Reportedly Prepping Layoffs in vSphere
 A source says vSphere, not NSX, is the target.
SDxCentral Weekly News Roundup — January 22, 2016
 JFrog raises money; Cisco invests money; Juniper gets an Air Force deal.
Show 272: The Bleeding Edge Impacting Your Network #NFD11
The Packet Pushers traveled to Silicon Valley to drink from the firehose that was Networking Field Day (#NFD11). What impact does the bleeding edge tech we heard about have on our networks?
The post Show 272: The Bleeding Edge Impacting Your Network #NFD11 appeared first on Packet Pushers.
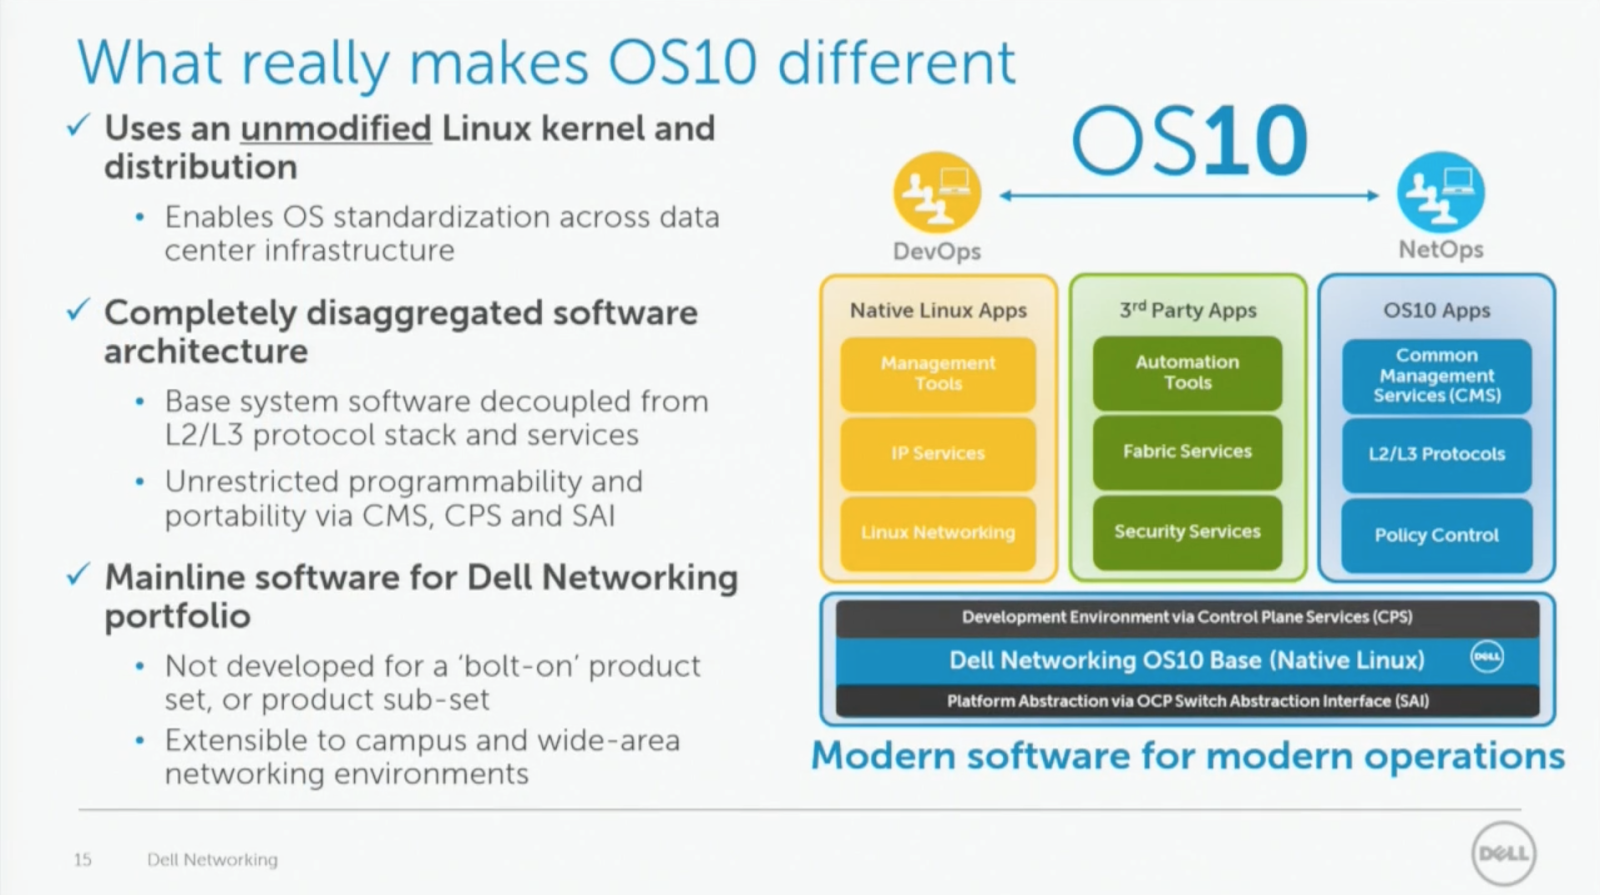
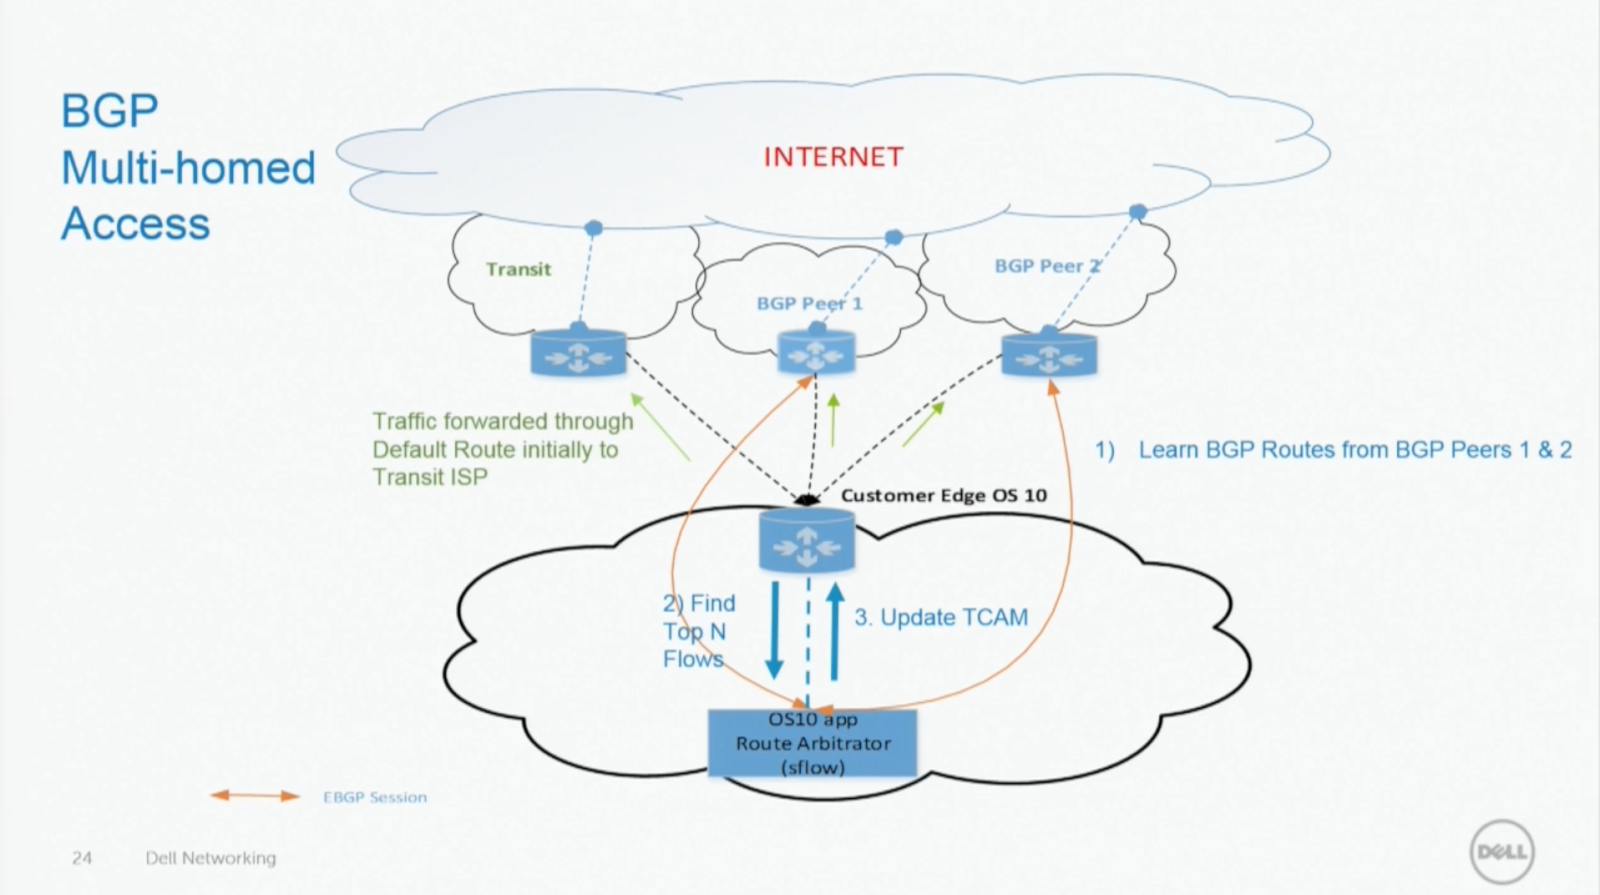
Dell OS10 SDN router demo
In this video from Dell's Network Field Day 11 (#NFD11) presentation, Madhu Santhanam demonstrates an interesting use case for the new OS10 switch operating system that was introduced at the event.

The Next Level: IT Financial Strategies
Getting IT projects funded and justifying IT spending can be complex and frustrating. We talk financial strategies with IT executives to give you ideas and insights you can bring to your organization.
The post The Next Level: IT Financial Strategies appeared first on Packet Pushers.
TeliaSonera & Ericsson to Deploy 5G by 2018
 TeliaSonera was the first to deploy 4G.