Microsoft investment in ChatGPT doesn’t just involve money sunk into its maker, OpenAI, but a massive hardware investment in data centers as well which shows that for now, AI solutions are just for the very top tier companies.The partnership between Microsoft and OpenAI dates back to 2019, when Microsoft invested $1 billion in the AI developer. It upped the ante in January with the investment of an additional $10 billion.But ChatGPT has to run on something, and that is Azure hardware in Microsoft data centers. How much has not been disclosed, but according to a report by Bloomberg, Microsoft had already spent “several hundred million dollars” in hardware used to train ChatGPT.To read this article in full, please click here
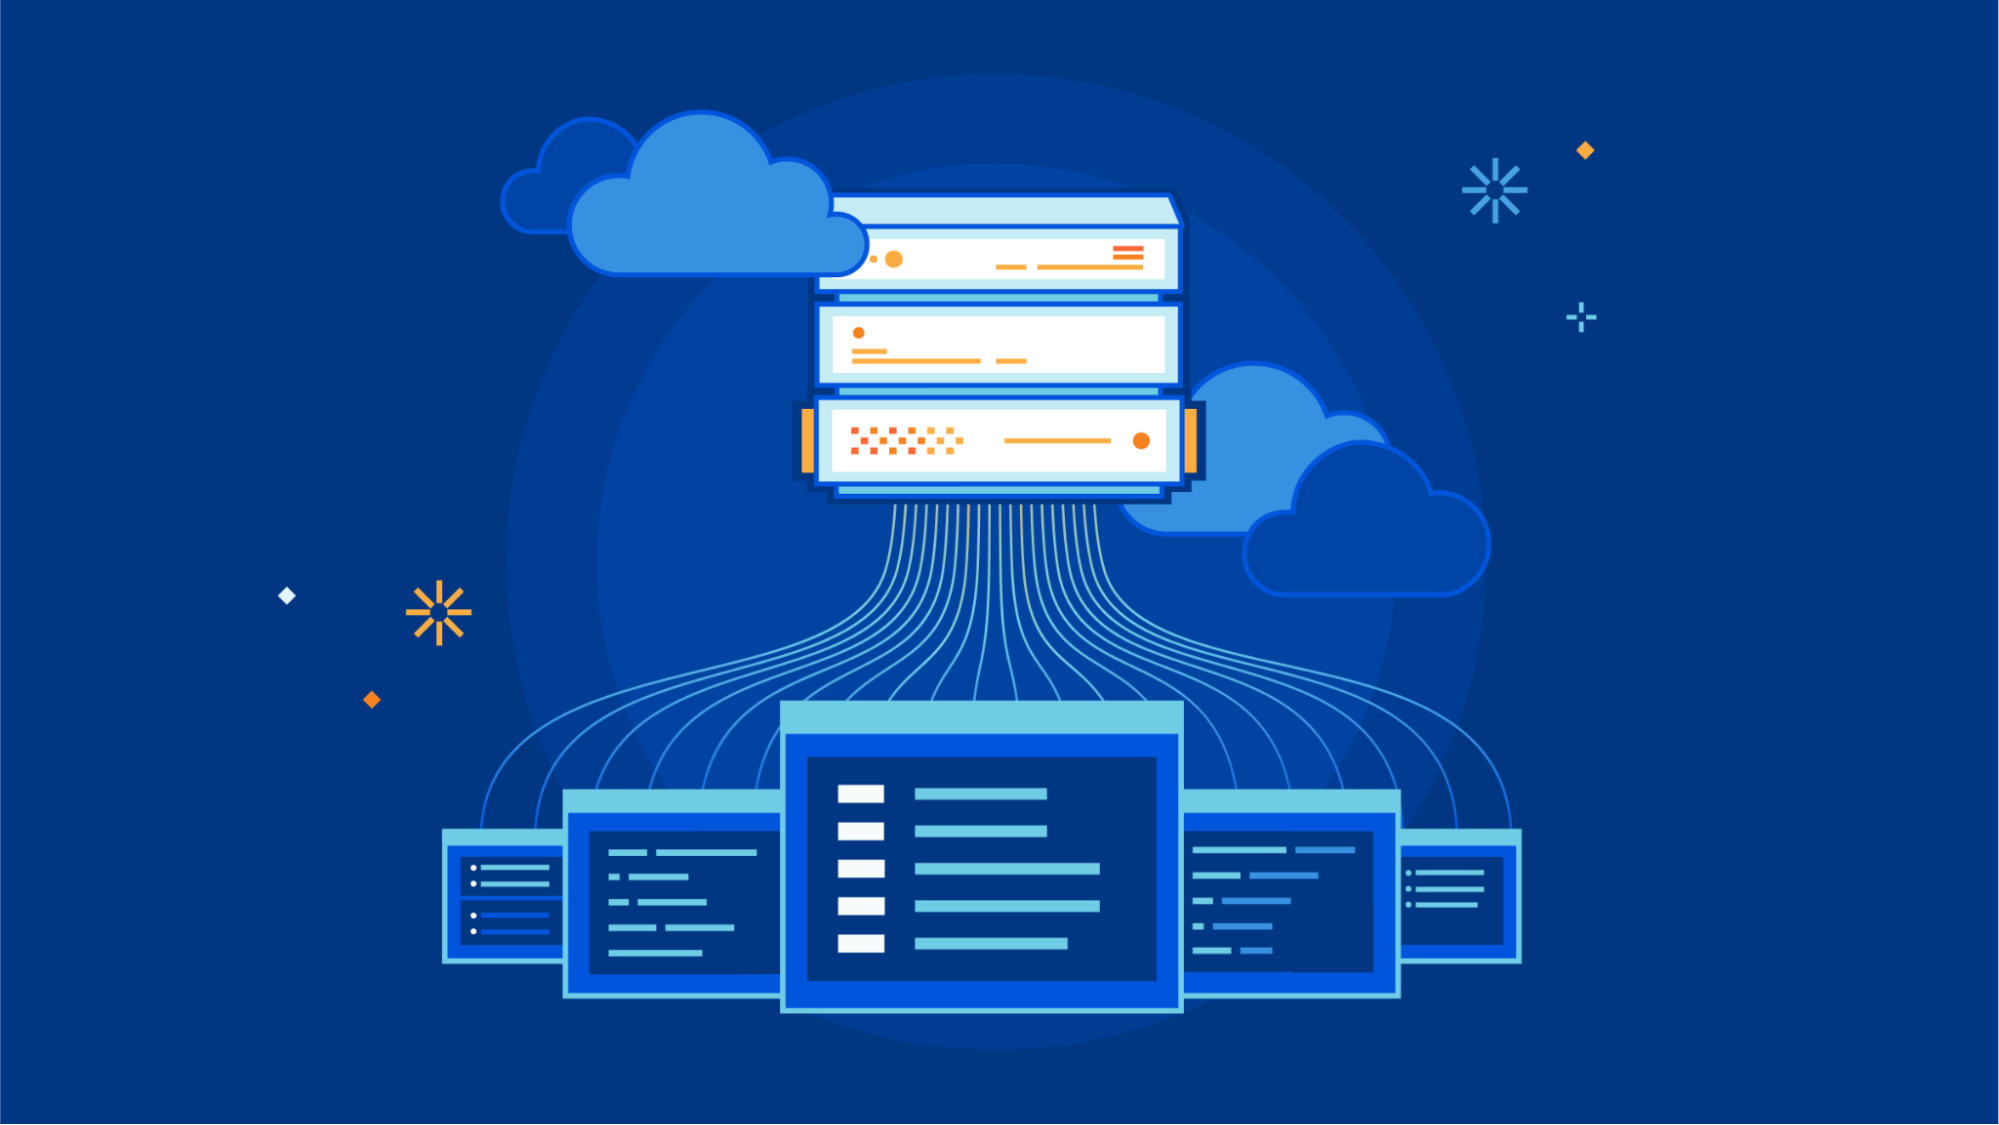
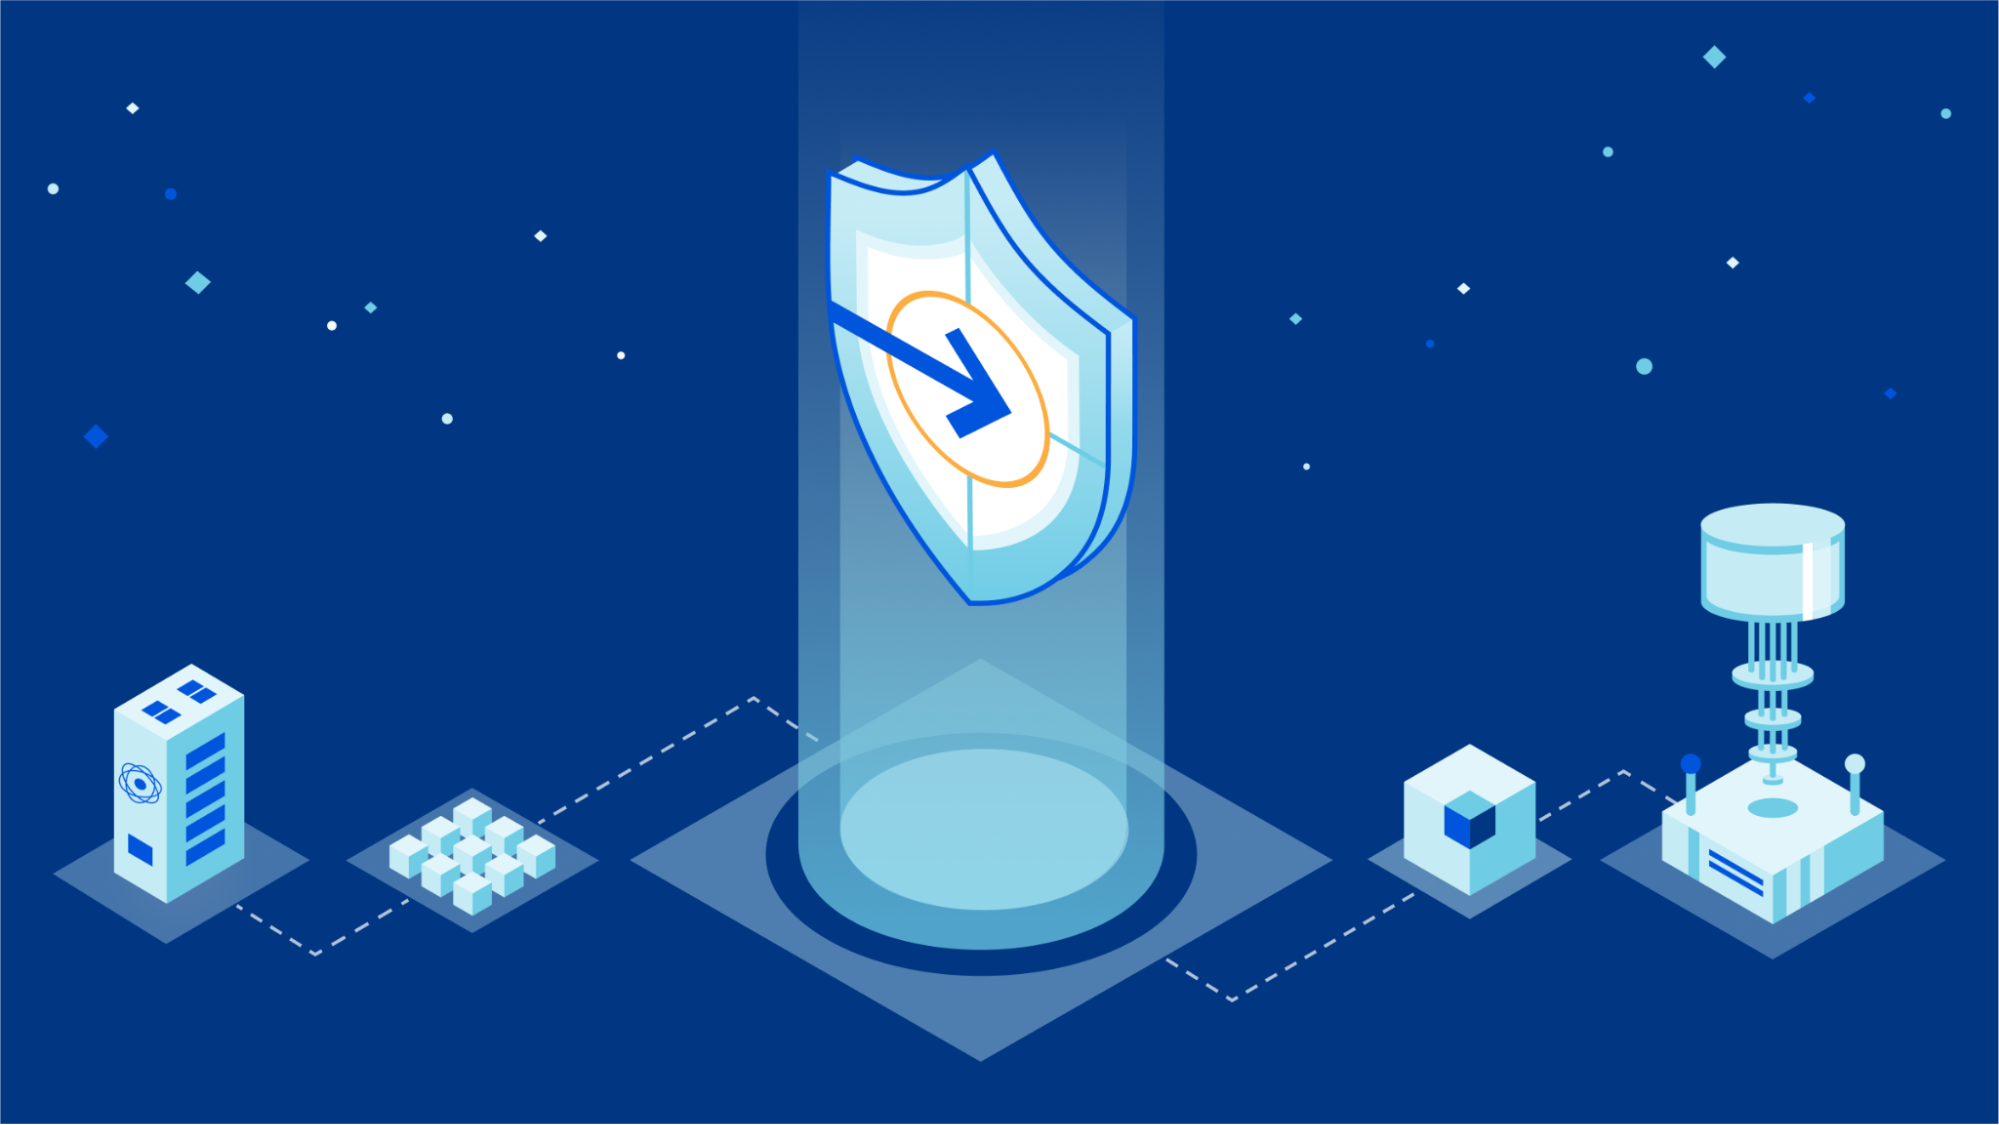
According to the Cloud Security Alliance, the average large enterprise has 946 custom applications deployed. Traditionally, organizations deployed Web Application Firewalls (WAF), which provide visibility and enforce security controls on external traffic that passes through them, at the perimeter to protect these applications against external attacks.
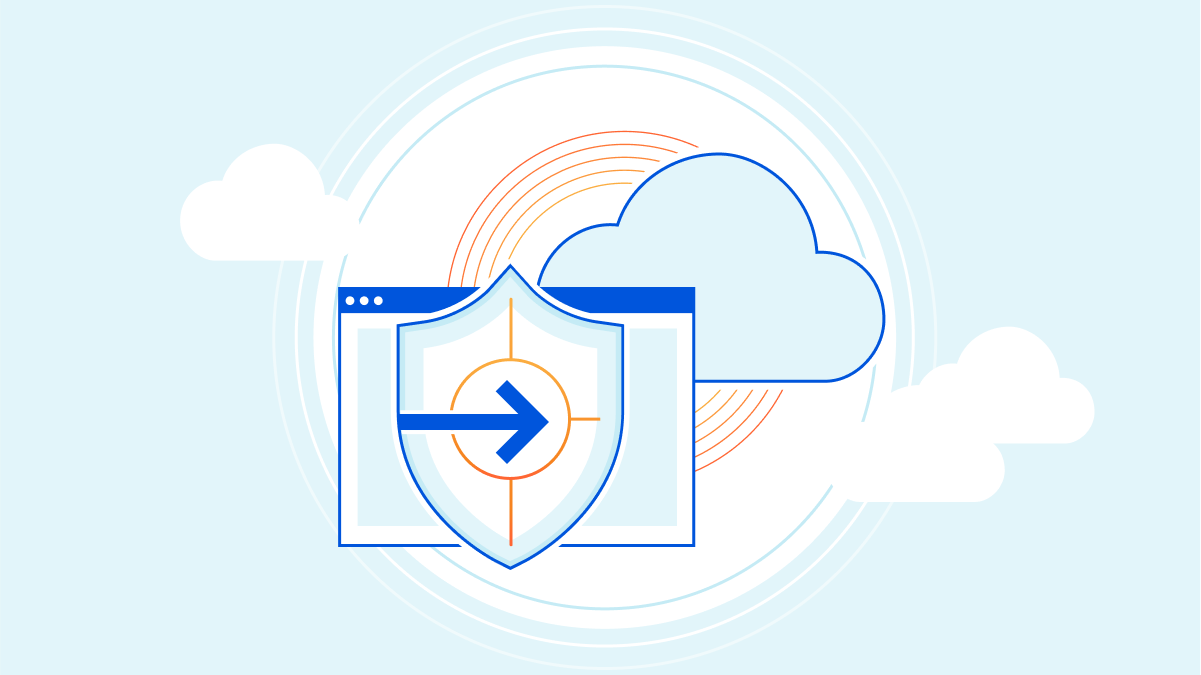
However, WAF-secured container-based applications have a high likelihood of being breached, as the concept of a perimeter does not exist in these architectures. A new approach is needed to address both external threats and threats from lateral movement inside the cluster. In a world where successful exploits may be inevitable, relying on a perimeter WAF for application security leaves your entire environment vulnerable unless adequate security tools and policies are implemented at the workload level.
WAF’s weak security
Security techniques for traditional container-based application architectures are analogous to medieval castles, where everything important to running an application is consolidated within castle walls. In this analogy, WAF played the role of the wall and gate, only letting in friendly traffic.
WAF provides additional capabilities in these traditional architectures. It actively parses through valid requests and threats and provides alerts when it receives suspicious log requests. These alerts keep the security team apprised of threats Continue reading
Sponsored Post: As in so many other aspects of life, not all compute workloads are created equal – they need a more subtle approach to getting the best out of them which brings a more potent balance of hardware and software into the mix. …
On today's Kubernetes Unpacked, Michael and guests explore Windows containers. A few years ago there was a lot of hype around Nano, which then morphed into Nano Server. We look at the current state of containerized Windows, using Windows containers with Kubernetes, customer scenarios for container adoption, and Microsoft's approach to the container space.
On today's Kubernetes Unpacked, Michael and guests explore Windows containers. A few years ago there was a lot of hype around Nano, which then morphed into Nano Server. We look at the current state of containerized Windows, using Windows containers with Kubernetes, customer scenarios for container adoption, and Microsoft's approach to the container space.
In this blog post, we wanted to highlight some ways that Cloudflare and IBM Cloud work together to help drive product innovation and deliver services that address the needs of our mutual customers. On our blog, we often discuss exciting new product developments and how we are solving real-world problems in our effort to make the internet better and many of our customers and partners play an important role.
IBM Cloud and Cloudflare have been working together since 2018 to integrate Cloudflare application security and performance products natively into IBM Cloud. IBM Cloud Internet Services (CIS) has customers across a wide range of industry verticals and geographic regions but they also have several specialist groups building unique service offerings.
The IBM Cloud team specializes in serving clients in highly regulated industries, aiming to ensure their resiliency, performance, security and compliance needs are met. One group that we’ve been working with recently is IBM Cloud for Financial Services. This group extends the capabilities of IBM Cloud to help serve the complex security and compliance needs of banks, financial institutions and fintech companies.
Bot Management
As malicious bot attacks get more sophisticated and manual mitigations become more onerous, a dynamic and adaptive Continue reading
Today, we’re excited to announce a big security enhancement to our Keyless SSL offering. Keyless SSL allows customers to store their private keys on their own hardware, while continuing to use Cloudflare’s proxy services. In the past, the configuration required customers to expose the location of their key server through a DNS record - something that is publicly queryable. Now, customers will be able to use our Cloudflare Tunnels product to send traffic to the key server through a secure channel, without publicly exposing it to the rest of the Internet.
A primer on Keyless SSL
Security has always been a critical aspect of online communication, especially when it comes to protecting sensitive information. Today, Cloudflare manages private keys for millions of domains which allows the data communicated by a client to stay secure and encrypted. While Cloudflare adopts the strictest controls to secure these keys, certain industries such as financial or medical services may have compliance requirements that prohibit the sharing of private keys.In the past, Cloudflare required customers to upload their private key in order for us to provide our L7 services. That was, until we built out Keyless SSL in 2014, a feature that allows customers Continue reading
Millions of customers around the world use Cloudflare to keep their applications safe by blocking bot traffic to their website. We block an average of 336 million requests per day for self-service customers using a service called Super Bot Fight Mode. It is a crucial part of how customers keep their websites online.
While most customers use Cloudflare’s Verified Bot directory to securely allow good, automated traffic, some customers also like to write their own localized integration scripts to crawl and update their website, or perform other necessary maintenance functions. Because these bots are only used on a single website, they don’t fit our verified bot criteria the way a Google or Bing crawler does. This makes Super Bot Fight Mode difficult to manage for these types of customers.
Super Bot Fight Mode: now configurable!
Previously, Super Bot Fight Mode ran as an independent service on our global network and other Cloudflare security services were unable to affect its configuration. To solve this, we’ve rewritten Super Bot Fight Mode behind the scenes. It’s now a new managed ruleset in the new WAF, just like the OWASP Core Ruleset or the Cloudflare Managed Ruleset. This doesn’t change the interface, but Continue reading
News coverage of a recent paper caused a bit of a stir with this headline: “AI Helps Crack NIST-Recommended Post-Quantum Encryption Algorithm”. The news article claimed that Kyber, the encryption algorithm in question, which we have deployed world-wide, had been “broken.” Even more dramatically, the news article claimed that “the revolutionary aspect of the research was to apply deep learning analysis to side-channel differential analysis”, which seems aimed to scare the reader into wondering what will Artificial Intelligence (AI) break next?
Reporting on the paper has been wildly inaccurate: Kyber is not broken and AI has been used for more than a decade now to aid side-channel attacks. To be crystal clear: our concern is with the news reporting around the paper, not the quality of the paper itself. In this blog post, we will explain how AI is actually helpful in cryptanalysis and dive into the paper by Dubrova, Ngo, and Gärtner (DNG), that has been misrepresented by the news coverage. We’re honored to have Prof. Dr. Lejla Batina and Dr. Stjepan Picek, world-renowned experts in the field of applying AI to side-channel attacks, join us on this blog.
At Cloudflare, helping to build a better Internet is not just a catchy saying. We are committed to the long-term process of standards development. We love the work of pushing the fundamental technology of the Internet forward in ways that are accessible to everyone. Today we are adding even more substance to that commitment. One of our core beliefs is that privacy is a human right. We believe that to achieve that right the most advanced cryptography needs to be available to everyone, free of charge, forever. Today, we are announcing that our implementations of post-quantum cryptography will meet that standard: available to everyone, and included free of charge, forever.
We have a proud history of taking paid encryption products and launching it to the Internet at scale for Free. Even at the cost of short and long-term revenue because it’s the right thing to do. In 2014, we made SSL free for every Cloudflare customer with Universal SSL. As we make our implementations of post-quantum cryptography free forever today, we do it in the spirit of that first major announcement:
“Having cutting-edge encryption may not seem important to a small blog, but it is critical to advancing the encrypted-by-default Continue reading
In today’s fast paced world, every second counts and the ability to react to activities in a timely fashion can mean the difference between satisfying the needs of consumers and meeting Service-Level Agreements. Each are goals of Event-Driven Ansible, which seeks to further the reach of Ansible based automation by responding to events that meet certain criteria. These events can originate from a variety of sources, such as from an HTTP endpoint, messages on a queue or topic, or from public cloud resources. Kubernetes has become synonymous with managing infrastructure and applications in cloud native architectures and many organizations are reliant on these systems for running their business critical workloads. Automation and Kubernetes go hand in hand and Ansible already plays a role within this ecosystem. A new capability leveraging the Event-Driven Ansible framework is now available that extends the integration between both Ansible and Kubernetes so that Ansible automation activities can be triggered based on events and actions occurring within a Kubernetes cluster.
Event-Driven Ansible is designed using a concept called Rulebooks which consists of three main components:
Actions - Triggering the execution of assets including an Ansible Playbook or module
Rules - Determination of whether received events Continue reading
Artificial Intelligence is being heavily hyped right now, especially in light of the newer generative AI systems (like ChapGPT). What is the reality behind the hype? Jonathan Bartlett, fellow at the Discovery Institute, joins us for a discussion on AI reality for this episode of the Hedge.
A few weeks ago I described why EBGP TCP packets have TTL set to one (unless you configured EBGP multihop). Although some people claim that (like NAT) it could be a security feature, it’s not a good one. Generalized TTL Security Mechanism (GTSM, described in RFC 5082) is much better.
Most BGP implementations set TTL field in outgoing EBGP packets to one. That prevents a remote intruder that manages to hijack a host route to an adjacent EBGP peer from forming a BGP session as the TCP replies get lost the moment they hit the first router in the path.
Malicious actors are taking advantage of a plethora of new opportunities in the cloud. Here are the top cloud-native risks and strategies for avoiding them.
We are thrilled to announce Cloudflare’s worldwide 2022 Channel Partner Award winners. Each of these partner companies and individuals went above and beyond, demonstrating outstanding commitment to working closely with Cloudflare to build technical competencies and to deliver compelling, integrated security and performance solutions for customers around the globe.
This past year was another milestone year, with record-setting growth for Cloudflare and our partners. The Cloudflare Channel and Alliances Partner Program received the highest, 5-star rating in CRN’s Partner Program Guide. New customer bookings acquired through partners jumped over 28% year over year.
In June, we announced the Cloudflare One Partner Specialization, with tailored enablement and new partner go-to-market resources for Cloudflare One, our SASE solution which includes the industry’s first, 100% Cloud-native Zero Trust platform. More than 1,600 partner sellers and technical sellers have completed Cloudflare Zero Trust training courses, enabling them to deliver the most comprehensive security needed in today’s connect-from-anywhere economy.The Cloudflare Channel Partner Network contributed to the significant market traction we’ve seen for Cloudflare One, including partner-sourced pipeline for Cloudflare One growing 240% from Q1 through Q4 of 2022.
As organizations across industries and the public sector require a fast and secure path to Zero Continue reading