Complexity Of Networking Architecture In The 2020’s
Get the parts of network strategy right today is a daunting task when you think about it
The post Complexity Of Networking Architecture In The 2020’s appeared first on Packet Pushers.
Get the parts of network strategy right today is a daunting task when you think about it
The post Complexity Of Networking Architecture In The 2020’s appeared first on Packet Pushers.
Managing virtual machines in an IT infrastructure is often a common task, specifically VMware virtualization technology has been around for over 20 years. VMware administrators spend a lot of their time in automating the creation, management, and removal of virtual instances that contain various operating systems. One operating system that often resides on VMware infrastructure is Red Hat Enterprise Linux.
With the introduction of VMware REST APIs, we recently announced the initial release of the vmware.vmware_rest Collection, for production use. As opposed to the community.vmware Collection, the vmware.vmware_rest Collection is based on next generation VMware REST APIs. This new Collection no longer requires any third party Python bindings to communicate with VMware infrastructure. A large part of the new Collection that has been introduced is support for automating virtual machine operations.
In this blog post I will show you how VMware users can automate the installation of Red Hat Enterprise Linux 8 (RHEL 8) using the vmware.vmware_rest.vcenter_vm module and a valid Kickstart file.
For this scenario, we will assume following requirements:
We are pleased to announce that Calico Cloud, our software as a service (SaaS) for Kubernetes security and observability, is now available on AWS Marketplace! AWS users can now use Kubernetes security and observability as services along with managed Kubernetes services, all with a single click. For more information, see our official press release.
Can’t wait to jump right in? Subscribe and deploy Calico Cloud on AWS Marketplace here.
The post Calico Cloud now available on AWS Marketplace appeared first on Tigera.
Recall what was happening a decade ago? While 2011 doesn’t seem that long ago (you remember, the Royal Wedding, Kim Kardashian’s divorce, and of course Charlie Sheen’s infamous meltdown), a lot has changed in 10 years. Back then, most data centers were just starting to experiment with virtualization. Remember when it was considered safe for only a handful of non-essential workloads to go virtual? Well, today about half of the servers globally have become virtualized, and we’ve moved well beyond just virtualization. Nearly every enterprise data center has become a hybrid environment, with a mix of physical and virtual storage and compute resources. Containerization and the technologies supporting it are starting to take hold. And of course, cloud computing has become pervasive in all aspects of enterprise computing.
Now, the business benefits of today’s software-defined data center are many, especially in terms of resource efficiency and cost savings. But there’s no denying that complexity has also increased, because all the same resources are still needed—compute, storage, switching, routing—but now any number of these resources may be on-prem or in the Continue reading
When I was in the military we were constantly drilled about the problem of Essential Elements of Friendly Information, or EEFIs. What are EEFis? If an adversary can cast a wide net of surveillance, they can often find multiple clues about what you are planning to do, or who is making which decisions. For instance, if several people married to military members all make plans to be without their spouses for a long period of time, the adversary can be certain a unit is about to be deployed. If the unit of each member can be determined, then the strength, positioning, and other facts about what action you are taking can be guessed.
Given enough broad information, an adversary can often guess at details that you really do not want them to know.
What brings all of this to mind is a recent article in Dark Reading about how attackers take advantage of publicly available information to form Spear Phishing attacks—
Going back further Continue reading
There has been talk and cajoling and rumor for years that GPU juggernaut Nvidia would jump into the Arm server CPU chip arena once again and actually deliver a product that has unique differentiation and a compelling value proposition, particularly for hybrid CPU-GPU compute complexes. …
Nvidia Enters The Arms Race With Homegrown “Grace” CPUs was written by Timothy Prickett Morgan at The Next Platform.
We often focus on the largest high performance computing deployments but a bulk of real enterprise HPC workloads happen in far less sophisticated environments, albeit with applications that still the need scalability, performance, and efficiency the big centers can provide. …
Implementing Commercial HPC Still an Uphill Climb was written by Nicole Hemsoth at The Next Platform.

Encryption in danger: Encryption is essential, but a number of countries are trying to weaken its protections, Wired.com says. Recent attempts to weaken encryption have happened in Germany, Brazil, India, and other countries. “Technical as encryption can be, it is really about something at the very core of how we live our lives today: Should […]
The post The Week in Internet News: Encryption Faces Serious Threats appeared first on Internet Society.
On this week's Network Break we cover Arista's careful steps into automation, new support for SONiC from Innovium, a cash injection for whitebox NOS maker Pica8, a startup tackling cloud infrastructure and application experience, and why you can blame cosmic rays the next time there's a network problem.
The post Network Break 328: Arista CloudVision Adds Config Workflow Automation; Innovium ASICs Embrace SONiC appeared first on Packet Pushers.


Welcome to Developer Week at Cloudflare! We are excited to announce we are running a series of Developer Challenges throughout the week to give you the excuse you needed to play with all our new features.
Between now and April 19 you’ll get to know the Cloudflare developer tools and walk away with a fun new app (or five) to your name. You’ll also become a part of the Cloudflare Developer community!
We hope that some of you will be inspired to create your next project using Cloudflare Workers, Workers KV, Pages, Durable Objects and all the developer-focussed products that Cloudflare offers. There’s already a vibrant community building applications using the Workers ecosystem; we hope the Developer Challenges inspire you to build on Cloudflare.
We know that some people are new to the Cloudflare services for developers and that some of you have been using them for a while, so we have come up with two streams of challenges.
If you’re just getting started with Cloudflare, there will be a new challenge each day of the week that will help you level up your knowledge in no time. There’s also an extra bonus challenge Continue reading
 We are doing the first ever Packet Pushers LiveStream on Thursday, April 22nd 1000PST/1300CET/1700GMT. Our take on a LiveStream is a cross between live podcast, presentation and interviews where the audience can join us live for recording. Our sponsor is Alkira and Multi-Cloud Networking. The Alkira product is interesting in its ability to build network […]


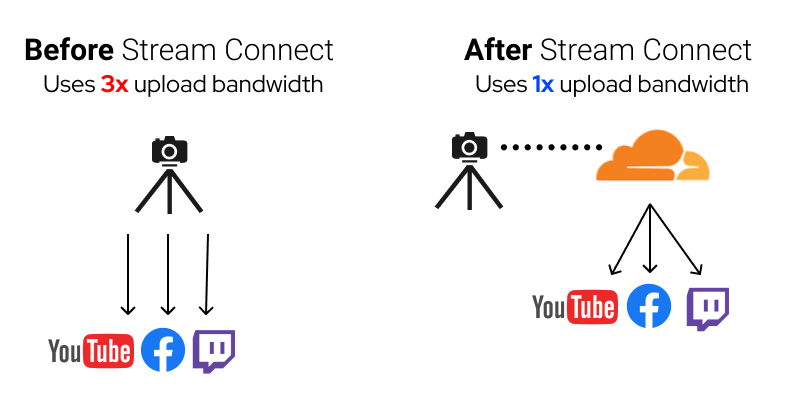
Today, we are announcing the Stream Connect beta, the first step towards supporting end-to-end live broadcasting on Cloudflare. You can use Stream Connect to push RTMPS feeds to the Cloudflare edge and have it restreamed to your audience on any platform that supports RTMPS such as Facebook, YouTube and Twitch.
Facebook, YouTube and Twitch are great platforms for creators to broadcast live video to reach billions. They each have their own unique communities and benefits for creators. If you have a band and want to broadcast a live performance for your fans, broadcasting to only one platform limits your reach. Restreaming enables you to push the live video to multiple platforms at the same time so you can meet your fans on their preferred platform.
Live video platforms accept incoming connections using a protocol called RTMP or RTMPS. Stream Connect allows you to continue using the same protocol as before. However, instead of using your local connection to send the video feed to multiple platforms, you only send it to Stream Connect. Connect uses the Cloudflare network to send your live feed to the configured media platforms.

In December, we announced the beta of Cloudflare Pages: a fast, secure, and free way for frontend developers to build, host, and collaborate on Jamstack sites.
It’s been incredible to see what happens when you put a powerful tool in developers’ hands. In just a few months of beta, thousands of developers have deployed over ten thousand projects, reaching millions of people around the world.
Today, we’re excited to announce that Cloudflare Pages is now available for anyone and ready for your production needs. We’re also excited to show off some of the new features we’ve been working on over the course of the beta, including: web analytics, built in redirects, protected previews, live previews, and optimized images (oh, my!). Lastly, we’ll give you a sneak peek into what we'll be working on next to make Cloudflare Pages your go-to platform for deploying not just static sites, but full-stack applications.
Cloudflare Pages radically simplifies the process of developing and deploying sites by taking care of all the tedious parts of web development. Now, developers can focus on the fun and creative parts instead.
Getting started with Cloudflare Pages is as Continue reading
We’re excited to announce that our latest Noction Flow Analyzer v 21.04 has just been released, giving users the: Improved and Refined BGP
The post NFA v 21.04: improved BGP reporting, extensive API, L2 MAC addresses visibility, and more. appeared first on Noction.
As a technologist helping an organization form an IT strategy, I’m usually hesitant to recommend new tech. Why? Because it’s new. Adopting technology early in its lifecycle is a risky endeavor. For most organizations, I find that shiny new tech isn’t worth the risk.
Emerging products and protocols are often accompanied by great fanfare. Talks are delivered at conferences, whitepapers are written, and Gartner Cool Vendor designations are awarded. The idea is to make you and me believe that this new tech solves a problem in a novel way that’s never been done before. This is the thing we’ve been waiting for. This is so much better than it used to be in the bad old times. Right. I’m sure it is.
Despite my cynical tone, I am hopeful when it comes to new tech. I really am. In part, technologists are employed because of tech’s ever-changing landscape. But I am also dubious during any technology’s formative years. I take a wait-and-see approach, and I’ve never been sorry for doing so. I believe that being a late, not early, adopter of technology pays off for most organizations.
If you adopt early, you are hoping Continue reading