Bryan Liles kicked off the day 3 morning keynotes with a discussion of “finding Kubernetes’ Rails moment”—basically focusing on how Kubernetes enables folks to work on/solve higher-level problems. Key phrase from Bryan’s discussion (which, as usual, incorporated the humor I love to see from Bryan): “Kubernetes isn’t the destination. Kubernetes is the vehicle that takes us to the destination.” Ian Coldwater delivered a talk on looking at Kubernetes from the attacker’s point of view, and using that perspective to secure and harden Kubernetes. Two folks from Walmart also discussed their use case, which involves running Kubernetes clusters in retail locations to support a point-of-sale (POS) application at the check-out register. Finally, there was a discussion of chaos engineering from folks at Gremlin and Target.
No Breakout Sessions
Due to booth duty and my flight home, I wasn’t able to attend any breakout sessions today.
Event Summary
If I’m completely honest, I didn’t get as much out of the event as I’d hoped. I’m not yet sure if that is because I didn’t get to attend as many sessions as I’d hoped/planned (due to problems with sessions being moved/rescheduled or whatever), if my choice of sessions was just poor, Continue reading
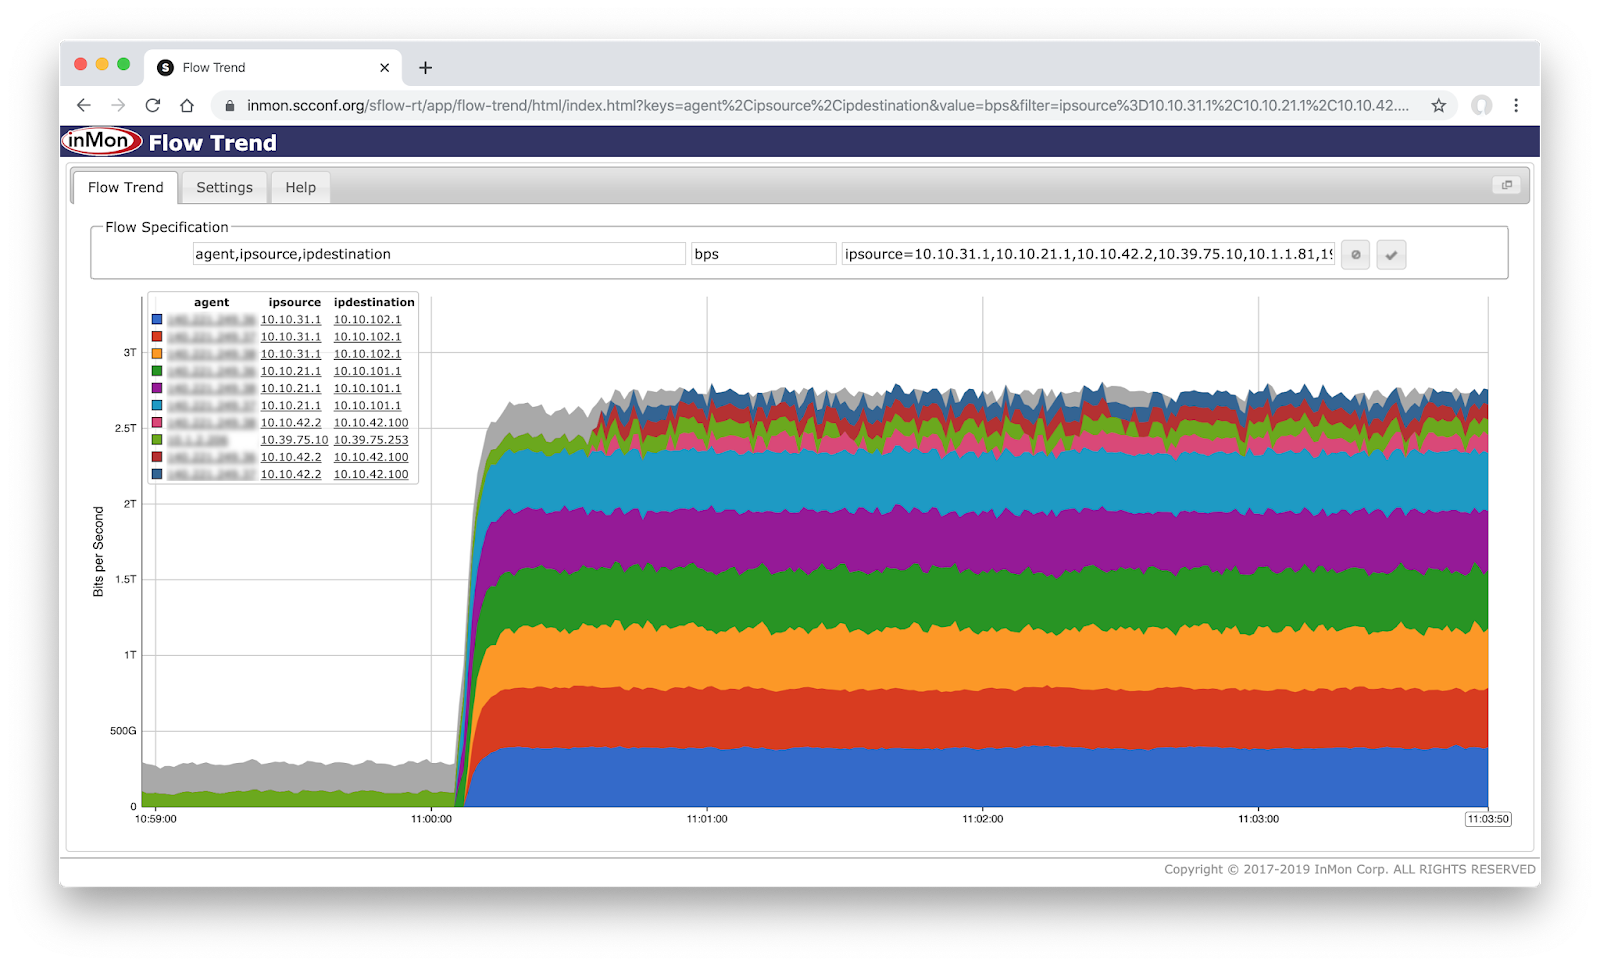
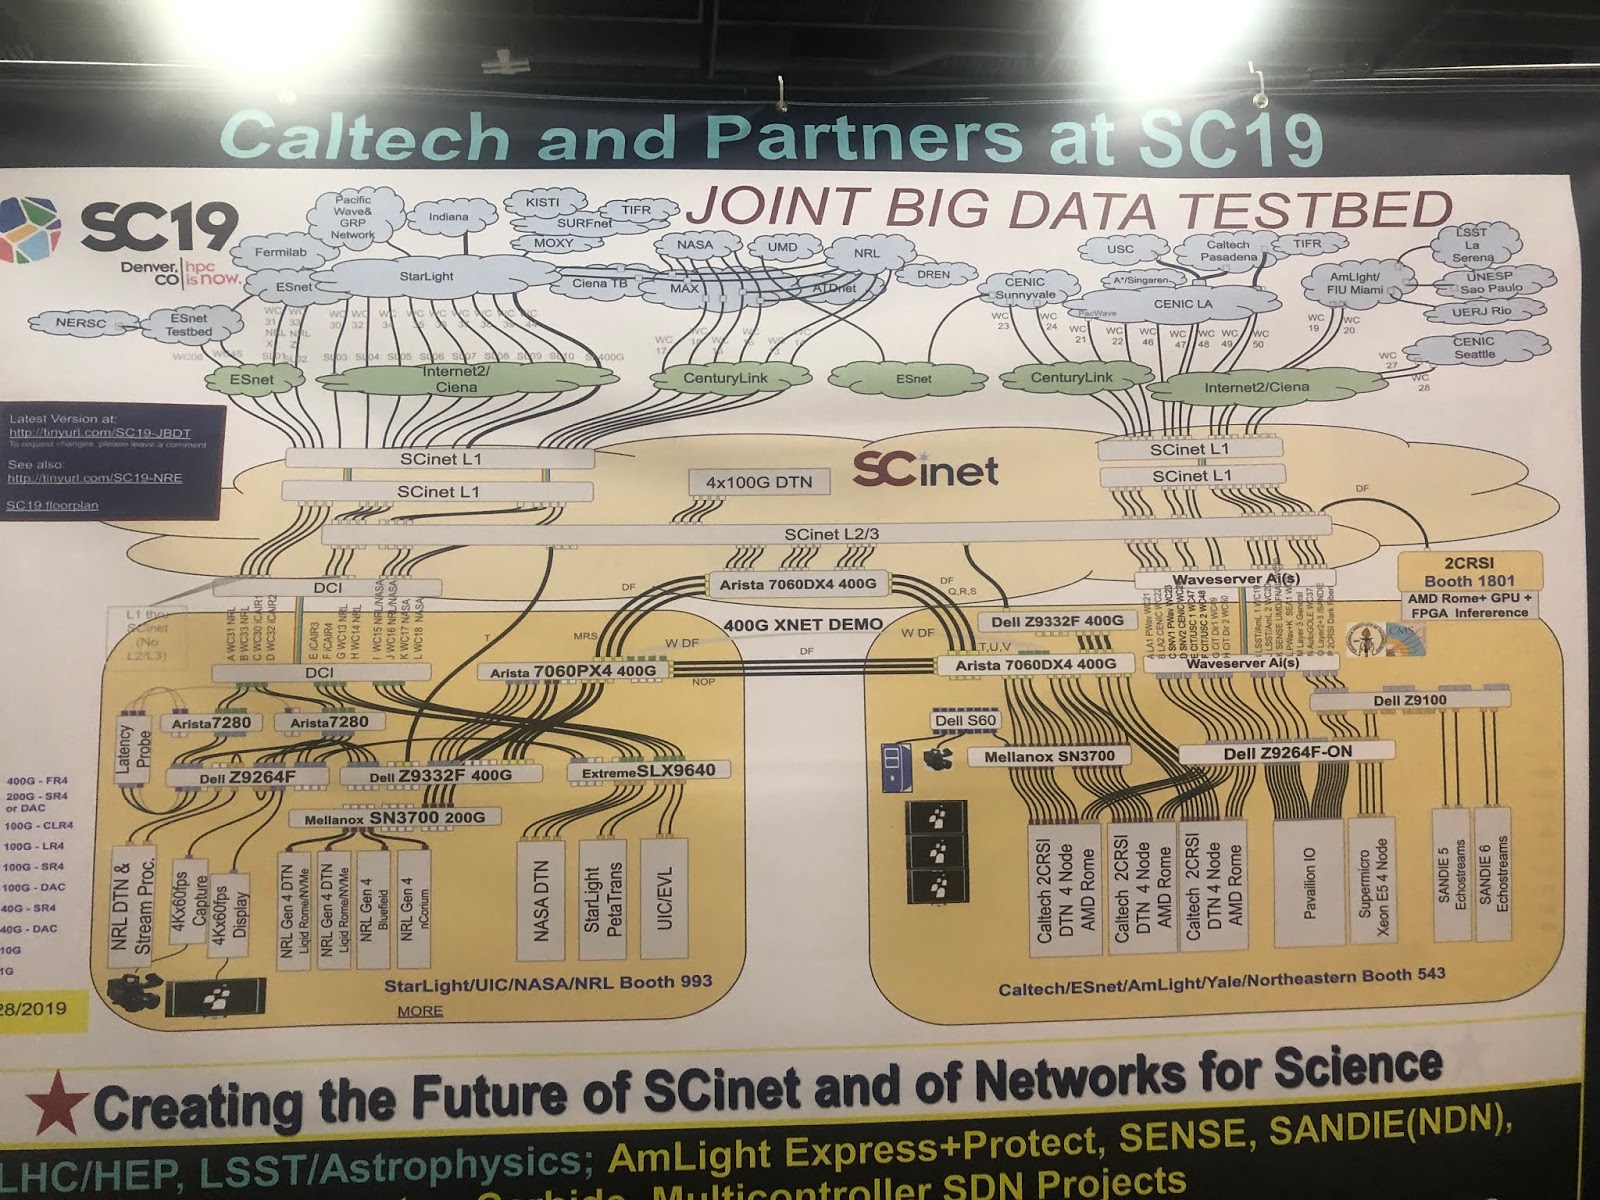
The Flow Trend chart above shows a real-time, up to the second, view of nearly 3 terabits per second of traffic flowing across the SCinet network, described as the fastest, most powerful volunteer-built network in the world. The network is build each year to support The International Conference for High Performance Computing, Networking, Storage, and Analysis. The SC19 conference is currently underway in Denver, Colorado.
400GE First Data Networks: Caltech, Starlight/NRL, USC, SCinet/XNET, Ciena, Mellanox, Arista, Dell, 2CRSI, Echostreams, DDN and Pavilion Data, as well as other supporting optical, switch and server vendor partners will demonstrate the first fully functional 3 X400GE local ring network as well as 400GE wide area network ring, linking the Starlight and Caltech booths and Starlight in Chicago. This network will integrate storage using NVMe over Fabric, the latest high throughput methods, in-depth monitoring and realtime flow steering. As part of these demonstrations, we will make use of the latest DWDM, Waveserver Ai, and 400GE as Continue reading
Portworx sponsored The New Stack’s coverage of KubeCon+CloudNativeCon North America 2019.
While you may thinking of Kubernetes as the future of computing, but it was, until recently, still stuck in the past in one way, namely that it was built on IPv4, the widely-used, though a soon-to-be-legacy version of the Internet Protocol upon which the internet was built.
The Internet Engineering Task Force has been long urging the internet service providers to move to IPv6, now that the world has exhausted the supply of 32-bit IPv4 addresses. With its 128-bit address space, IPv6 will offer an inexhaustibly supply of internet addresses.
“We ignored it,” admitted KubeCon + CloudNativeCon North America 2019 conference he gave with
BitLife:
Life Simulator, also called BitLife for short, is digital-based,
single player cartoon video game for Android / iOS released in 2018 by
CandyWriter LLC. The game has become extremely popular, as people live the
simulated digital life that they choose. Many players of this game want to
become famous winning the “Famous Ribbon,” but becoming famous is no
cake-walk, as you will have to spend years of your life working towards fame
and fortune you want and feel you deserve. Still, for those brave souls with
that much time on their hands, here are a few tips on how to get famous in
BitLife.
How to Get Famous in BitLife in 4
Steps
Start Out Good Looking
Being
good looking is extremely important in your effort to becoming famous. So, you
may want to keep resetting your character until you score at 80% in the looks
department. The better looking you are and become throughout your life, the
easier it may be to become famous. Later, in life you can choose to have plastic
surgery or other procedures in order to help you become better looking.
Remember, we’re talking about a video game life simulator here, not Continue reading
It has been a great pleasure and an honor working with Tarique Shakil and Vinit Jain on this book below, deep-diving on this amazing LISP protocol.
I would like also to take this opportunity to thank Max Ardica, Victor Moreno and Marc Portoles Comeras for their invaluable help. I wrote the section on LISP Mobility deployment with traditional and modern data center fabrics (VXLAN EVPN based as well as ACI Multi-Pod/Multi-Site), however this could not have been done without the amazing support of these guys.
Implement flexible, efficient LISP-based overlays for cloud, data center, and enterprise
The LISP overlay network helps organizations provide seamless connectivity to devices and workloads wherever they move, enabling open and highly scalable networks with unprecedented flexibility and agility.
LISP Network Deployment and Troubleshooting is the definitive resource for all network engineers who want to understand, configure, and troubleshoot LISP on Cisco IOS-XE, IOS-XR and NX-OS platforms. It brings together comprehensive coverage of how LISP works, how it integrates with leading Cisco platforms, how to configure it for maximum efficiency, and how to address key issues such Continue reading
Extreme this week took the wraps off new automation software and switches aimed at helping customers quickly turn-up and manage new data-center networking segments.Key to the network vendor’s data-center plans is an upgraded version of its Extreme Data Center Fabric, which has been available for over a year and is now upgraded to let customers deploy a fabric in minutes. Once devices are cabled togtther and powered on, customers run the Extreme Fabric Automation application from any Extreme SLX spine or leaf switch, which then confirms configuations, validates and tests the network to ensure it is set up and operating correctly.To read this article in full, please click here
Extreme this week took the wraps off new automation software and switches aimed at helping customers quickly turn-up and manage new data-center networking segments.Key to the network vendor’s data-center plans is an upgraded version of its Extreme Data Center Fabric, which has been available for over a year and is now upgraded to let customers deploy a fabric in minutes. Once devices are cabled togtther and powered on, customers run the Extreme Fabric Automation application from any Extreme SLX spine or leaf switch, which then confirms configuations, validates and tests the network to ensure it is set up and operating correctly.To read this article in full, please click here
Internet security is accomplished by many
unsung heroes. People who put their talent and passion into improving the
Internet, making it secure and trustworthy. This is a feature of the Internet: security
isn’t achieved through a central mandate but through the hard work and tenacity
of individuals working across the globe.
Rachel Player, a cryptographic researcher, is one of those unsung heroes. She’s just been awarded the Radiant Award from the Internet Security Research Group, the folks behind Let’s Encrypt, for her work in post-quantum cryptography and homomorphic encryption. Homomorphic encryption allows people to do computations on encrypted data, so that information can remain private and still be worked with. This is a highly-relevant field in any area that deals with sensitive and personal data, such as medicine and finance. Player is also interested in lowering the barriers for young people – young women, especially – to work professionally on topics like cryptography.
Machine learning is a powerful tool for statistical analysis that allows businesses to gain valuable insights, and many companies are catching on. As such, the demand for programmers who have R environment skills is quickly growing, and with this certification course bundle, you too can learn statistical analysis with R for $29.The Complete R Programming Certification Bundle features 6 courses on how to apply the R programming language to data visualization, social media mining, and more. If you have zero R experience, the first course you should take is Statistics & Machine Learning for Regression Modeling with R. This course will introduce you to the OLS regression and how to create regression models for machine learning.To read this article in full, please click here
Today, we’re excited to open source Flan Scan, Cloudflare’s in-house lightweight network vulnerability scanner. Flan Scan is a thin wrapper around Nmap that converts this popular open source tool into a vulnerability scanner with the added benefit of easy deployment.
We created Flan Scan after two unsuccessful attempts at using “industry standard” scanners for our compliance scans. A little over a year ago, we were paying a big vendor for their scanner until we realized it was one of our highest security costs and many of its features were not relevant to our setup. It became clear we were not getting our money’s worth. Soon after, we switched to an open source scanner and took on the task of managing its complicated setup. That made it difficult to deploy to our entire fleet of more than 190 data centers.
We had a deadline at the end of Q3 to complete an internal scan for our compliance requirements but no tool that met our needs. Given our history with existing scanners, we decided to set off on our own and build a scanner that worked for our setup. To design Flan Scan, we worked closely with our auditors to understand Continue reading
Joep Piscaer will dive into what changes public clouds bring and what these changes mean for you, as well as what developers and other consumers of cloud resources expect from you in the new public cloud, DevOps and Infrastructure-as-Code world.
Ned Bellavance will review the principles of Infrastructure as Code (IaC) and how they apply to public cloud solutions. Then he will take a look at the landscape of IaC tools that exist and examine their pros and cons.
Howard Marks will review the types of storage available across public clouds, how they differ between cloud providers and the applications and pitfalls associated with each of them.
Connecting on-premises data centers or office locations to a public cloud has some unique challenges. Ed Horley will help you create a framework and a checklist to make sure you have the required redundancy, throughput, routing, and security all baked in from day one.
Matthias Luft will cover the aspects of securing your public cloud deployments.
Justin Warren will explain how to make good tradeoffs between Continue reading
In this episode of Network Neighborhood, we welcome Ramzi Marjaba, Hybrid Senior Sales Engineer at Ixia Solutions Group at Keysight Technologies. Ramzi is also the creative power behind WeTheSalesEngineers.com, a career-oriented resource site for sales engineers featuring a blog, a podcast, and more.
The Linux distribution ecosystem is pretty set, with Red Hat and Canonical in the leadership positions, followed closely by SuSe and home brews from the likes of IBM and other major vendors. Even Microsoft has its own distro for Azure users.And then there is Cumulus Networks, which specializes in networking software. It just released Cumulus Linux 4.0 and NetQ 2.4, its cloud network deployment and management console. With this release, Cumulus is claiming its Linux is its most stable and reliable software stack yet and NetQ is the most comprehensive end-to-end network automation product.To read this article in full, please click here